 Legislative Analyst's Office
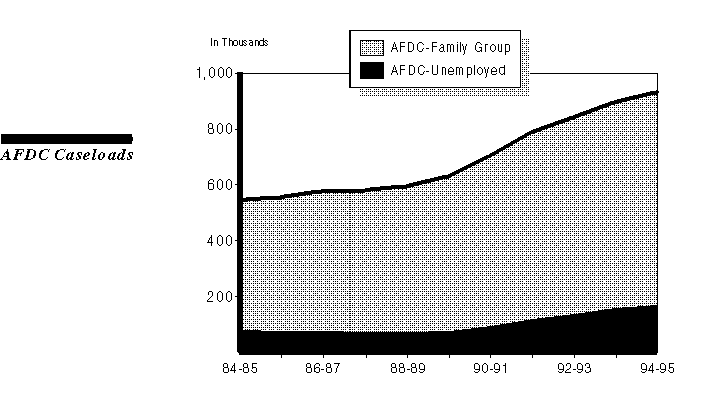
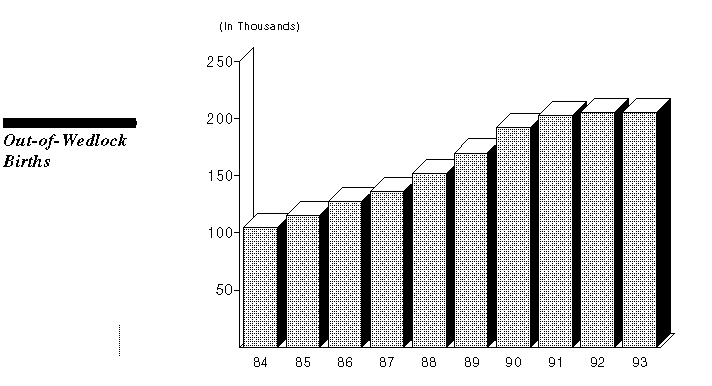
During the last ten years, the AFDC-Family Group (AFDC-FG) caseload has increased at an annual rate of 5 percent. This increase is primarily a result of the increase in the number of women of childbearing age. Societal changes such as the increase in births to unwed mothers have also contributed to this increase.
The AFDC-Unemployed Parent (AFDC-U) caseload grew at an annual rate of 7.9 percent, primarily due to economic changes, such as the recession beginning in 1990.
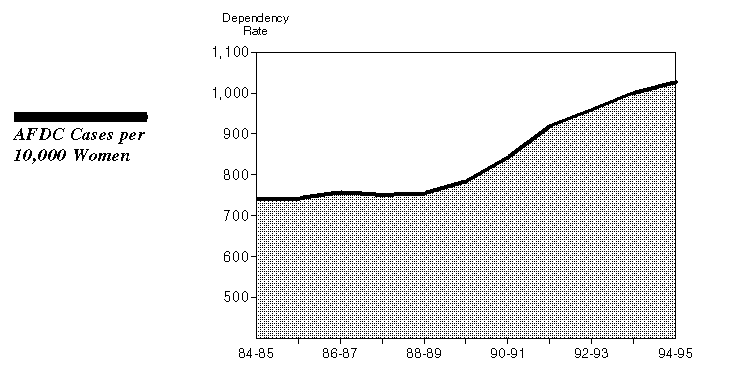
Just because the number of AFDC cases is increasing does not necessarily mean that Californians are more dependent on welfare benefits than in the past. This is because the increase could be simply the result of increasing population. One way to determine if more Californians are dependent on AFDC is to examine the number of AFDC (Family Group) cases per 10,000 women age 15 through 44, thereby controlling for population changes. The AFDC dependency rate remained constant between 1984-85 and 1988-89, thereby suggesting that population increase (women of child-bearing age) was the dominant factor in explaining AFDC caseload growth during this period. Since 1988-89, the AFDC dependency rate has increased by 36 percent, from 756 AFDC cases per 10,000 women (age 15 through 44) to 1,026 cases per 10,000 women. This suggests that factors other than just population growth are causing increased welfare dependency.
The AFDC-FG caseload has increased primarily as a result of the increase in the number of women of childbearing age. Societal changes such as the increase in births to unwed mothers also have played an increasing role in AFDC-FG caseload growth.
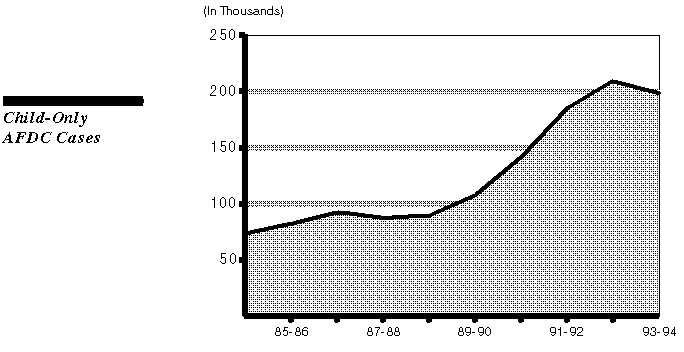
A large share of the recent AFDC caseload growth has occurred in "child-only" cases, most of which are children of undocumented or recently legalized immigrants.
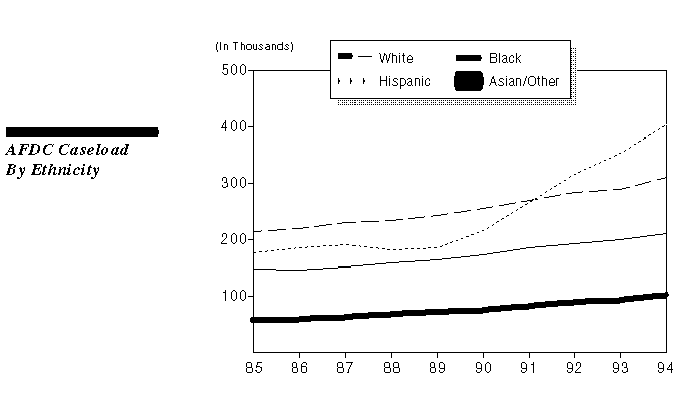
As the graph shows, the number of Hispanic cases on AFDC has increased at a relatively fast rate--the amount doubling between 1985 and 1993, with virtually all of the increase occurring since 1989. Much of the increase can be attributed to the general growth in the state's Hispanic population, specifically women of child-bearing age. Between 1985 and 1993, the population of Hispanic women of child-bearing age increased by 42 percent. In addition, a large part of the increase is in child-only AFDC cases (most of which are children of undocumented parents or recently legalized immigrants) as we have indicated earlier.
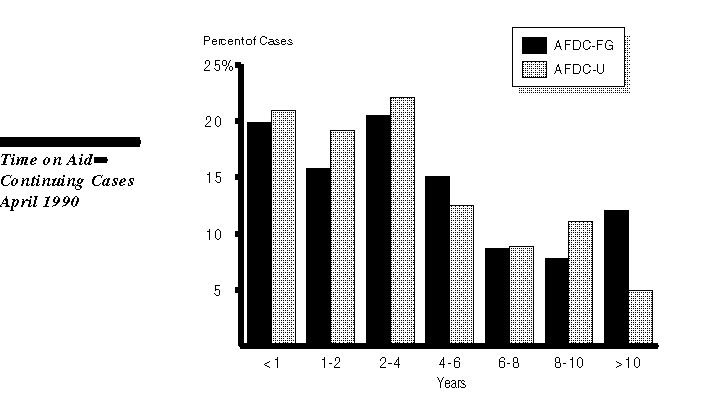
Based on a survey of AFDC recipients in April 1990, 20 percent of AFDC-FG cases had been on aid for less than one year and 12 percent for more than ten years (total time on aid, including repeat cases where applicable). The median time on aid for AFDC-FG recipients was three and one-third years. This is an increase of about one-half year over the median time on aid for similar recipients 15 years earlier in 1975.
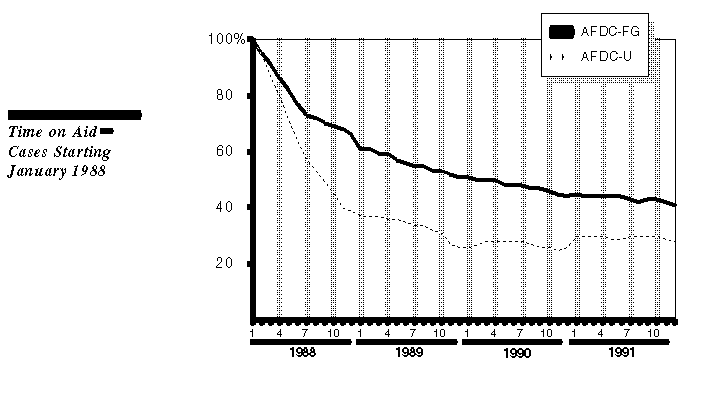
The preceding analysis is based on a "snapshot" of cases at a point in time, regardless of when the cases started on aid. Another way to measure time on aid is to track what happened to cases that started on aid at the same time. The following graph tracks all the cases that began aid in January 1988. It shows that 41 percent of AFDC-FG and 28 percent of AFDC-U households were on aid after four years. The shorter average time on aid among AFDC-U cases probably reflects the fact that these cases are two-parent families that have a work history.
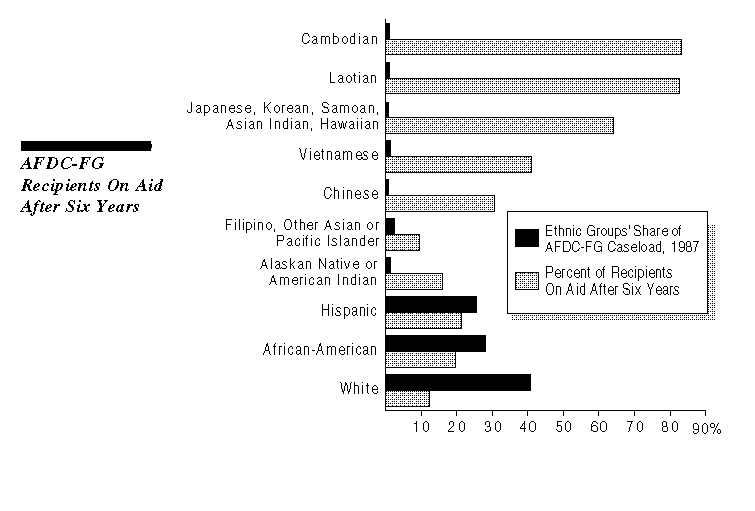
Time on aid also varies among ethnic groups. The chart reflects the relatively long stays by refugee groups.
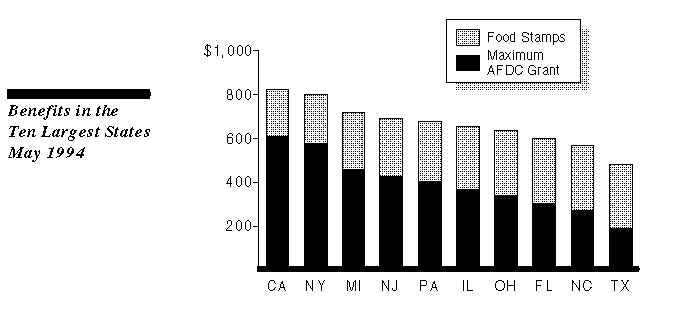
In May 1994, California's combined AFDC and Food Stamps benefit level was the highest of the ten largest states. (The grant levels represent the maximum aid payment for a family of three.)
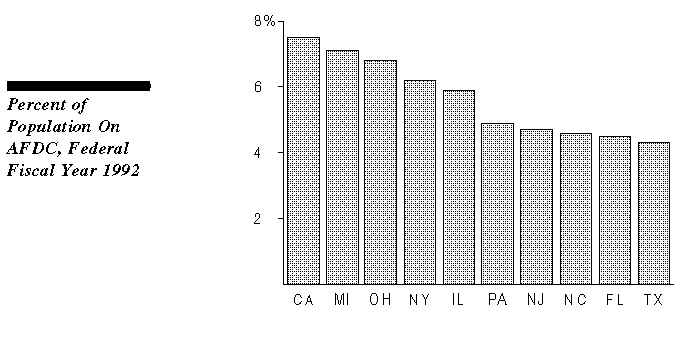
In 1992, California had the largest AFDC caseload and the highest share of the population receiving AFDC of the ten largest states. While not shown in the figure, the percent of California's population on AFDC is about the same level as it was in 1970.
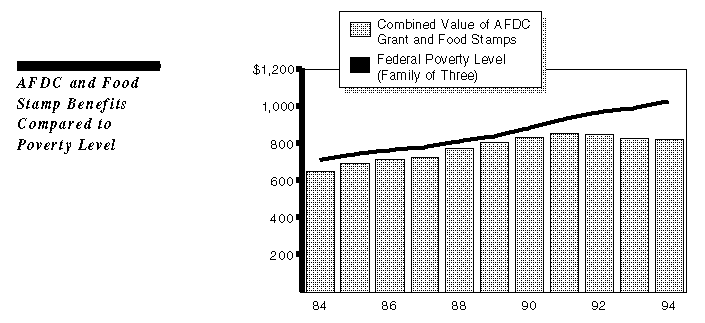
In July 1994, the monthly combined AFDC and Food Stamps benefit for a family of three was $821, or 80 percent of the Federal Poverty Level. This gap has been increasing since 1989, when the combined AFDC and Food Stamps benefit was 96 percent of the Poverty Level.
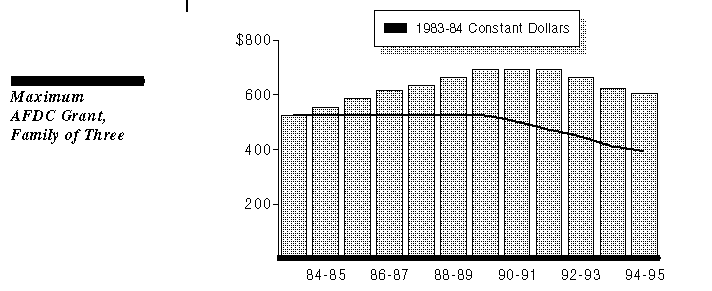
When adjusted for the effects of inflation, California's AFDC grant for a family of three remained about the same between 1983-84 and 1989-90. Beginning in September 1991, the maximum AFDC grant has been reduced four times for a combined reduction of nearly 13 percent.