
 |
Why
County Revenues Vary:
|
Background |
Ever since the state adopted its first constitution, California counties have played a major role in providing services to the state's residents. Despite these significant responsibilities, the way in which counties finance their operations remains a mystery to many. This report provides a detailed look at a group of revenues that counties depend on extensively their general purpose revenues. Specifically, this report reviews the five largest sources of county general purpose revenues, and explains how much money each county gets, and why. |
LAO Findings |
The report finds that:
|
Conclusion |
The Legislature has long acknowledged the need for reforming California's system of county finance. By adopting trial court realignment and welfare reform last year, as well as other recent changes, the Legislature ameliorated some of the funding problems counties face (which were exacerbated by the property tax shift of the early 1990s). Yet, the fundamental dilemma of counties remains: (1) counties have little control over their expenditures or revenues, and (2) county supervisors are elected locally, but have few tools to respond to local preferences. Ultimately, we believe the Legislature will need to broadly reexamine county government responsibilities and finance. Implementing any changes in these areas will be difficult as they will require trade-offs between multiple policy objectives and interests. |
Ever since California adopted its first constitution, California counties have played a major role in providing services to the state's residents. For example, California's counties prosecute and incarcerate most felons, supervise most felons released into the community, administer most welfare programs for families, respond to cases of child and elder abuse, maintain most libraries, operate the trial courts, and provide services for people with drug and alcohol addictions and the mentally ill.
Despite the significant role counties play, the way in which counties finance their programs remains largely unknown. This limited information is unfortunate, because it impedes a citizen's and policymaker's ability to influence the scope and scale of county programs, and to understand the constraints on county budgets. In addition, the information limitations impede Californians' ability to evaluate the state's overall system of county finance.
This report provides a detailed look at a group of revenues that counties rely on extensively, namely their "general purpose revenues" or money counties use for program purposes of their own choosing. Although total county general purpose revenues are smaller than the revenues counties receive from the state and federal governments for specific programs, this report focuses its attention on county general purpose revenues because they serve as each county's fiscal foundation. Simply put, virtually no county responsibility can be fulfilled without an expenditure of general purpose revenues, either as the main funding source or as some of the local "match" for state and/or federal funds. In addition, in many cases, a county's capacity to expand a program's operations--such as programs to respond to child abuse, help people with drug or alcohol addictions, or work with troubled youths--ultimately depends on the county's ability to access additional general purpose revenues.
This report begins with a brief overview of county use of
general purpose revenues and county differences, and then
explains how much general purpose revenue each county receives
from these sources--and why. The report concludes with
observations regarding the variations in county revenues.
Five principal revenue sources--each under the Legislature's
control--make-up most of the county fiscal foundation: property
taxes, two sales taxes, vehicle license fees, and trial court
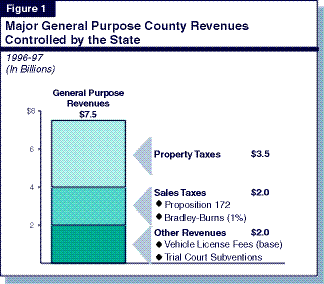
subventions. Together, as Figure 1 shows, these revenues
total $7.5 billion, or $233 per California resident. The
amount of general purpose revenue any county receives from these
sources, however, varies tremendously due to state laws and local
conditions, as will be discussed in this report.
How do counties spend general purpose revenues? California
counties are all responsible for providing three basic types of
services to their residents:
Each category of services requires some county general purpose
revenues.
Statewide, 7.1 million people (22 percent of the state's population) live outside a city's boundaries, or in an area that is both a city and a county (San Francisco). In these cases, counties are responsible for providing "municipal" services to the residents and businesses. These services typically include sheriff patrol and land use planning, and may include fire protection, libraries, water, sewer, refuse collection, park and recreation services (if these services are not provided by a special district or through the private sector).
Although counties typically offset some of their costs to provide municipal services with user fees, some programs--such as sheriff patrol--are not amenable to user fee financing. In these cases, counties pay for the cost of the municipal program with general purpose revenues. Statewide, counties spend over $1 billion of their general purpose revenues providing municipal services to people and businesses.
Counties administer many social service and health programs on behalf of the state and federal governments. These programs include cash aid to families with children (CalWORKs, or California Work Opportunity and Responsibility to Kids), Food Stamps, foster care, and In-Home Supportive Services. Typically, the state or federal government makes most of the key policy decisions regarding these programs and pays most program costs. Counties, however, are responsible for administering these programs and paying a share of the programs' costs. Counties, statewide, spend $1 billion to $1.5 billion of their general purpose revenues for this purpose.
The Constitution and state law assign counties many responsibilities for providing services to all county residents. These area-wide programs include: prosecuting criminals, jailing offenders, supervising criminals released into the community, operating the trial courts, administering elections, collecting the property tax, and aiding the indigent who are ineligible for state or federal assistance. While counties operate these programs pursuant to state and federal restrictions and requirements, we classify these programs as "county services" because counties generally have much greater responsibility and authority over these programs than the state and federal programs described above.
Counties use their general purpose
revenues to pay for a large share of these programs. In some
cases, however, the state provides fiscal assistance, or has
authorized counties to transfer some program costs to cities.
(For example, the state authorized counties to offset some of
their jail costs by charging fees to cities to book people
arrested into county jail--Chapter 466, Statutes of 1990 [SB
2557, Maddy]). Statewide, counties devote more general purpose
revenue to these area-wide programs than for the two other sets
of program responsibilities combined--or about $5 billion of
their general purpose revenues from property taxes, sales taxes,
vehicle license fees, and trial court subventions.
The primary purpose of this report is to examine and explain
differences in county general purpose revenues. In order to have
a common base from which to review county revenues, this report
displays each county's revenues on a "per capita"
basis. That is, revenues from each source is divided by the
county's population of year-round residents. We chose this
approach because it helps illustrate the factors underlying the
allocation of revenues across counties of different size and
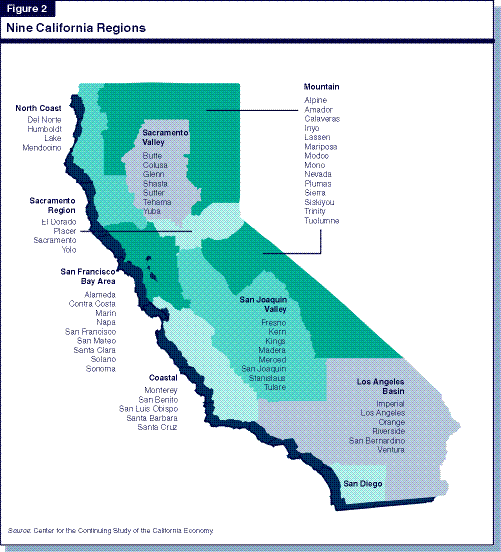
across economic regions. (For a description of the regions
referred to in this report, please see Figure 2.)
Notwithstanding the above, any county analysis undertaken on a
per capita basis has significant limitations. For example, as we
discuss in Figure 3:
For these reasons, readers are therefore cautioned not
to conclude that one county is "better off" than
another simply because it receives somewhat higher revenues. A
higher level of revenues may reflect only a county's additional
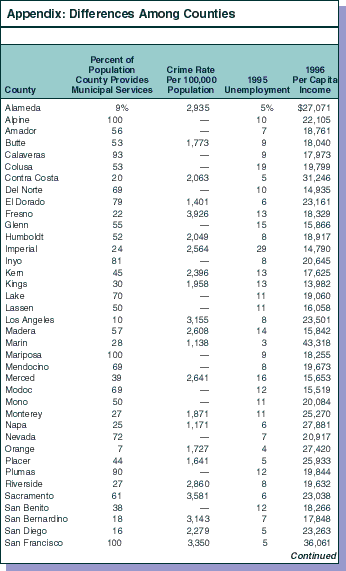
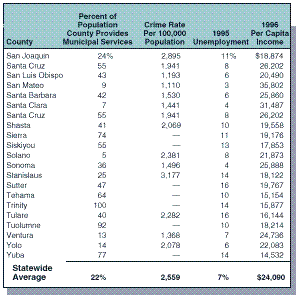
municipal or other program obligations. (The report's appendix
provides information about differences in county responsibilities
and populations.) Finally, we recommend readers review data for
counties with very small, often seasonal, populations (such as
Alpine, Sierra, and Mono Counties) and counties with unusually
large "daytime" populations (such as San Francisco)
separately from the rest of the counties. In these cases, an
analysis based on the number of year-round nighttime residents
(the basis for the per capita numbers) significantly understates
the population served.
Figure 3
|
Property taxes represent counties' largest source of general purpose revenues. In 1996-97, California landowners paid about $19 billion in property taxes. Counties--on average--received 20 percent of each tax bill, or about $106 per resident. As we discuss below, the amount of property tax revenues any county received varied considerably due to differences in the:
A county's property tax receipts depends, in part, on the taxable value of property in the county. Under Proposition 13, a landowner's base property tax bill is calculated by multiplying the property's "assessed value" by 1 percent. The property's assessed value is generally its purchase price, increased by up to 2 percent per year for inflation. Because the price of homes and businesses and the density of land developments vary throughout the state, each county's property tax base also varies.
Typically, counties where residents have incomes to support high home prices and where many businesses have located have the highest property tax bases. For example, Bay Area counties, have a property tax base of over $70,000 per resident. In addition, some small counties, such as those in the Mountain region, have high property tax bases because of the extent of the tourism business and second-home investments by nonresidents. San Joaquin Valley counties, in contrast, typically have relatively low home prices and are sparsely developed. These counties report a property tax base of less than $44,000 per resident.
County property tax receipts also vary due to differences in their property tax "share," or the percentage of a landowner's property tax bill that is allocated to the county, instead of the city, special districts, and schools serving the landowner's property. Statewide, the share of a county resident's property tax bill that is allocated to the county varies from less than 20 percent to more than 60 percent.
The history behind the assignment of county property tax shares is very complex, but stems from the Legislature's desire to allocate property taxes in a manner consistent with local choices prior to Proposition 13. Specifically, Proposition 13 transferred the authority to allocate property taxes from local government to the state. To implement this new responsibility, the Legislature developed a property tax allocation system (AB 8, Leroy Greene, Chapter 282, Statutes of 1979) that largely prorates property taxes among local governments within a county in a manner very similar to how property taxes were allocated before Proposition 13. That is, if a county or city got a very small share of countywide property taxes before Proposition 13, it tends to get a very small share today.
In order to provide some relief from the revenue losses caused by Proposition 13, the Legislature also transferred a portion of many school districts' shares of property taxes to cities, special districts, and counties (and offset any school funding losses with increased state school aid). The Legislature also reduced some county health and welfare programs responsibilities. The distribution of this Proposition 13 relief among local governments was done in a manner that reflected the amount of property taxes each local government lost as a result of Proposition 13. Furthermore, the property tax shift of the 1990s was also implemented in a manner that reflected this pre-Proposition 13 fiscal transaction. The net result of all of these changes is that the allocation of property taxes today is quite varied, and is based on decisions of a generation ago. (For a detailed history of these changes, please see our 1996 report: Property Taxes: Why Some Local Governments Get More than Others.)
The final major factor affecting county property tax revenues is redevelopment. When a city or county creates a redevelopment project area, the taxable value of property in the redevelopment area is treated differently for purposes of allocating property taxes among local governments. Specifically, the assessed value of the redevelopment area is frozen. Most increases in property taxes in the project area are allocated to the redevelopment agency, instead of the other local governments. California communities vary remarkably in the extent to which they use these redevelopment powers. In some rural counties, there are no redevelopment projects. Conversely, in some cities, vast tracts of land are included in a redevelopment project.
As can be seen in Figure 4, the
range in county per capita property tax receipts is very large.
This large range is evident among the state's 10 most populous
counties (shown in dark blue) and small and medium size counties.
Which of the three factors above best explains this variation?
Our review found that most of this variation reflects (in roughly
equal proportions): current property values and taxation
decisions of a generation ago. Variation in reliance upon
redevelopment explains a much smaller amount of the property tax
differences.
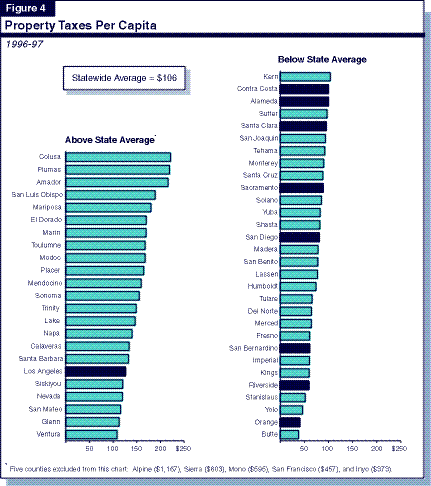
Mountain region counties receive about two-thirds more property taxes per capita than other counties in the state. In general, the high amount is because mountain counties (1) have the highest level of property values per year-round resident in the state, (2) continue to receive the large share of the property tax they received before Proposition 13, and (3) do not include many redevelopment project areas.
It is important to note that the Mountain region counties' large property tax share did not result from a higher tax rate before Proposition 13. Rather, the large share resulted from the fact that there were few cities and few children living year-round in the region in the 1970s, and accordingly, the city and school tax rates were unusually low. (In Alpine County, for example, the composite property tax rate charged by schools and all local governments was less than 1 percent, even before Proposition 13.) Overall, then, the Mountain region's high share today reflects their high share over 20 years ago.
Of all the urbanized regions in the state, Bay Area counties receive the highest level of per capita property taxes$149 per resident. In comparison, LA Basin counties average $98 per capita, the County of San Diego receives $81 per capita, and the Sacramento region averages $101 per capita. In general, the reason Bay Area counties get more property taxes per capita is due to the region's very high property values and somewhat lower use of redevelopment. Contrary to popular belief, the region's high property tax yields are not due to their pre-Proposition 13 share of the property tax. In fact, with the exception of San Francisco, each of the Bay Area counties had a pre-Proposition 13 share of the property tax that was lowerthan the state's average, often significantly so.
Cities in the County of Riverside have embarked on ambitious redevelopment projects. Virtually every city in the county operates a redevelopment agency, and the county is home to some of the state's largest redevelopment projects. As discussed earlier, when property values in a redevelopment project area grow (due to new construction or resale of property at higher prices), most of the increase in value goes to the redevelopment agency. In Riverside County, 20 percent of property taxes collected are allocated to redevelopment agencies, far over the state average of 8 percent. While redevelopment activities may promote growth in property values in the project area, a recent study by the Public Policy Institute of California found that counties and other local governments receive significantly lower property taxes when cities create redevelopment projects. That is, the County of Riverside is effectively subsidizing its cities' redevelopment efforts. This subsidy is part of the reason the county's property tax revenues are so low$59 per resident.
Although Orange County's property values exceed the state's average and its reliance upon redevelopment is moderate, the county receives the lowest amount of property taxes per capita of any urban county. Orange County's low property tax revenues ($40 per capita) reflect the continuing influence of taxation decisions of a generation ago.
Specifically, before
Proposition 13, Orange County had an unusually low county
tax rate, while its tax rates for schools, cities, and special
districts were about the state average. As a result, in 1977-78,
the County of Orange received 17 percent of all property
taxes collected in the countythe lowest share of any county in
the state. (Los Angeles, in contrast, received 35 percent,
and the statewide average was 30 percent.) In addition,
while AB 8 directed most county auditors to transfer a small
share of the school's property taxes to counties to help offset
their losses from Proposition 13, AB 8 directed the Orange
County auditor to transfer a small share of the county's property
taxes to the schools. This reduction to Orange County's
share (as well as to Butte and five other rural counties'
property tax shares) was done because the value to Orange County
of the state's assumption of certain health and welfare costs was
large, relative to its Proposition 13 losses, and the state's
objective was to provide the same level of overall
relief to all counties.
In addition to property taxes, counties receive almost a third of the revenues generated under the state's uniform 7.25 percent sales tax. Some of these county sales taxes must be spent for specific programs, and are not reviewed in this report. The rest of county sales tax revenues--equivalent to a tax rate of 1.5 percent--are available to counties for largely general purposes. We discuss these sales tax revenues below.
Bradley-Burns Sales Tax ($450 Million). Whenever a sale occurs in the unincorporatedarea of a county--or in a jurisdiction that is both a city and county (San Francisco) the county receives tax revenues equivalent to 1 percent of the sales price. Counties may use these funds for any purpose.
Proposition 172 Sales Tax ($1.6 Billion). Counties also receive tax revenues equal to 0.5 percent of all taxable sales occurring anywhere within their boundaries. Counties must redirect a small portion (less than 10 percent) of these revenues to cities, based on each city's net losses from the 1993-94 property tax shift. While state law requires counties (and cities) to spend these Proposition 172 sales taxes on public safety purposes, local governments were allowed to redirect to other purposes monies they previously spent on public safety programs. Local governments were required to increase public safety expenditures annually by the amount of growth in their Proposition 172 revenues. As a result, although Proposition 172 is referred to as the "public safety" sales tax, the predominate effect of enacting this tax in 1993 was to replace some of the discretionary revenues lost due to the property tax shift. It is for this reason we include Proposition 172 monies in our analysis of county general purpose revenues.
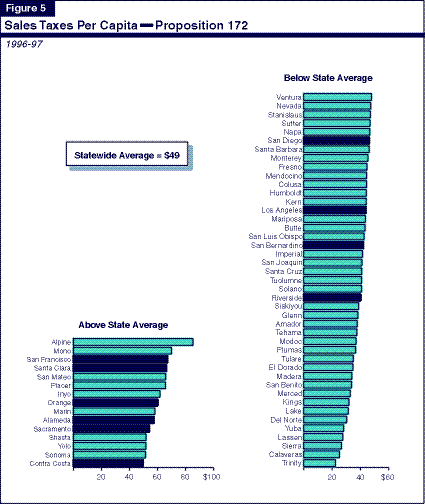
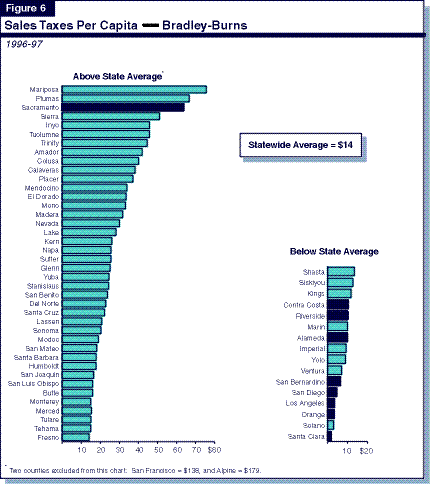
Figures 5 and 6, respectively, display each county's per capita revenues from the Proposition 172 and Bradley-Burns sales taxes. As we discuss below, the relative county ranking under these two sales taxes is often very different.
Generally, the counties with the greatest number of sales per resident occurring within their boundaries are those where:
In California, the counties that best fit this profile are those in the Bay Area, Orange County, and some counties in the Mountain and Sacramento regions.
As Figure 5 shows, Proposition 172 revenues follow this pattern. Specifically, Bay Area counties average $59 per capita, $10 above the statewide average. Residents of Los Angeles and San Diego Counties tend to have somewhat lower incomes; as a result, these counties receive $44 and $46, respectively. Counties receiving the lowest Proposition 172 revenues tend to be the counties where the lowest income Californians live, such as Trinity, Calaveras, Lassen, Yuba, and Del Norte.
The Bradley-Burns tax rate is twice that of Proposition 172, but counties only receive the revenue if the transaction occurs in their unincorporated area (or, in a city and county). As a result, county Bradley-Burns revenues vary widely. Like Proposition 172 revenues, a county tends to receive more per capita Bradley-Burns revenues if its residents are wealthy and there are many property developments. Unlike Proposition 172, however, the extent of city incorporation and the county's land use policies greatly affect its tax receipts.
Specifically, counties receive fewer Bradley-Burns revenues if:
As Figure 6 indicates, some of the
state's most urbanized counties receive the lowest per capita
Bradley-Burns taxes. In 1996-97, Los Angeles, Orange, Santa
Clara, and San Diego Counties, all received less than $5 per
capita. Sacramento, in contrast received $64. While Sacramento's
Bradley-Burns revenues are likely to decline in the future, given
the recent incorporation of Citrus Heights, the county is likely
to continue to receive a relatively high amount of Bradley-Burns
taxes, because more than half of the population still resides in
the unincorporated area.
Two lesser known county revenue sourcesvehicle license fees and trial court subventionscontribute as much to county general purpose revenues as do sales taxes.
Vehicle License Fees. Instead of taxing cars and other vehicles as personal property, the state created an in-lieu property tax for vehicles in 1935. This tax, collected by the state at the same time as vehicle registration fees, has been changed many times over the yearsmost recently in 1991 to raise money for "realignment" health and welfare programs. With the exception of the additional funds for realignment programs, all "base" vehicle licenses are allocated to cities and counties as general purpose revenues. (For detailed information regarding vehicle license fees, please see Part V of our 1998-99 Perspectives and Issues.)
Trial Courts. State subventions for trial court funding relieve county spending obligations for this program, and give counties discretion as to where to redirect their savings. As a result, these state subventions for trial courts are a significant source of county general purpose revenues. Last year, the Legislature and Governor acted to increase state trial court support and restructure county court funding obligations. The effect of these changes are not shown in the charts in this report (which reflect state subventions in 1996-97), but are discussed below.
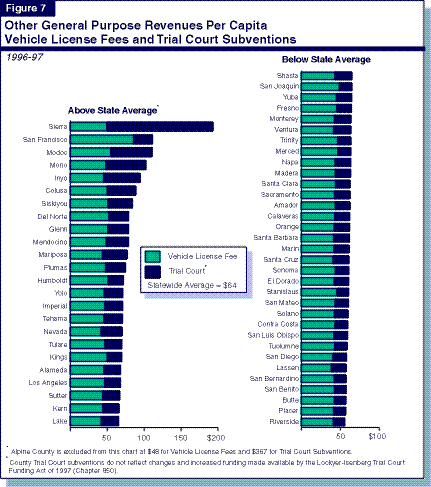
Figure 7 shows each county's revenues from vehicle license fees and trial court subventions. Compared with the counties' three major sources of general purpose revenues, there is much less variation in per capita county revenues from these sources.
Because most base vehicle license fees are allocated to counties on the basis of county population (instead of the amount of fees county residents pay), the distribution of these revenues is very even. The little variation shown in Figure 6 reflects (1) San Francisco's ability to collect vehicle license fees as a city and as a county, and (2) a state law that directs the Office of the State Controller to rely upon each county's highest population estimate by the Department of Financenot the most recent estimatewhen distributing vehicle license fee revenues. Several years ago, Department of Finance estimates had shown a greater number of people living in rural areas.
As shown in Figure 7, rural counties received the highest per capita level of trial court funding in 1996-97. The modest variation in support for the rest of the counties reflected: differing levels of court activity among counties, state perceptions of relative county fiscal health, and historical factors.
Under the 1997 trial court restructuring, the state assumed all court costs for the state's 20 least populated counties (generally Mountain region counties). In addition, the state pays all growthin trial court costs for the rest of the counties, while requiring each county to pay a certain percentage (from 20 percent to 49 percent) of its 1994-95 total court costs. Accordingly, over time, the extent of state relief for a county from trial court restructuring will reflect:
Given the formula's structure, the counties most likely to benefit from these changes are rural counties and fast-growing counties.
Figure 8 presents each county's total
per capita revenues from the five major sources of county general
purpose revenues. The distribution of revenues is wide, even
within regions. For example, Butte County receives $154, while
adjacent Colusa and Plumas Counties receive nearly $400. In
addition, Los Angeles County receives somewhat above average
revenues, while Riverside, Orange, and San Bernardino Counties
receive among the state's lowest.
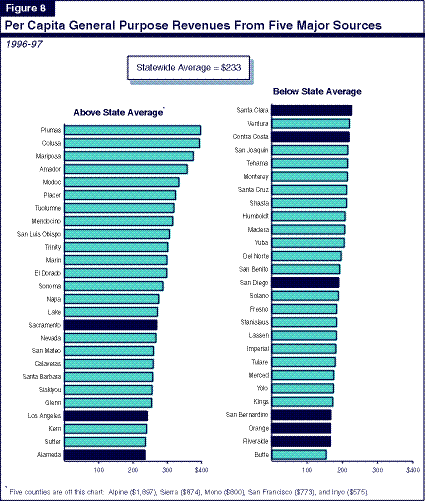
As we discussed earlier in this report, counties' municipal and other program responsibilities differ markedly. In reviewing Figure 8, therefore, we suggest that readers compare only those counties known to have similar responsibilities because differences in program responsibilities may fully offset apparent revenue differences. For example, Figure 8 shows that Sacramento County receives higher general purpose revenues than San Mateo County. Because Sacramento County has many more people living in its unincorporated areas, and has a higher poverty and crime rate, Sacramento probably has less revenue flexibility than San Mateo. For similar reasons, Kern County probably has less revenue flexibility than Santa Clara County. Finally, as discussed earlier, because of the size of their seasonal and daytime populations, we suggest reviewing data for very sparsely populated resort-oriented counties and San Francisco separately than other counties.
Viewed as a group, three factors--summarized in Figure 9--explain most of the variation in revenues among counties.
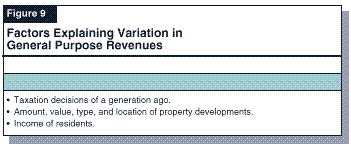
First, taxation decisions of a generation ago continue to be a dominant influence on the level of county revenues today. For example, differences in their 1970's property tax shares appear to be the most important factor explaining the differences in revenues for Los Angeles, Orange, and San Diego Counties, and for Butte and adjacent Colusa Counties.
Second, the amount, value, type, and location of property developments affect county revenues. Specifically, counties tend to receive more general purpose revenues if they have many high value property developmentsparticularly retail developmentsin their unincorporated areas.
Third, counties with higher-income residents receive more
revenues. This relationship is the natural outgrowth of counties'
reliance upon a local tax structure that is heavily influenced by
the wealth of its residents. We would note, however, that for
most counties, program costs appear to be inversely
related with wealth. That is, counties spend much of their
general purpose revenues on programs related to criminal justice
and poverty, and the demand for these programs tends to be lower
among wealthier counties.
The preceding figures illustrate wide variation in county per capita revenues. Some commentators have pointed to this type of variation as evidence of a problem in county finance. This view implicitly assumes that every county should have the same access to revenues, despite differences in service obligations and local preferences.
In our view, the evidence of revenue variation is less important than the purpose and cause of the variation, and the overall characteristics of the county finance system. That is, if the finance system were comprehensible to local residents, and responsive to local preferences as well as state needs, variation in county general purpose revenues might be appropriate. The finance system however, fails in these respects. Specifically, as we have discussed in this and many previous reports, we find that the state's system of county finance is:
In short, because the revenue variations shown in the preceding figures cannot be explained by differences in current local preferences, program needs, or the rate of local taxation, we believe the Legislature should be concerned by these differences in resources. Some counties have much less ability to provide services to their residents, and we find little policy justification for this difference.
Because the California Constitution establishes counties as "agents of the state" and the state controls most county revenues, the Legislature has considerable authority to modify county finances and program responsibilities. Over the years, however, the Legislature has found that translating this authority into practical and significant improvements to county programs and financial affairs has proven to be exceedingly difficult.
In short, because of the shared nature of county revenues, most changes to county revenues also involve changes to school, city, special district, and/or redevelopment finances. Modifying any county's finances could potentially "disadvantage" some jurisdiction unless additional revenues are made available to local government.
Largely because of the vast fiscal and program interconnections among California's local governments, reorienting the county's system of finance has often appeared to be "too large" of a problem to be cured. Hence, most of the Legislature's attempts to ameliorate the negative impacts of the state's system of county finance have focused on modestly modifying county program responsibilities or funding. For example, the Legislature acted in recent years to reduce county costs for trial courts, transfer responsibility and funding for mental health programs to counties, and allow counties to reduce their general assistance program costs. The Legislature has also acted to allow counties to shift some costs to cities, by charging cities property tax administration fees and "booking" fees to incarcerate people arrested by city police officers.
While these changes have alleviated some fiscal pressures on
counties, they have not made the county finance system more
understandable, or responsive to local and state objectives. In
addition, the cost shifts to cities have aggravated the strained
relationships among California's local governments. Ultimately,
therefore, we believe the Legislature will need to broadly
reexamine county government responsibilities and finance.
Implementing changes in these areas will be difficult, as they
will require complex trade-offs between multiple policy
objectives and interests.
| Acknowledgments This report was prepared by Marianne O'Malley with the assistance of Michael Cohen, under the supervision of Mac Taylor. The Legislative Analyst's Office (LAO) is a nonpartisan office which provides fiscal and policy information and advice to the Legislature. | LAO Publications
To request publications call (916) 445-2375. |