
The revenues that finance California's state General Fund budget come from a number of different sources, including various taxes, fees, licenses, earnings on investments, loan repayments, and transfers from other funds. Of these, taxes are by far the most significant, typically accounting for over 90 percent of all revenues. This chapter summarizes our projections for General Fund revenues over the forecast period.
California's revenue outlook has deteriorated substantially since the 2001-02 budget was enacted last summer. The budget had already assumed that revenues in 2001-02 would fall by about 3.7 percent from last year's level, reflecting a slowdown in economic activity, and a decline in stock options and capital gains. Since the time of the budget's enactment, however, the economy and stock market have deteriorated more sharply than anticipated, and state revenue receipts have consequently fallen well short of earlier expectations.
Total cash receipts between May and
September were down about $1 billion from the
2001-02 Budget Act forecast, reflecting across-the-board
softness in all major revenue sources. What is
particularly disturbing is that most of the weakness so far
has been related to economic activity prior
to September 11, and thus, does not reflect the full effects
of the slowdown in sales and income that occurred
following the terrorist attacks.
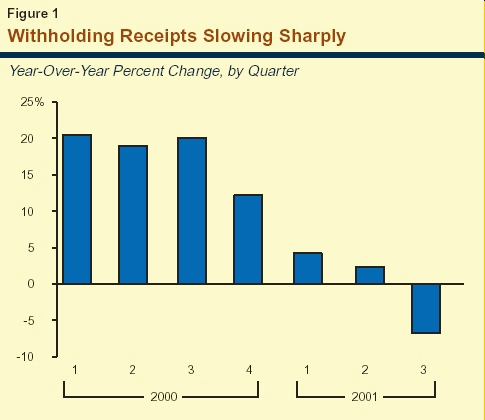
A key indicator of the revenue slowdown is the slide in personal income tax (PIT) withholding.
The month-to-month performance of revenues from
this source is a very significant indicator of emerging
fiscal trends, since the PIT is the state's largest
revenue source and monthly PIT receipts reflect
current trends in jobs, wages, and stock-option income.
As shown in Figure 1 (see page 16),
year-over-year growth in this key indicator was running
above 20 percent during the peak of California's
economic boom in early 2000, but had slid to a
minus 6 percent as of the third quarter of this year. Other
state tax receipts—including sales taxes as well as
quarterly income tax prepayments from individuals
and corporations—also have exhibited a similar
adverse pattern—booming in 2000 but sharply
weakening throughout 2001.

Reflecting the recent extremely negative revenue developments and our projected downturn for the state's economy, our updated forecast foresees a dramatic revenue deterioration in the near term. Moreover, although revenues will begin recovering once the economic recovery starts, we do not expect revenues to climb back to their 2000-01 level until 2003-04. Our revenue forecast, presented in Figure 2, is as follows:
|
Figure 2 The LAO’s General Fund Revenue Forecast |
|||||||
|
(Dollars in Millions) |
|||||||
|
Revenue Source |
2000-01 |
2001-02 |
2002-03 |
2003-04 |
2004-05 |
2005-06 |
2006-07 |
|
Personal income tax |
$44,776 |
$36,660 |
$41,740 |
$46,530 |
$50,890 |
$55,150 |
$59,480 |
|
Sales and use tax |
21,292 |
21,180 |
23,120 |
24,980 |
26,600 |
28,300 |
30,100 |
|
Bank and corporation tax |
6,443 |
5,220 |
5,900 |
6,690 |
7,160 |
7,640 |
8,140 |
|
Other revenues and transfers |
5,173 |
5,263 |
3,867 |
3,767 |
3,565 |
3,536 |
3,710 |
|
Total revenues and |
$77,684 |
$68,323 |
$74,627 |
$81,967 |
$88,215 |
$94,626 |
$101,430 |
|
Percent change |
8.0% |
-12.1% |
9.2% |
9.8% |
7.6% |
7.3% |
7.2% |
Our forecast reflects the fiscal effects of
revenue-related measures that were enacted both in
conjunction with the 2001-02 budget and during the
summer. These measures included an agricultural
and rural tax assistance tax package that exempted
from the SUT purchases of farm and forestry
equipment, diesel fuel used in farming and food processing,
and certain purchases of liquefied petroleum gas.
Taken together, these exemptions will reduce General
Fund revenues by approximately $40 million
annually beginning in 2001-02. Our estimates also
incorporate the fiscal effects of legislation signed
following adoption of the budget. These measures include
SB 17xx, which provides a credit for the
installation of solar systems for the production of electricity.
The measure will reduce combined PIT and BCT revenues by $20 million in 2001-02 and $35 million
in 2002-03. As discussed below, our forecast
assumes that the one-quarter cent SUT trigger reduction
will be in effect for 2001, but not thereafter.
After steadily increasing from $16.3 billion
in 1994-95 to $44.8 billion in 2000-01, we estimate
that PIT revenues will decline to $36.7 billion in
2001-02—a drop of over 18 percent. This
current-year decline is, by far, the steepest in the past
three decades. We expect that PIT revenues will
partially rebound to $41.7 billion in 2002-03. Over the longer term,
we project that PIT receipts will increase at an average annual rate
of 9.3 percent from 2003-04 through 2006-07, reaching $59.5 billion
by the end of the forecast period.
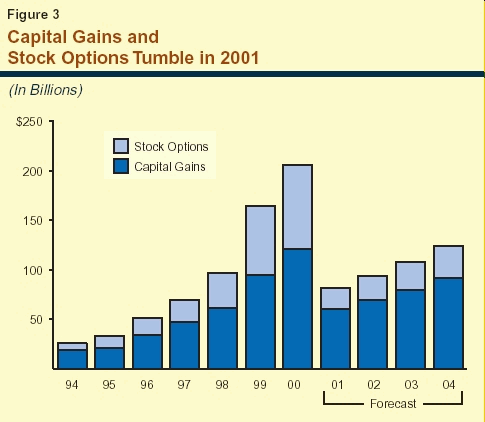
The single largest factor
behind the drop in PIT receipts in the current year is the dramatic decline
in capital gains and stock options. As shown in Figure 3, income related
to these sources soared from $25 billion in 1994 to over $200 billion in
2000. At their peak, these sources accounted for over $17 billion in
PIT revenues in 2000-01, which was over 22 percent of total General Fund
revenues during that year.
Based on recent stock market and revenue
trends, however, it appears that capital gains and stock
options have plummeted in 2001. We are currently
assuming that the decline will be about 60 percent
this year, with revenues attributable to these
sources dropping to about $7 billion in 2001-02.
Why the Sharp Decline? The sharp drop in
stock options and capital gains is related to the
general drop in stock market valuations over the past
year, and in particular, the dramatic drop in share
values of California's high-tech companies (which
have accounted for the majority of stock-option
income in recent years). As shown in Figure 4, the
stock prices of some of the largest of these companies
currently are down by over 75 percent from their
early 2000 peaks, and in many cases, options granted
in recent years are "under water." This means that
their current value is less than when they were
granted, and thus, there is currently no income
associated with them to tax.
Share
Prices of Selected Company
Per-Share
Stock Price
Percentage March
2000
October
2001
Cisco Systems
$77
$17
-78%
Intel
Corporation
66
24
-64
Sun
Microsystems
47
10
-79
Oracle
Corporation
44
14
-68
Hewlett
Packard Company
78
17
-78
Qualcomm
Incorporated
149
49
-67
A second factor behind the decline is that a
larger-than-normal proportion of stocks were sold in
2000, as investors and employees attempted to "lock
in" gains that had accrued in previous years. This
increased taxable income associated with capital
gains and stock options in 2000, but also reduced
dollar-for-dollar the amount of "stored up" gains
potentially available for realization in 2001 and beyond.
Major California Technology Companies
Decline
One of the key factors affecting the state's long-term revenue outlook is what the strength and timing of the recovery in stock market-related income will be. We forecast that stock prices will partially rebound beginning in 2002, leading to projected 15 percent increases in capital gains and options in both 2002 and 2003. Even with these increases, however, revenues from gains and options are expected to remain well below their 2000-01 peak through the forecast period.
Following an increase of 11.5 percent in 1999-00, General Fund revenues from this source remained flat in 2000-01 and are expected to decline slightly in 2001-02. We project that revenues will rebound by 9.2 percent in 2002-03, increasing to $23.1 billion during the year. Over the longer term, we project that sales tax receipts will increase at an average annual rate of 6.8 percent from 2003-04 to 2006-07, reaching $30.1 billion by the final year of the forecast.
Both policy- and economics-related factors
are involved in our SUT projections through 2006-07.
Policy-Related Factors. Three key factors are
involved here:
Economic Factors. Both consumer and business spending have been soft since the beginning of 2001. This reflects several factors, including the general economic slowdown, sharp declines in business spending on capital goods, the loss of stock market-related wealth and income, and the adverse effects of higher rents and energy prices on household budgets.
Due to these factors, total taxable sales growth slowed from 10.9 percent in 2000, to a marginal 1.5 percent during the first half of 2001. Recent monthly data suggest that the softness continued in the third quarter of the year, partly due to the negative effects of the September 11 terrorists attacks on consumer and business spending.
Looking ahead, we project that taxable sales will continue to slide in the fourth quarter, before stabilizing in early 2002, and then turning upward beginning next spring. On an average annual basis, we forecast that taxable sales will decline by 2 percent in 2001, before rebounding by 3.9 percent in 2002 and 7.9 percent in 2003. Over the longer term, we project that taxable sales will increase slightly more slowly than state personal income, averaging 6.5 percent annually over the final three years of the forecast period. Sales and use tax revenues will follow this general pattern.
We estimate that BCT revenues will fall
sharply from $6.4 billion in 2000-01 to $5.2 billion in
2001-02, before partly rebounding to $5.9 billion
in 2002-03. Over the longer term, we project that
revenues from this source will increase at an
average annual rate of 8.4 percent from 2003-04
through 2006-07, reaching $8.1 billion by the end of the
forecast period.
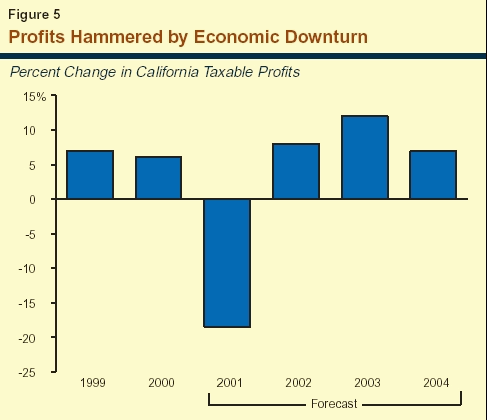
The current economic downturn is having a
dramatic adverse impact on corporate profits. Based
on BCT prepayments through September, we estimate that California taxable profits are down by
over 18 percent in 2001 relative to the prior year (see
Figure 5). Company earnings reports suggest that
profits throughout the nation are being squeezed by
idle capacity, sluggish sales in both in the U.S. and
abroad, falling product prices, heavy debt loads, and
high costs for employee health care. The slump in
information technology (IT)-related spending is
having a particularly negative effect on California's
economy and profits. This is because, as noted previously,
California accounts for roughly 20 percent of
the nation's IT industry.
Looking beyond 2001, we expect that corporate profits will slowly recover beginning next year,
accelerate in 2003, and continue to expand at a
moderate pace through the balance of the forecast period.

We forecast that revenues and transfers from the General Fund's remaining sources of income will be about $5.3 billion in the current year, or roughly the same level as in 2000-01. We then expect receipts from these sources to fall to about $3.9 billion in 2002-03, and remain in the range of from $3.5 billion to $3.8 billion in the subsequent four years.
Current-year revenues in the "other" category are being affected by a variety of offsetting factors, including the diversion of tobacco settlement receipts to special funds, and an increase in one-time transfers—a minus $16 million in 2000-01 to over $1 billion this year. Similarly, the revenue decline between the current year and the budget year is related to the assumed reduction in one-time transfers to $100 million. Over the balance of the forecast period, we assume that revenues from most nonmajor tax sources will increase at a moderate rate. The one key exception involves the estate tax. Revenues from this source will decline from $1.1 billion in the current year to near zero by 2005-06, due to federal law changes enacted last spring that will result in the phase-out of California's estate tax over the next four years.
Capital Gains and Stock OptionsThe dramatic decline in capital gains and stock options is the single most significant factor in the unprecedented drop in General Fund revenues estimated for 2001-02. What Are Gains and Options?Capital gains are a form of income recognized on PIT and BCT tax returns that arises from the
sale of assets that have increased in value over time. We estimate that roughly two-thirds of total
capital gains in California are related to company stocks, with the remainder related to transactions
involving bonds, real estate, and other physical assets.
In contrast, employee stock options are legal contracts entitling an employee to purchase a
fixed number of shares of the employer's stock at a predetermined price (usually the market price on the
day the option is granted) for a specified period of time (usually ten years). Example of How an Option WorksAs a simple illustration of how a stock option works, assume that in a given year, an option is granted to an employee to purchase 1,000 shares of the company's stock at its then-market price of $10 per share. Assume further that after a three or four year "vesting period" (that is, a predetermined time period between when the option is granted and when the employee is first eligible to actually exercise the option and purchase the stock), the market price of the company's stock has increased to $30 per share. The tax treatment of this option will depend on whether it is a "nonqualified" or "qualified" option.
|
Return to California's Fiscal Outlook Table of Contents