California's Economy and
Budget in Perspective
|
California's Economy and |
2002 Cal FactsState Budget |
|
|
Number
of |
Average
Cost |
|
|
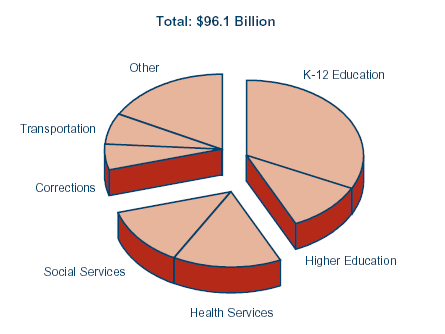
General |
Total |
||
|
Corrections |
|||
|
Prison |
157 |
$26,700 |
$26,700 |
|
Youth Authority |
6 |
49,200 |
49,200 |
|
Education�Studentsa |
|||
|
K-12 |
5,881 |
$5,232 |
$8,568 |
|
UC |
185 |
17,392 |
17,392 |
|
CSU |
317 |
8,488 |
8,488 |
|
Community Colleges |
1,094 |
2,536 |
4,376 |
|
Health and Social Services�Beneficiaries |
|||
|
Medi-Cal |
6,009 |
$1,589 |
$3,178 |
|
Healthy Familiesb |
603 |
414 |
1,069 |
|
CalWORKs |
1,438 |
1,440 |
4,099 |
|
SSI/SSP |
1,126 |
2,715 |
6,785 |
|
Foster Care |
73 |
5,781 |
21,219 |
|
Developmental centers |
4 |
93,606 |
171,430 |
|
Regional centers |
182 |
7,972 |
12,045 |
|
a Does not include federal funds or lottery funds. K-12 participants are in average daily attendance and higher education are in full-time equivalents. |
|||
|
b Includes tobacco settlement funds. |
|||
|
|
|||