![]()
This report provides our projections of General Fund revenues and
expenditures for 2002-03 through 2007-08 It includes our independent
assessment of the outlook for California's economy, demographics,
revenues, and expenditures.
Chapter 1 contains our principal findings and conclusions. Chapter 2
presents our economic and demographic projections, Chapter 3 our
revenue forecasts, and Chapter 4 our expenditure projections.
Our fiscal projections reflect current-law spending requirements and tax
provisions. They are not predictions of future policy decisions by the Legislature, nor
are they our recommendations as to what spending and revenue levels should be.
This report, in its eighth year of publication, reflects the historical mission
of the Legislative Analyst's Office to assist the Legislature with its fiscal planning
by assessing the revenues and expenditures of the state. The report is part of
an ongoing series and is updated periodically.
Chapter 1: The Budget Outlook
Chapter 2: Economic and Demographic Projections
Chapter 3: Revenue Projections
Chapter 4: Expenditure Projections
California policymakers will be facing an enormous challenge in crafting the 2003-04 General Fund budget. For the second year in a row, the state faces a budget problem in excess of $20 billion. Specifically, our updated forecast indicates the following:
Given that the General Fund budget enacted for 2002-03 only a few months ago was balanced with a $1 billion reserve, a natural question to ask is: How could such an enormous problem for 2003-04 develop so fast? As discussed below, two main factors are responsible:
About one-half of the projected 2003-04
budget problem relates to an underlying operating shortfall in California's
General Fund budget that would have existed even
without the recent deterioration in the economic
and revenue outlook.
Stock Market Collapse a Key Factor.
As we have indicated in previous reports, the state has faced
a large and ongoing imbalance between revenues and expenditures since the stock market bubble
burst and tax revenues fell by over $10 billion in 2001-02. The dramatic impact of the stock market decline is depicted in Figure 1, which shows
the amount of personal income taxes attributable
to stock options and capital gains. It indicates
that these tax revenues peaked at $17 billion in
2000-01, but fell abruptly following the stock market
decline—to under $6 billion in 2001-02. This
unprecedented 66 percent decline is the key factor
behind the $10-plus billion annual mismatch between
revenues and expenditures that began in 2001-02.
One-Time Solutions Provided Only
Temporary Relief. In dealing with the cumulative
$23.6 billion budget shortfall facing the state in 2002-03, the
Governor and Legislature relied primarily on
one-time actions to close the gap. While these actions
addressed the cumulative shortfall in the 2002-03 budget itself, they did not eliminate the
underlying current-law gap between revenues and
expenditures. Thus, the expenditure-revenue
mismatch was destined to reappear. Consequently, even if
all of the assumptions embedded in the 2002-03
budget had held up, the state would have still faced
an operating shortfall of over $10 billion in 2003-04.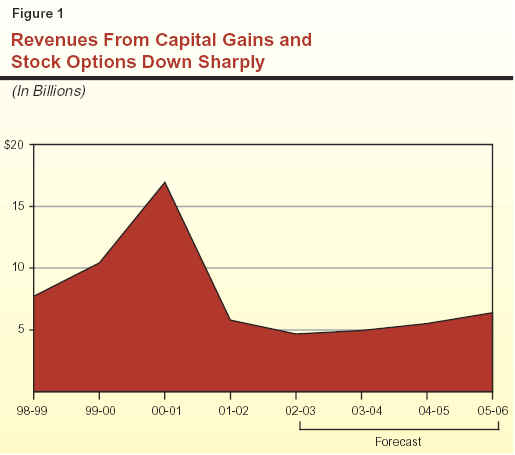
The other roughly half of the projected
$21 billion cumulative shortfall in 2003-04 largely
relates to the recent deterioration in the revenue
outlook resulting from near-stagnant economic
conditions in past months. This factor has caused us to
reduce our General Fund revenue forecasts relative to
our earlier projections by $777 million in
2001-02, $4.1 billion in 2002-03, and $6.5 billion for 2003-04—or a total of $11.4 billion for the
three years combined.
Our updated estimate of the 2003-04 shortfall also includes the impacts of revised
assumptions about new federal funds, retirement
incentives, Medi-Cal fraud detection, and state operations
reductions—as well as savings related to lower
Proposition 98 spending in 2003-04. On balance,
these expenditure revisions have worsened the
budget's bottom-line condition, although not to the
same extent as have revenues.
Recent Trends Have Been Weak. Although the national and state economic downturns appear
to have bottomed out in late 2001, the economic expansion has been extremely sluggish in 2002.
At the national level, consumer spending has
increased over the past year, but business spending and
net exports have been soft. These trends have also
been evident in California, where growth has been
extremely limited in recent months.
Modest Growth Expected. Our updated
forecast assumes that the national and state economies
will continue to expand at subdued rates until
mid-2003, when improvements in business spending and
export sales start to boost overall economic
growth. Specifically, we forecast that U.S. gross
domestic product will increase by about 2.5 percent this
year and 2.6 percent in 2003, before accelerating to
annual growth rates in the 3 percent to 4 percent
range in subsequent years. In California, we forecast
that, following a marginal gain of 1.2 percent in
2002, personal income growth will accelerate to
4 percent in 2003, slightly over 6 percent in 2004, and
to between 6 percent and 7 percent in subsequent years.
Downside Risks Exist. Our forecast is subject
to a significant downside risk that further delays
in business hiring and spending, coupled with sagging consumer confidence and spending, will
depress U.S. and California economic growth below
our current forecast. Another risk involves the
resolution of the current labor-management dispute
involving workers at West Coast ports. A protracted
economic slowdown could reduce state General Fund
revenues by several billions of dollars below our baseline
forecast in the current and budget years combined.
We currently forecast that revenues will
grow from $73.1 billion in 2001-02 to $75 billion
in 2002-03, before declining to $70.2 billion in Revenue Revisions. As indicated above, our
revenue forecast is down from the 2002-03 Budget
Act estimates by $777 million in 2001-02 and
by $4.1 billion in 2002-03. In addition, our
estimates for 2003-04 and beyond are below our
previous estimates by about $6 billion annually. These
substantial downward revisions are primarily
associated with the personal income tax. Collections
from this source are being adversely affected by (1)
the continued reductions of jobs and income in
high-paying manufacturing and software industries,
and (2) continued declines in stock market values,
which will result in reduced levels of taxable income
from stock options and capital gains. To a lesser
degree, sluggish economic growth is also depressing
collections from the sales tax and corporation tax.
2003-04. These totals are affected by a variety
of special factors, which are discussed in
Chapter 3. Absent these factors,
underlying revenues fell by about 16 percent in 2001-02, and are expected
to decline another 1 percent in 2002-03 before
growing about 5.6 percent in 2003-04. Over the
longer term, revenue growth is forecast to average
roughly 7 percent per year.
Figure 2 presents our updated General Fund condition projections for 2001-02 through 2003-04. These estimates take into account our revised projections of current-law revenues and expenditures, discussed in Chapter 3 and Chapter 4, respectively.
|
Figure 2 LAO Projections of General
Fund Condition |
||||||
|
2001-02 Through 2003-04 |
||||||
|
|
|
Forecast |
||||
|
2001-02 |
2002-03 |
2003-04 |
||||
|
Prior-year fund balance |
$2,627 |
-$1,192 |
-$4,635 |
|||
|
Revenues and transfers |
73,121 |
75,010 |
70,199 |
|||
|
Total
resources available |
$75,748 |
$73,818 |
$65,564 |
|||
|
Expenditures |
76,940 |
78,453 |
85,216 |
|||
|
Ending Fund Balance |
-$1,192 |
-$4,635 |
-$19,652 |
|||
|
Encumbrances |
1,473 |
1,473 |
1,473 |
|||
|
Reserve |
-$2,665 |
-$6,108 |
-$21,125 |
|||
Deficit to Exceed $6 Billion. The 2002-03 budget enacted in September assumed that the current fiscal year would end with a positive reserve of $1 billion. However, we estimate that the large combined $4.9 billion reduction in 2001-02 and 2002-03 revenues, coupled with $1.8 billion in added expenditures and a $410 million deterioration in the 2001-02 carry-in balance, will use up the reserve and push the state into a deficit of $6.1 billion in the current year. As discussed above, the decline in revenues reflects the deterioration in the near-term economic outlook. The increase in expenditures is due to our revised estimates related to new federal funds, the state retirement incentive program, state operations reductions, and Medi-Cal fraud detection.
Current Law Assumed. Our revenue and expenditure forecasts for 2003-04 and beyond are
based primarily on the requirements of current law.
For example, we have adjusted the current-year
spending plan for constitutional and statutory
funding requirements (such as the Proposition 98
minimum funding guarantee for K-14 education), as well as for projected changes in caseloads,
cost-of-living adjustments (COLAs), federal
reimbursements, and other factors affecting program
costs. We have also adjusted the budget for
one-time costs and savings in the current year.
Projections, Not Predictions. It is important
to note that our fiscal projections are not
predictions of what the Legislature and Governor will adopt
as policies and funding levels in future budgets. Rather, our estimates are intended to be a
reasonable "baseline" projection of what would
happen if current-law policies were allowed to operate
in the future. In this regard, we believe that our
forecast provides a meaningful starting point for
legislative deliberations involving the state's budget.
Treatment of Loan Repayments and
Mandates. In preparing our estimates for 2003-04 and
beyond, we needed to make assumptions about
repayments of loans to the General Fund from special funds,
as well as state payments to localities associated
with mandates which were deferred in 2002-03. With regard to loan repayments, our estimates
include the timely repayment of all loans which had
specific repayment dates scheduled in the budget.
We also assume that about one-half of the
remaining loans are repaid evenly over the forecast
period. With regard to state-imposed local mandates
(excluding education), we assume that prior-year claims will be paid off over the forecast period.
Key Elements. As shown in Figure 2, we
estimate that revenues will fall from $75 billion in $21 Billion Imbalance
Projected. The combination of the expenditure increases and revenue
reduction in 2003-04 will result in an operating
deficit of nearly $15 billion in the budget year. Thus,
when combined with the $6.1 billion deficit carry-in
from 2002-03, the 2003-04 budget faces a cumulative
shortfall of roughly $21 billion, absent corrective actions.
2002-03 to $70.2 billion in 2003-04. The
decline reflects the large amount of one-time
revenues, loans, and transfers that total $9.5 billion in
2002-03, but which are largely absent in 2003-04. At
the same time, expenditures are projected to
increase from $78.5 billion in the current year to
$85.2 billion in 2003-04. The increase reflects a variety
of factors, including new General Fund costs
associated with health programs previously funded
from the tobacco settlement special fund, the
annualized costs of COLAs provided for the Supplemental
Security Income/State Supplementary Program in
June 2003, $1.2 billion in added funding for
transportation spending (as mandated by Proposition 42), and
additional costs for employer retirement
contributions. General Fund Proposition 98 funding is
projected to grow by only 2.4 percent in 2003-04,
due to (1) a relatively small increase in the
minimum funding guarantee and (2) a rapid increase in
local property taxes, which reduces the General Fund
share of total Proposition 98 funding.
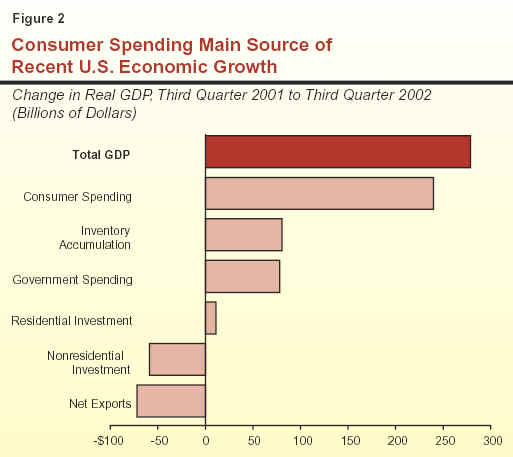
Figure 3 presents our revenue and expenditure forecasts through 2007-08. It indicates that current-law operating deficits are expected to persist over the entire period, absent corrective actions.
On the positive side, we do expect revenues to grow somewhat more rapidly than
expenditures over these years, as evidenced in Figure 3 by
the revenue line closing in a bit on the expenditure
line over time. Our projected faster growth for
revenues than for expenditures reflects our assumption
that revenue growth will accelerate in 2004-05 as the
economic expansion gains momentum. It also reflects relatively
slow growth in General Fund Proposition 98
spending, due primarily to slowing growth in K-12 school
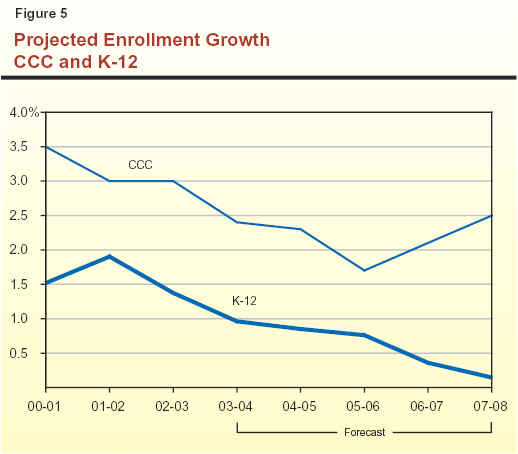
enrollments. As a result of the above factors, our
projected operating deficits do decline slightly over time.
Despite these favorable trends, however,
projected revenues remain well below expenditures at
all times over the forecast period. Specifically, as
the figure indicates, we expect that annual operating
deficits peak at $15.6 billion in 2004-05 before slowly
declining to $12.3 billion by 2007-08. The
persistence of these large mismatches between current-law
revenues and expenditures indicates that the state
has a large structural budgetary imbalance that it
cannot simply "grow" its way out of on the natural. As
a result, substantial budget-balancing actions will
be needed.
Last year, when the state faced a cumulative $23.6 billion budget problem, we identified for the Legislature a variety of principles, strategies, and tools for dealing with the shortfall (see, for example, our report entitled Addressing the State's Fiscal Problem, December 2002). The current budget shortfall is much more formidable and challenging than last year's. This is due both to the magnitude of the problem and because a number of the one-time solutions heavily relied on last year cannot be used again—such as the $4.5 billion raised from tobacco securitization, the $1.1 billion near-term savings from restructuring repayments of state general obligation bonds, and certain loans and tax accelerations. Given this, there is really no easy way out of the current predicament, and this makes it all the more important that the Legislature take advantage of the alternative budget-balancing approaches and options available to it.
Figure 4 summarizes in broad terms the various key budget-balancing principles, strategies, and tools that we have previously identified and that we believe merit the Legislature's attention again this year.
|
Figure 4 Basic Budget-Balancing
Principles, Strategies, and Tools |
|
Key Principles |
|
�
Wide range of budget solutions should be considered. |
|
�
Out-year repercussions should be assessed. |
|
�
Budget solutions should �make sense.� |
|
�
Current-year solutions should play a key role. |
|
Basic Strategies |
|
�
Determine the relative roles of spending and revenue
options. |
|
�
Identify the appropriate contributions of different
program areas. |
|
�
Establish the desired mix of one-time versus ongoing
solutions. |
|
�
Assess whether a multiyear solution is appropriate and
feasible. |
|
Individual Tools |
|
�
Spending-related options. |
|
�
Eliminate or modify programs. |
|
�
Suspend/reduce COLAs. |
|
�
Defer spending. |
|
�
Shift funding from the General Fund. |
|
�
Implement improvements and efficiencies. |
|
�
Revert or disencumber funds. |
|
�
Revenue-related options. |
|
�
Eliminate or modify tax expenditures. |
|
�
Broaden basic tax bases. |
|
�
Raise tax rates. |
|
�
Transfer special fund balances. |
|
�
Improve tax compliance and collections. |
|
�
Revise accrual procedures and sell assets. |
Of particular importance are:
I
n the coming months, our office will be assisting the Legislature in developing possible budgetbalancing expenditure and revenue strategies and options to help address the large projected 2003-04 shortfall.Economic and demographic developments in California have important effects on the state's fiscal condition through their impacts on both tax revenues and state expenditures. This chapter presents our economic and demographic projections for 2002 through 2008, which will affect California's fiscal condition during fiscal years 2002-03 through 2007-08.
California's economy has been hard hit by
the slump in spending on high-tech goods and services, plunging exports, and the stock
market's decline. These factors have combined to
produce soft personal income growth in the state, and
they continue to dampen economic performance as of late 2002. Looking ahead, we forecast that
the economy will continue to "muddle along"
until the second half of 2003, when a long-delayed improvement in business investment spending
is anticipated to begin to boost California's
overall job and income growth. From then on,
moderate income and job gains are expected through
the remainder of the forecast period.
Although our forecast reflects what we believe is the most likely future path for the economy,
our forecast—like any—is subject to risks
and uncertainties. In this regard, we believe that
the main risk to our forecast is on the downside—namely, our economic projections are subject
to the possibility that further declines in
consumer confidence and spending could occur that, in
turn, could result in prolonged economic weakness during the next year. In this event, both
the economy and the state's fiscal condition would under-perform our expectations.
Figure 1 summarizes the details of our economic forecast, while the current
state of the economy and the major components of
our economic forecast are discussed below.
|
Figure 1 The LAO�s Economic
Forecast |
|||||||
|
Percentage Change (Unless Otherwise Indicated) |
|||||||
|
|
2002 |
2003 |
2004 |
2005 |
2006 |
2007 |
2008 |
|
United States |
|
|
|
|
|
|
|
|
Real
gross domestic product |
2.5% |
2.6% |
3.8% |
3.6% |
2.9% |
3.0% |
3.0% |
|
Personal
income |
3.2 |
4.5 |
5.9 |
6.1 |
5.7 |
5.4 |
5.4 |
|
Wage
and salary jobs |
-0.8 |
1.2 |
2.5 |
1.7 |
1.1 |
1.2 |
1.1 |
|
Consumer
Price Index |
1.7 |
2.9 |
2.9 |
2.9 |
2.6 |
2.4 |
2.3 |
|
Unemployment
rate (%) |
5.8 |
5.9 |
5.3 |
5.0 |
5.1 |
5.1 |
4.8 |
|
Housing
starts (000) |
1,637 |
1,572 |
1,711 |
1,704 |
1,669 |
1,698 |
1,730 |
|
California |
|
|
|
|
|
|
|
|
Personal
income |
1.2% |
4.0% |
6.1% |
6.7% |
7.0% |
6.5% |
6.4% |
|
Wage
and salary jobs |
-0.8 |
0.5 |
2.4 |
2.6 |
2.7 |
2.3 |
2.1 |
|
Taxable
sales |
-1.4 |
3.9 |
6.2 |
6.9 |
6.9 |
6.3 |
6.2 |
|
Consumer
Price Index |
2.7 |
2.5 |
2.9 |
3.0 |
3.1 |
2.7 |
2.7 |
|
Unemployment
rate (%) |
6.2 |
6.1 |
5.6 |
5.3 |
5.1 |
5.0 |
5.1 |
|
New
housing permits (000) |
155 |
153 |
157 |
164 |
165 |
168 |
165 |
After falling in 2001, the U.S. economy
has experienced a modest rebound over the past
year. For example, U.S. real gross domestic
product (GDP) grew by 3 percent between the third
quarter of 2001 and the third quarter of 2002. This
output increase has occurred despite virtually no
growth in employment and only modest gains in
personal income, and thus is attributable primarily
to increased productivity.
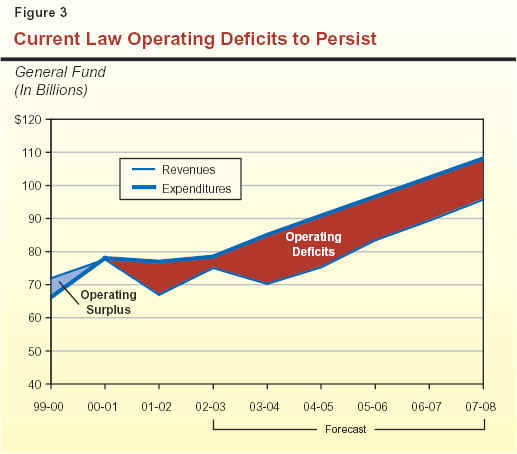
As shown in Figure 2, most of the recent growth in U.S. output has
been related to consumer spending, which has remained
surprisingly strong in view of the lack of job and income
growth over the past year. A key force behind this continued
spending growth has been low interest rates, which
have boosted sales of automobiles and other interest-sensitive
durable goods. Declining mortgage rates have also produced
a boom in both new home sales and financings, as
well as the refinancing of existing mortgages. The new home activity
has directly added to output, and the refinancings
have enabled individuals to reduce their home
payments and/or "cash out" some of their previously
built-up home equity—in both cases providing additional funds for spending.
A very important question for the U.S.
outlook is how much longer can consumer spending
carry the economic expansion—especially in view of
the recent lack of employment and personal income growth in the economy. In this regard, a key
to future economic growth would appear to be increased business spending on capital
equipment and labor.
Normally, continued growth in consumer spending would be matched by new
investment and hiring by businesses. However, this has
not been the case during the past year. For
example, nonresidential investment, which includes spending by businesses on new plants
and equipment, fell by over 4 percent between the
third quarter of 2001 and the third quarter of 2002
(see Figure 2). The decline in business
investment, coupled with cautious attitudes by
employers generally, has contributed to a 190,000 drop
in private sector jobs since the beginning of the year.
The lack of business spending on plants and equipment reflects the large amount of idle
capacity that currently exists in the economy, which
has partly resulted from past over-investment by
many businesses in telecommunications and other
high-tech areas. It also reflects pressures that
businesses are facing from their shareholders and directors
to control costs and improve their "bottom
line" profit statements. These factors have translated
into delays or cancellations of equipment and
software upgrades, and sharp cutbacks in hiring.
The lack of job growth, coupled with declining stock market values and other uncertainties,
is starting to take a toll on consumers. The
Conference Board's consumer confidence survey plunged to
a nine-year low in October, and preliminary
reports suggest that retail sales softened in October.
A slowdown in consumer spending would have major implications for the overall
economic expansion, since consumer spending accounts
for over two-thirds of economic output.
Given these factors, a key to the outlook is an improvement in business spending and
hiring. Such an improvement would provide a
welcome boost to income and jobs, which would in
turn sustain gains in consumer spending and
overall economic growth in the future.
There are no current state-level gross domestic product data available to precisely measure output changes in California. However, the information that is available from such diverse sources as employment, personal income, withholding, taxable sales, new vehicle registrations, and building permit activity suggests that, like the nation, California's economy bottomed-out in late 2001, and has been on a weak growth path during the first ten months of 2002. The recovery has not been of sufficient magnitude to create new jobs and, in fact, California's private sector has experienced job losses during the past year. With regard to personal income, California has suffered a steeper slowdown than the rest of the nation, due to (1) a large amount of job losses in the state's high paying manufacturing sector, and (2) continued declines in stock-option income. Reflecting these factors, we estimate that the state's personal income will increase by just 1.2 percent in 2002, compared to 3.2 percent for the nation as a whole.
As indicated in Figure 3, total California manufacturing employment has fallen by over 230,000 jobs (12 percent) since its peak in late 2000. Although not as dramatic as in the early 1990s, when the state faced major restructuring of its defense industry, the manufacturing job downturn has nevertheless been one of the steepest two-year declines in the state's history.
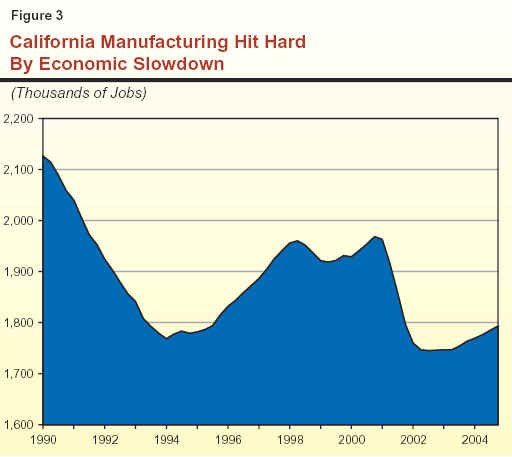
A similarly large employment reduction has occurred in the state's business services job sector (which includes temporary hires by manufacturers as well as computer and software design jobs). After growing at an average rate of 8.4 percent per year between 1995 and 2000, this sector has lost 11 percent of its job base during the past two years. The losses of manufacturing and computer-related business services jobs are significant, since these are among the highest paying jobs in the state.
As with the nation generally, a key force
behind the job losses in California's
manufacturing and business services sectors has been
the weakness in national business investment spending. The decline
is important to California since so much of its
high-tech goods and services are sold to businesses.
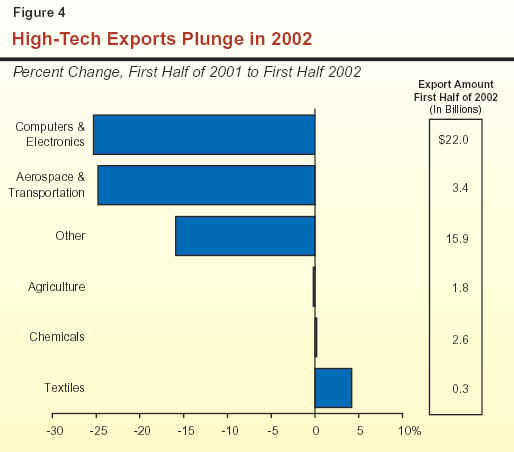
In addition to the decline in U.S. investment spending,
manufacturers in this state are also coping with a plunge
in foreign demand for their products. Total
California-produced exports fell by 11 percent in 2001 and
will decline by another 14 percent this year, due
to soft economic conditions abroad. As shown in Figure 4, the export decline between the first
half of 2001 and the first half of 2002 has been concentrated in computers, electronics,
aerospace, and transportation products. The drop in
exports is important since a significant share of
California-produced high-tech goods are sold in
other countries.
Outside of the manufacturing and
business services sectors, the California economy
has recently managed to grow at a modest pace. The main positive forces have been low interest
rates and continued California population growth.
Like the rest of the nation, California's spending
on automobiles has remained strong in 2002, buoyed by zero-interest financing promotions.
Likewise, strong home sales and mortgage
refinancings associated with low interest rates, along
with continued growth in residential construction activity, are boosting employment in
California's construction and finance-related
industries. Nonbusiness services employment is
also expanding modestly, reflecting gains in such diverse industries as health care, personal
services, and auto repair.
Increases in interest-sensitive and population-driven industries have managed to
keep California's economy on a slight upward track
thus far in 2002. However, it is unlikely that they
can continue to offset the negative effects of
falling business spending and exports for much
longer. Without improvement in these latter two areas,
it is unlikely that California can sustain a
meaningful expansion.
Our forecast assumes that both the national and state economies increase at a very subdued rate through the first half of 2003. At that point, we assume that business spending will finally begin to improve, providing a much-needed boost to overall economic growth. We expect business spending to eventually improve because, although the manufacturing sector currently has a considerable amount of unused capacity, businesses will eventually need to upgrade equipment and software to take advantage of new innovations in communications, web technology, and other areas.
As indicated previously in Figure 1, we
forecast that U.S. GDP will increase by 2.5 percent and
2.6 percent in 2002 and 2003, respectively, before accelerating to 3.8 percent in 2004 and an
average of about 3.3 percent over the balance of
the forecast period. Over the longer term, growth
in U.S. economic output will be aided by healthy gains in worker productivity, which we expect
to rise by slightly over 2 percent per year.
The forecast assumes similarly modest accelerations in jobs
and income. Inflation is expected to remain relatively low over
the forecast period, with the Consumer Price Index forecast to increase by
an average of less than 3 percent over the next
six years.
As with the nation, we expect
California's economy to grow at a very sluggish pace until
the second half of 2003, with employment and
income improving slowly in 2003 before accelerating in
2004 and 2005. The improvement is tied to an assumed rebound in manufacturing employment, which we expect to
benefit from an eventual rebound in business
spending and exports.
We specifically project that personal income
will increase by 4 percent in 2003 and 6.1 percent
in 2004, and that wage and salary employment will grow by 0.5 percent and 2.4 percent during
the same two years. Continued population growth
and low interest rates will result in growth in
residential construction activity during the forecast
period. Nonresidential construction is expected to
decline through mid-2003, then slowly grow thereafter.
Our near-term forecasts for both the nation and California are below the consensus of estimates made by other economists in October 2002, particularly with regard to California personal income growth. However, given recent negative reports on employment, consumer confidence, and manufacturing activity, we believe that even our forecast is subject to considerable downside risk. The combination of a steeper slowdown in consumer spending, and further cutbacks in business investment and hiring, could further weaken near-term growth—or even produce a "double dip" recession early next year. Such a development would result in further job declines and another year of near-zero growth in personal income in 2003. It would also have substantial adverse effects on state tax revenues, and thus on the projected outlook for the General Fund's condition. Another risk involves the current labor management dispute at the West Coast ports. While our forecast assumes that current federally mediated negotiations will produce a successful resolution, a prolonged lockout or strike would disrupt commerce in California and elsewhere in the nation.
As of 2002, California's population
totaled slightly over 35 million. During the six-year
forecast period, the state's population is projected to
grow annually by about 1.5 percent, or well over half
a million persons yearly. Thus, California will
add roughly 3.3 million people over the forecast
interval and reach over 38 million by 2008.
The population growth rate we are projecting is somewhat slower than that experienced in
the latter part of the 1990s. This reflects both
the dampening effects of the slower economy on in-migration, and a continuing downward trend
in birth rates.
California's population growth can be
broken down into two major
components—natural increase (the excess of births over deaths) and
net in-migration (persons moving into California
from other states and countries, minus those leaving
for other destinations). On average, these two components tend to contribute about equally
to the state's population growth, although their relative shares can vary significantly from one
year to the next depending largely on the strength of
net in-migration.
Natural Increase. We project that the
natural-increase component will average about 285,000
new Californians annually over the forecast period.
This amount is slightly less than in the late 1990s, due
to the ongoing decline in birth rates being
experienced by all ethnic groups. Despite these declining
birth rates, however, the natural-increase component
still will grow slightly due to significant growth in
the female population of child-bearing age groups
in faster-growing segments of the population, including Hispanic and Asian women.
Net In-Migration. We project that net
in-migration will average roughly 265,000 annually over the next six
years. This is weaker than during the latter half of the
1990s and somewhat less than the natural-increase component. As indicated by Figure 5, this reflects
a projected drop in domestic net in-migration that
we believe will accompany California's less-than-robust economic performance. In contrast, foreign net
in-migration—which has been relatively stable over the past decade
and has proved to be less sensitive to the economy—is projected
to remain relatively flat.
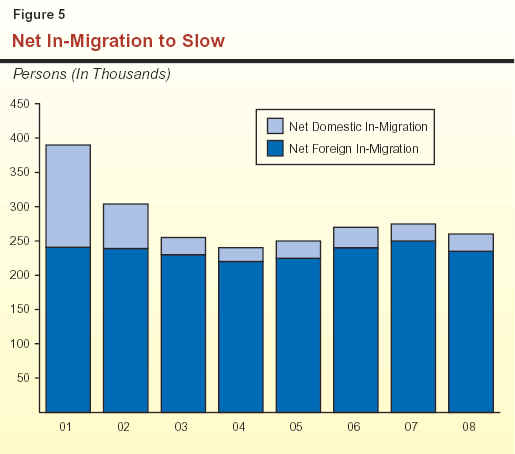
Figure 6 shows our population growth projections by broad age categories, including both numerical and percentage growth.
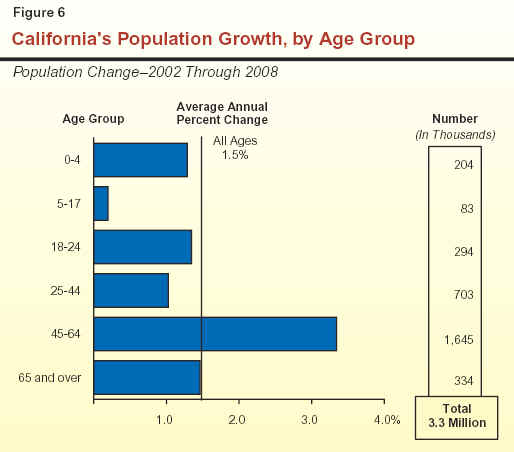
Ranks of Baby Boomers to Swell. The 45-to-64
age group (largely the "baby boomers") continues to
be the fastest growing segment of the population. Over 1.6 million
new people are expected to move into this age category over the next
six years. At the other extreme, although continued in-migration will result
in moderate growth for preschoolers, relatively
slow growth is anticipated for the K-12 school-age population. This reflects the movement of
children of the baby boom generation beyond the
5-to-17 age group. The decline in birth rates in recent
years has also resulted in fewer children moving into
the school-age category.
These various age-group demographic projections can have significant implications
for the state's revenue and expenditure outlook.
For example, strong growth of the 45-64 age group generally benefits tax revenues since this is the
age category that routinely earns the highest wages
and salaries. Likewise, the growth in the young
adult population affects college enrollments, while
that for the 0-to-4 and 5-to-17 age groups drives
K-12 enrollment growth.
The revenues that finance California's state General Fund budget come from a wide variety of different sources, including taxes, fees, licenses, interest earnings on investments, loans, and transfers. The great majority of General Fund revenues, though, is attributable to the state's three major taxes—the personal income tax (PIT), the sales and use tax (SUT), and the corporation tax (CT). In addition, however, actions taken in conjunction with the adoption of the 2002-03 budget have also resulted in a variety of significant one-time revenue increases in the current year related to loans and the securitization of tobacco receipts. In this section, we summarize our revenue projections and provide detail behind our key revenue-related forecast assumptions.
The revenue outlook continues to deteriorate. Our updated revenue forecast, presented in Figure 1, is as follows:
|
Figure 1 The LAO�s General Fund
Revenue Forecast |
|||||||
|
(Dollars in Millions) |
|||||||
|
Revenue Source |
2001-02 |
2002-03 |
2003-04 |
2004-05 |
2005-06 |
2006-07 |
2007-08 |
|
Personal
income tax |
$33,370 |
$34,510 |
$36,380 |
$40,190 |
$44,520 |
$48,450 |
$52,490 |
|
Sales
and use tax |
21,340 |
22,420 |
23,530 |
25,200 |
26,900 |
28,670 |
30,460 |
|
Corporation
tax |
5,620 |
6,760 |
6,700 |
6,540 |
7,010 |
7,530 |
7,930 |
|
Other
revenues and transfers |
12,791 |
11,320 |
3,589 |
3,298 |
3,980 |
4,646 |
4,812 |
|
Total revenues and
transfers |
$73,121 |
$75,010 |
$70,199 |
$75,228 |
$82,410 |
$89,296 |
$95,692 |
|
Percentage
change |
|
2.6% |
-6.4% |
7.2% |
9.5% |
8.4% |
7.2% |
The major downward revisions to revenues
in the current and budget years are primarily
related to the continued softness in California's
economy. This softness is taking a greater toll on personal
income, taxable sales, and taxable profits than we
had previously estimated would be the case. In
addition, the continued deterioration in the stock
market since last spring implies that personal
income taxes from stock options and capital gains will
be even less than assumed in spring 2002.
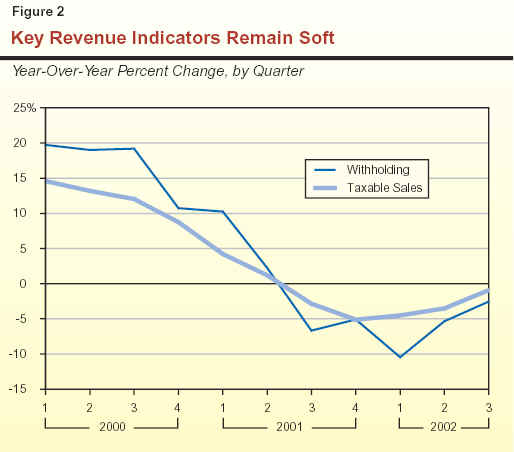
The impacts of continued softness in economic activity are evident in key California revenue
indicators. As shown in Figure 2, although both
personal income tax withholding and taxable sales have shown slight improvements since the
beginning of 2002, both measures remain below last year's already-depressed levels.
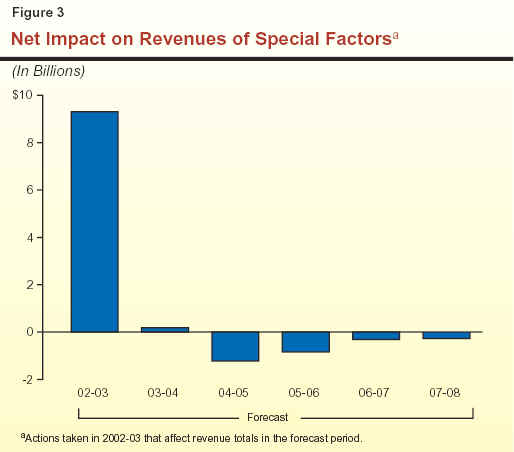
Our revenue forecast for 2002-03 and beyond includes the impacts of numerous actions taken in conjunction with the adoption of the 2002-03 budget. These include:
Combined Effect of Special Factors. Figure 3 shows the net impact of the above special factors on General Fund revenues during the forecast period. Taken together, special factors will increase General Fund revenues and transfers by about $9.5 billion in 2002-03. In 2003-04, the net impact of these factors will be relatively small—$188 million—as the second-year impact of the NOL suspension is partly offset by scheduled loan repayments. In subsequent years (2004-05 through 2007-08), the net impact will be annual losses ranging from $250 million to $1.2 billion. These losses are due to loan repayments and higher NOL deductions.
After its historic 25 percent plunge (from $44.6 billion to $33.4 billion) between 2000-01 and 2001-02, we project that PIT receipts will increase modestly to $34.5 billion in 2002-03 and further to $36.4 billion in 2003-04. Over the longer term, we forecast that PIT receipts will increase at an average annual rate of 9.6 percent between 2003-04 and 2007-08, reaching $52.5 billion by the end of the forecast period.
Much of the estimated PIT revenue gain between 2001-02 and 2002-03 is related to the $1 billion in PIT revenue increases adopted in conjunction with the 2002-03 budget. Absent these changes, the underlying growth in PIT receipts would be less than 1 percent. This small underlying increase is related to both continued economic sluggishness and the adverse impacts of further stock market declines on taxable income related to stock options and capital gains. We estimate that after plunging by nearly 66 percent in 2001, the income from gains and options will decline another 19 percent in 2002 before starting to rebound in 2003. In subsequent years, we project that the combination of an economic rebound and modest improvement in stock market-related income will boost PIT receipts.
We estimate that SUT receipts will total $22.4 billion in 2002-03, a 5.3 percent increase from 2001-02. We forecast that these receipts will grow further to $23.5 billion in 2003-04. Over the longer term, we forecast that SUT receipts will increase at an average annual rate of 6.6 percent between 2003-04 and 2007-08, reaching $30.5 billion by the end of the forecast period. This growth in SUT receipts is projected to be slightly less than our projected growth for statewide personal income for the period, reflecting a slight decline in the portion of income that is spent on taxable commodities.
A key determinant of sales tax receipts is
taxable sales. As indicted earlier in Figure 2, these
sales fell sharply beginning in the second half of
2001, and have only partially recovered in the first
three quarters of this year. On an average annual
basis, taxable sales were down by 0.7 percent in 2001
(reflecting softness in the second half of year),
and are expected to be down another 1.4 percent in
2002. As indicated in the shaded box, much of the
recent softness appears to be due to weak
business-related spending.
Looking ahead, we project that taxable sales
will accelerate, increasing by 3.9 percent in 2003
and 6.2 percent in 2004. Over the longer term, our
forecast assumes that taxable sales will increase
slightly slower than personal income. These increases
are somewhat subdued compared to what would normally be expected during a cyclical upturn. As
indicated in Chapter 2 , consumer spending on
automobiles and other durable goods has been
strong during the recent economic downturn. Because
of this, consumers at this point in time have less
capacity to take on new debt and have less "pent
up" demand than is normal for this stage of an
economic cycle. This, in turn, will constrain taxable
sales growth.
We estimate that CT receipts will increase from $5.6 billion in 2001-02 to $6.8 billion in 2002-03, before falling to $6.7 billion in 2003-04 and $6.5 billion in 2004-05. In the subsequent three years, we project that revenues from this source will increase at an average annual rate of 6.6 percent, reaching $7.9 billion by the end of the forecast period.
Corporation tax receipts in 2002-03 and beyond will be affected both by changes in California taxable corporate profits and by law changes enacted along with the 2002-03 budget. Specifically:
The remaining sources of income for the General Fund include various revenues other than from the PIT, SUT, and CT, as well as transfers to the General Fund from special funds. Included among the other revenues are taxes on insurance premiums, alcoholic beverages, and tobacco, as well as interest on pooled money investments. As shown earlier in Figure 1, we estimate that combined collections from all of these sources will fall from a peak of $12.8 billion in 2001-02, to $11.3 billion in 2002-03 and only $3.6 billion in 2003-04, before partly rebounding to $4.8 billion in 2007-08.
The total revenues from these other sources
depends on a variety of factors, including the
volume of insurance premiums written, alcoholic
beverage and tobacco sales, interest rates, and
the amount of General Fund resources available to
be invested. Our projections for these variables
reflect our underlying economic and demographic assumptions discussed in Chapter 2.
In addition, as noted above, numerous special factors also affect these revenue totals. These
include the electricity loan repayment in 2001-02,
the securitization of future tobacco settlement
receipts, and one-time loans and their associated repayments.
With regard to ongoing revenues in this category, our estimates assume moderate increases
in insurance taxes, stable receipts from alcoholic
beverage taxes, and declining receipts from
tobacco taxes. The estimates also take into account
the phase-out of California's estate tax resulting
from federal law changes enacted in 2001.
As discussed in Chapter 2, the economic forecast on which our revenue projections are based has certain risks that are concentrated on the downside direction. Should the state's economic growth fail to achieve the modest increases we are assuming, annual General Fund revenues could easily fall several billion dollars below what we are projecting. The shortfall would be greater if economic growth stalled out and even a mild downturn were to develop.
Weak Business Spending Behind Drop In Taxable SalesAlthough the plunge in PIT receipts has been the single most significant state revenue
development during the past two years, California taxable sales have also fallen sharply during
this period. This decline has adversely affected the state as well as local governments throughout California.
Although SUT receipts are most generally associated with
retail spending, approximately one-third of taxable sales are actually attributable to
business-to-business transactions. These
include purchases of computers, telecommunications equipment, and building materials that go into
the construction of new facilities. It is the softness in business spending that appears to be
primarily responsible for the recent decline in taxable sales.
The impact of declining business spending on taxable sales during the 2001 economic
downturn can be clearly seen in the detailed taxable sales data recently published by the Board
of Equalization for the third quarter of 2001 (the most recent quarterly data available). It
indicates that, during the 2000 to 2001 period, overall taxable sales fell by just under 3 percent.
However, the relative performance of different components of taxable sales was very different. In particular:
We believe that the trends evident in the 2001 taxable sales data—moderate consumer spending but declines in business-related sales—will persist until mid-2003, when business spending begins to improve. |
In this chapter, we discuss our General Fund expenditure estimates for 2001-02 and 2002-03, and our projections for 2003-04 through 2007-08, both in total and by program area. We first look at general budget trends during the forecast period, and then discuss in more detail our expenditure projections for individual major programs.
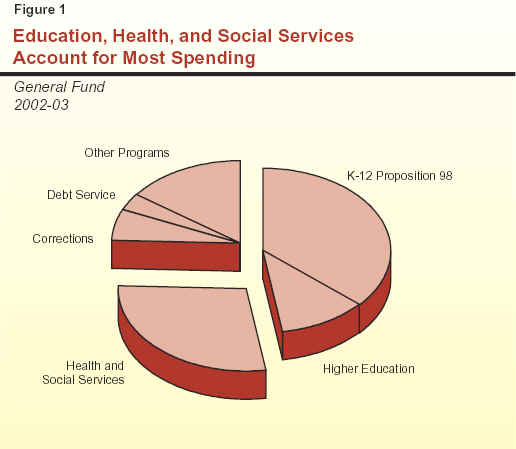
Figure 1 shows how General Fund spending is distributed among major program areas in 2002-03. It shows that education programs dominate state spending, accounting for nearly one-half of the General Fund total. About 37 percent is attributable to K-12 education, and another 11 percent is for higher education (which includes the University of California [UC], California State University [CSU], and California Community Colleges [CCC]). Just over one-fourth of the total is for health and social services, and about 6 percent is for corrections. The remainder is for state operations, debt service, various local subventions (including the vehicle license fee backfill), and other purposes.
Over the forecast period, we project that General Fund expenditures will increase at an average annual rate of 6.6 percent. This overall growth rate reflects divergent trends among major state programs. As indicated in Figure 2:
|
Figure 2 Projected General Fund
Spending for Major Programs |
||||||||||
|
(Dollars in Millions) |
||||||||||
|
|
Estimated |
|
Forecast |
Average
Annual Growth Over the Forecast Period |
||||||
|
2001-02 |
2002-03 |
|
2003-04 |
2004-05 |
2005-06 |
2006-07 |
2007-08 |
|||
|
Education programs |
|
|
|
|
|
|
|
|
|
|
|
K-12-Proposition 98 |
$26,806 |
$28,649 |
|
$29,398 |
$30,568 |
$32,309 |
$33,921 |
$35,316 |
4.3% |
|
|
Community Colleges-Proposition 98 |
2,579 |
2,814 |
|
2,832 |
2,989 |
3,194 |
3,422 |
3,659 |
5.4 |
|
|
CSU |
2,638 |
2,620 |
|
2,747 |
2,896 |
3,026 |
3,174 |
3,340 |
5.0 |
|
|
UC |
3,232 |
3,133 |
|
3,303 |
3,482 |
3,638 |
3,817 |
4,016 |
5.1 |
|
|
Health and Social Services |
|
|
|
|
|
|
|
|
|
|
|
Medi-Cal benefits |
$8,949 |
$9,782 |
|
$11,160 |
$12,075 |
$12,992 |
$13,863 |
$14,915 |
8.8 |
|
|
CalWORKs |
2,021 |
2,041 |
|
2,143 |
2,078 |
2,078 |
2,078 |
2,078 |
0.4 |
|
|
SSI/SSP |
2,807 |
3,060 |
|
3,420 |
3,566 |
3,750 |
3,960 |
4,182 |
6.4 |
|
|
IHSS |
887 |
1,009 |
|
1,106 |
1,217 |
1,337 |
1,440 |
1,550 |
9.0 |
|
|
Other major programs |
6,637 |
6,249 |
|
6,861 |
7,229 |
7,637 |
8,089 |
8,578 |
6.5 |
|
|
Department of Corrections |
4,657 |
4,700 |
|
4,848 |
5,093 |
5,363 |
5,677 |
5,849 |
4.5 |
|
|
Vehicle license fee
subventions |
2,460 |
3,789 |
|
3,888 |
4,065 |
4,308 |
4,565 |
4,838 |
5.0 |
|
|
Debt servicea |
2,954 |
2,571 |
|
2,907 |
4,190 |
4,646 |
5,159 |
5,589 |
16.8 |
|
|
Other programs/costs |
10,313 |
8,036 |
|
10,602 |
11,549 |
12,500 |
13,385 |
14,279 |
12.2 |
|
|
Totals |
$76,940 |
$78,453 |
|
$85,216 |
$90,996 |
$96,779 |
$102,551 |
$108,190 |
6.6% |
|
|
|
||||||||||
|
Detail may not total due to rounding. |
||||||||||
|
a
Includes both general obligation and lease-revenue bonds for all
departments. |
||||||||||
State spending for K-14 education (K-12
schools and community colleges) is governed largely
by Proposition 98, passed by the voters in
1988. Proposition 98 sets the minimum amount the
state must provide for California's public K-12
education system and the CCC. Almost 80 percent of
total operations funding for K-14 education is
from the state General Fund and local property taxes,
pursuant to Proposition 98. The remainder is from
a variety of sources including federal funds,
lottery revenue, and other local revenues. California's
public K-12 education system consists of more than 1,000 locally governed school districts and
county offices of education serving about 6 million
K-12 students. In addition, these entities serve infants
and preschool students receiving child care, and
individuals in adult education programs. The CCC
provides instruction to about 1.7 million adults at
107 colleges operated by 72 locally governed districts.
The Spending Forecast. With the enactment
of the 2002-03 Budget Act, Proposition 98
appropriations exceeded the minimum guarantee by
$6 million. We now estimate that declining General
Fund revenues have lowered the 2002-03 minimum
guarantee by $1.9 billion. Because the 2002-03
appropriation level has not changed, we forecast that
the Proposition 98 minimum guarantee is now
over-appropriated by $1.9 billion.
For 2003-04, we estimate that
Proposition 98 will require the Legislature to allocate
approximately $2.2 billion, or 4.7 percent, more to
Proposition 98 programs than in 2002-03. Since we
estimate that over $1.4 billion of additional
property tax revenue will be allocated to school and
community college districts in 2003-04, the
General Fund increase would be $770 million (a
2.4 percent increase). In addition to the
$2.2 billion growth in the Proposition 98 guarantee, the
Legislature will have available $400 million of
funding in the Proposition 98 base that will be freed-up
for other K-14 priorities in 2003-04. This funding is
a result of spending deferrals that were made to
help address the state's budget problem (see
discussion in the nearby shaded box). For the forecast
period, we estimate that growth in total
Proposition 98 spending (General Fund and local property
taxes) for K-14 education will average 5.4 percent
annually (see Figure 3). This growth rate is lower
than the rate currently projected for 2002-03
(7.6 percent), but higher than the growth rate in
2001-02 (0.7 percent).
Figure 3 The LAO Proposition 98
Forecast 2002-03 2003-04 2004-05 2005-06 2006-07 2007-08 Proposition 98 (In
Billions)a K-12 $41.6 $43.6 $45.9 $48.6 $51.4 $54.0 Community
Colleges 4.8 5.0 5.4 5.7 6.1 6.6 Totals $46.5b $48.7c $51.2d $54.4 $57.5 $60.5 Community Colleges share of guarantee 10.4% 10.4% 10.5% 10.5% 10.7% 10.8% Proposition 98
�Test� 2 2 2 2 2 2 Annual
Percentage Change State
population 1.7% 1.5% 1.5% 1.5% 1.5% 1.5% K-12
average daily attendance 1.4 1.0 0.8 0.8 0.4 0.2 Per
capita personal income -1.3 2.1 3.4 5.3 5.4 5.1 Total
guarantee 7.6 4.7 5.2 6.1 5.8 5.3 General
Fund 7.0 2.4 4.1 5.8 5.2 4.4 Local
property taxes 8.7 9.6 7.4 6.8 7.0 7.0 a
Includes local property tax revenues. b
Assumes restoration of $3.2 billion of "maintenance
factor." c
Assumes restoration of $700 million of maintenance factor. d
Assumes over-appropriation of $428 million to fund Proposition
49. Detail may not add to total due to rounding.
Key Forecast Factors. General Fund
expenditures for Proposition 98 depend on a variety of
factors—including K-12 average daily attendance (ADA),
per capita personal income, per capita General
Fund revenues, and local property taxes. For our
forecast:
Figure 3 summarizes our assumptions for these factors and identifies the annual changes in the guarantee that result.
Commitment to Over-Appropriate Proposition 98. In addition to the above factors, our forecast also accounts for statutory commitments to over-appropriate the minimum guarantee in 2003-04. Chapter 1167, Statutes of 2002 (AB 2781, Oropeza), requires the state to restore any "maintenance factor" in 2003-04 regardless of what the Proposition 98 minimum guarantee would require. (A maintenance factor is created in years where General Fund revenues grow more slowly than the economy. We estimate that the state will have a maintenance factor of $700 million in 2003-04.) Our forecast suggests that General Fund revenues will grow at roughly the same rate as the economy in 2003-04. As a result, Proposition 98 would not require any of the $700 million maintenance factor to be restored. Thus the statutory requirement to restore all of the maintenance factor would result in an over-appropriation of $700 million in 2003-04. In addition, Chapter 1167 requires the state to provide an additional $79 million over-appropriation related to the prior-year's deferrals. The over-appropriation of almost $780 million would become part of the Proposition 98 base—making the increase permanent.
Impact of Proposition 49. Our forecast
also assumes that the recent passage of
Proposition 49—the After School Education
and Safety Program—will require the state to
over-appropriate the minimum guarantee in 2004-05 by
up to $428 million under certain conditions. The
initiative requires the state to over-appropriate
Proposition 98 by the difference between
$550 million and the 2003-04 appropriation for the program.
If the 2002-03 appropriation level of $122 million
is continued into 2003-04, then the state will be
required to over-appropriate Proposition 98
by $428 million in 2004-05. The Legislature and
Governor, however, could decide to increase
funding for the before and after school program in
2003-04. Given the growth in the Proposition 98
minimum guarantee in
2003-04 and the net impact of deferrals, there
will be over $1 billion available—beyond growth
and COLA—for expansion of existing programs
and/or funding for some new programs in 2003-04. Thus, the state could choose to fund part or all
of the required Proposition 49 expansion within the 2003-04 minimum guarantee.
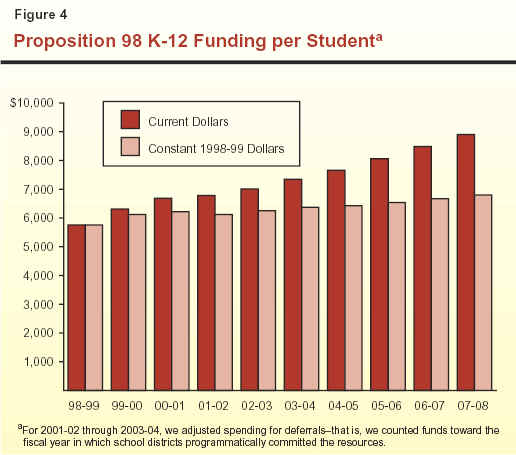
K-12 Funding Projections. Figure 4 displays our projected K-12 per-pupil spending levels (in both "current" and inflation-adjusted dollars). These estimates are derived from our Proposition 98 forecast and are adjusted for funding deferrals between years. (That is, we counted the spending toward the fiscal year in which school districts had programmatically committed the resources.) The estimates reflect real (that is, inflation adjusted) per-pupil increases averaging 1.7 percent annually over the forecast period. These additional resources—averaging over $750 million each year after 2002-03—would permit expansion of existing programs and/or funding for some new programs.
Community College Funding Projections. Based on our Proposition 98 projections, we estimate total CCC funding would increase by about 6.3 percent per year over the forecast period. To forecast the CCC's share of Proposition 98, we assumed that both CCC and K-12 would receive statutorily required growth and COLA each year. We assumed that growth in Proposition 98 funds in excess of growth and COLA would be distributed based on the historic K-12 and CCC split. The resulting forecast projects a gradual increase in CCC's share of Proposition 98 spending from 10.4 percent in 2002-03 to 10.8 percent in 2007-08. As shown in Figure 5, the increase in CCC's share of Proposition 98 funds is due to CCC's enrollment growth rate exceeding K-12's over the forecast period.
2002-03 Deferrals "Free-Up" Over $400 Million in 2003-04As part of the solution to the 2002-03 budget problem, the Governor and Legislature deferred $1.1 billion of Proposition 98 spending from 2001-02 to 2002-03. Instead of receiving $1.1 billion in categorical funding in the late spring of 2002, schools received the funding in summer 2002. The deferral had no programmatic impact on school districts, although some districts may have experienced cash-flow and accounting difficulties as a result of the delay. A second component of the 2002-03 budget solution was to defer $681 million of Proposition 98 funding from 2002-03 to 2003-04. Since the deferrals are one-time costs and the level of deferral paid in 2002-03 ($1.1 billion) is larger than the deferral required to be paid in 2003-04 ($681 million), the Legislature will have over $400 million in resources available for other Proposition 98 priorities in 2003-04. |
In addition to community colleges, the
state's public higher education system includes the
UC and the CSU. The UC consists of eight general
campuses, one health science campus, numerous special research facilities, and a planned tenth
campus in Merced. The UC awards bachelor's, master's,
and doctoral degrees, as well as various professional
degrees. The UC has primary jurisdiction over
public university research. The CSU consists of 23
campuses and several off-campus centers. The CSU
grants bachelor's and master's degrees and may award
doctoral degrees jointly with UC or a private university.
The Spending Forecast. We estimate that
spending for UC and CSU (excluding funding for
capital outlay and debt service) will increase from
$5.8 billion in 2002-03 to $6.1 billion in 2003-04, or
by 4.9 percent. By 2007-08, we estimate that
spending for UC and CSU will increase to $7.3 billion,
reflecting annual increases of about 5 percent.
Key Forecast Factors. For 2003-04 and
subsequent fiscal years, we assume that UC and CSU will
receive base budget increases equivalent to the growth in inflation and enrollments. Over the
forecast period, inflation is projected to average
roughly 3 percent annually. With regard to
enrollment growth, the Master Plan calls for UC and CSU
to draw from a fixed eligibility pool (12.5 percent
and 33.3 percent, respectively) of high school
graduates. The main component of enrollment
growth, therefore, is growth in the number of high
school graduates. This population is expected to grow at
a modest rate of 1 percent to 2 percent annually
over the forecast period. We expect the rate of
college enrollment will be somewhat higher than this,
however, for three reasons. First, the state continues
to conduct outreach and similar activities to
encourage increased college participation by
targeted groups. Second, the recent expansion of
financial aid programs, including the guaranteeing of
Cal Grants to qualified high school graduates, is
subsidizing the cost of college attendance for an
increasing number of students. Third, the declining real
cost of higher education fees (which have not been
increased for eight years) provides an added fiscal
incentive for college attendance.
Cal Grant Increases. Chapter 403, Statutes
of 2000 (SB 1644, Ortiz), made Cal Grant awards an entitlement for every
qualified graduating high school senior. There is still
uncertainty as to the fiscal impact of the new
entitlement program. This is because it is unclear how students
and their families will respond to the changes in Cal
Grant policies. Based on information from the Student
Aid Commission, however, we project that annual
total Cal Grant expenditures could exceed
$1.5 billion by 2007-08.
The 2001-02 budget plan established a new
special fund, the Tobacco Settlement Fund, which
is made up of revenues received by the state from
the settlement of tobacco-related litigation. The law
creating the fund initially required that, after
2001-02, all revenues from this source be deposited in the
fund for the support of various specified health
programs. However, under more recent legislation, this
revenue stream was sold to investors (securitized)
to provide funds to support overall state
expenditures in 2002-03. Because tobacco settlement receipts will
be used to retire this debt for the foreseeable future,
little if any of these funds will be available in 2003-04
and subsequent years for the support of health programs.
The Spending Forecast. This forecast assumes
that the cost of these programs—estimated to
be $546 million in 2002-03—shifts to the state
General Fund. The specific health programs affected by
such funding shifts include Medi-Cal, public health
programs such as the Child Health and Disability
Prevention and prostate cancer treatment programs,
and Healthy Families insurance coverage for children.
The Medi-Cal Program (the federal
Medicaid program in California) provides health care
services to recipients of CalWORKs or SSI/SSP
grants, and other low-income persons who meet the program's eligibility criteria (primarily
families with children and the elderly, blind, or
disabled). The state and federal governments share most of
the program costs on a roughly equal basis.
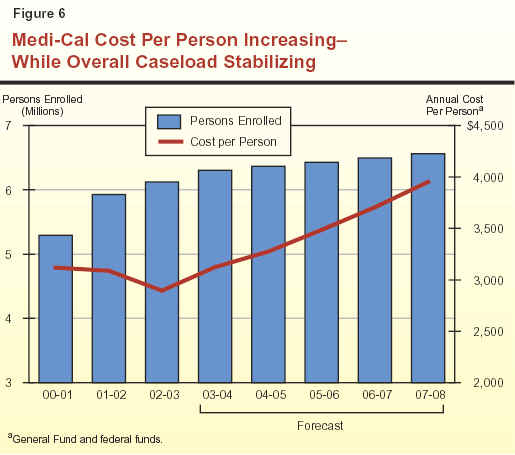
The Spending Forecast. We estimate that
General Fund spending for Medi-Cal local assistance
(including benefits, administration, and other
costs) will be nearly $10.4 billion in the current year,
about a $600 million increase over the amount
appropriated in the 2002-03 Budget
Act. We project that, barring other actions by the Legislature and
Governor, General Fund support for the program would
grow to $11.8 billion in 2003-04, a 13.6 percent
increase from current-year expenditures. By the end of
the forecast period in 2007-08, we estimate that
General Fund spending for Medi-Cal will reach
$15.7 billion, an average annual increase of 8.5 percent over
the projection period.
Key Forecast Factors. Several factors play a
significant role in our forecast:
The Healthy Families Program implements
the federal State Children's Health Insurance
Program, enacted in 1997. Funding generally is on a
two-to-one federal/state matching basis. The program
offers health insurance to eligible children in
families with incomes below 250 percent of the federal
poverty level. Families pay a relatively low monthly premium and are offered coverage similar to that available to state employees.
The state has received federal approval to
expand Healthy Families coverage to eligible parents in
families with incomes below 200 percent of the
federal poverty level. However, the Governor vetoed
funding that had been included in the 2002-03 budget
to commence the expansion in October 2002 because of the state's ongoing
fiscal problems.
The Spending Forecast. We estimate that
overall state spending for the Healthy Families
Program will exceed $260 million in 2002-03, about the
same amount of funding as provided in the 2002-03
Budget Act. About $21 million in support would be
provided from the General Fund, with the balance
in state funding during this period coming from
the Tobacco Settlement Fund.
We further estimate that overall state spending for the program will
increase about 14 percent in 2003-04 to about $300 million, and that by
2007-08 the program will have an annual cost of
about $390 million. The forecast assumes that all
$300 million in state support for the program
commencing in 2003-04 comes from the General Fund.
Key Forecast Factors. The significant increase
in General Fund resources for the program in 2003-04 is the result of the anticipated loss of
program support from the Tobacco Settlement Fund. The forecast assumes that the expansion of the
program to parents does not occur during the
projection period. The growth in the program is based
on the assumption that the caseload of children in Healthy Families continues to grow, although
not as quickly as in previous years, as the
program reaches a larger proportion of the eligible
population. Specifically, we assume that the program,
which had about 570,000 children enrolled as of July
2002, will reach an enrollment of almost 700,000
children by June 2008. The forecast assumes continued
increases in the cost of medical coverage.
The Lanterman Developmental Disabilities
Services Act of 1969 entitles individuals with
developmental disabilities to a variety of services,
which are overseen by the DDS. Individuals with
developmental disabilities have been diagnosed with
mental retardation, cerebral palsy, epilepsy, autism,
or other similar disabling conditions. The DDS
operates five Developmental Centers (DCs) and two smaller facilities which provide 24-hour
institutional care, and contracts with 21 Regional Centers
(RCs) to coordinate and deliver community-based services.
The Spending Forecast. We estimate that
General Fund spending for developmental services
in 2002-03 will total $1.8 billion, the same amount
of funding appropriated in the 2002-03 Budget
Act. Of that total, nearly $1.5 billion will be spent
by RCs for community services and about
$332 million will be spent for operating the DCs.
We further estimate that General Fund spending for developmental services will grow by
about 9 percent in 2003-04 to nearly $2 billion. By
2007-08, we estimate that General Fund spending for
this program will grow by $1 billion and reach
$2.8 billion. This expenditure growth is due almost
entirely to the RCs. We estimate that spending for
DCs will remain relatively flat over the forecast period.
Key Forecast Factors. Our forecast of
significant growth in RC spending reflects historical
increases both in caseload and in the average cost of
serving each RC client. Specifically, our forecast
assumes that RC caseloads will continue to grow at an
annual average rate of 5.4 percent and that costs
will continue to grow at an annual average rate of 5.9 percent.
In response to federal welfare reform
legislation, the Legislature created the CalWORKs program
in 1997. This program provides cash grants and welfare-to-work services to families with children
whose incomes are not adequate to meet their basic needs.
The Spending Forecast. General Fund
spending in 2002-03 for the CalWORKs program is
estimated to be $2 billion, an increase of 1 percent over
the prior year. In 2003-04, spending is projected to
increase by 5 percent, to $2.1 billion. We
project spending to decrease by 3 percent in 2004-05,
and then remain stable through the remainder of
the forecast period. The projected year-over-year
spending changes result from (1) satisfying the
remaining state match obligation for the federal
Welfare-to-Work program in 2003-04 and (2) replacing
lower maintenance-of-effort (MOE)-countable
spending in other programs with additional General
Fund spending within CalWORKs. Continued caseload decline projected through the forecast period
enables the state to maintain spending at the
federal MOE floor.
Key Forecast Factors. Our CalWORKs
spending projection is based on several factors, the most
important being our caseload projections
(discussed below). In addition, we assume that California
will meet the $2.7 billion MOE spending requirement
by counting about $650 million being spent in
other programs. Finally, we assume that the
Temporary Assistance for Needy Families (TANF) block
grant will be reauthorized at its current $3.7 billion
annual level for California.
Unanticipated Caseload Declines Relieve CalWORKs Funding
Pressures. Contrary to 2002-03 Budget Act assumptions, the caseload
decreased in 2001-02, and we project caseloads to
decline further in the current year. (We discuss
caseload trends below.) We project that these
unanticipated caseload declines, as well as continued annual
declines through 2005-06, will result in program
savings and sufficient TANF carryover funds to
enable the state to maintain General Fund spending at
the MOE floor while providing the statutory COLA
and inflation adjustments for employment services
and child care throughout the forecast period.
Sensitivity to Caseload Projections.
Our spending forecast is driven largely by our caseload
projections, and relatively modest caseload movement
in either direction could result in significant
program costs or savings. If the caseload were to remain
stable in 2003-04 and beyond, rather than decreasing
as projected, we estimate that federal carryover
savings would be exhausted in 2004-05. Fully
funding the program in that year would require
General Fund expenditures of approximately
$300 million above the MOE floor. By 2007-08, fully funding
the program would require spending over
$1 billion above the MOE floor.
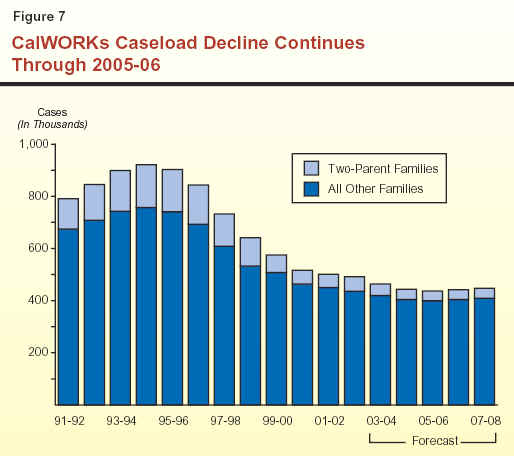
Caseload Trends and Projections. From
1994-95 through 2001-02, the CalWORKs caseload
declined by 46 percent. As shown in Figure 7, we believe the decline will continue, due to
economic and demographic trends (primarily lower
birth rates). Specifically, we project a 2 percent
decline in 2002-03 and a decline of 5 percent in
2003-04, followed by lower declines of 4 percent and
1 percent in 2004-05 and 2005-06, respectively. This
is followed by caseload increases of about
1 percent in both 2006-07 and 2007-08. Our projections
are based on a trend analysis of caseloads, birth
rates, grant levels, and unemployment rates.
The SSI/SSP provides cash assistance to
eligible aged, blind, and disabled persons. The SSI
component is federally funded and the SSP component
is state funded.
The Spending Forecast. General Fund
spending for SSP is estimated to be about $3.1 billion in 2002-03, an increase of 9 percent over the prior
year. For 2003-04, we project an increase of
12 percent, raising total expenditures to $3.4 billion. We
project that from 2004-05 through the end of the
forecast period, spending for SSP will increase by an
annual average of 5.2 percent, eventually reaching a
total of $4.2 billion.
Key Forecast Factors. The 2002-03 Budget
Act delayed the January 2003 COLA until June 2003.
The current-year COLA cost of $24 million results in
annual incremental costs of about $267 million
(representing 11 new months of costs) in 2003-04.
For the remainder of the forecast period, the two
primary components of projected cost increases are (1) annual caseload growth of about 2.2 percent
and (2) providing the statutory January COLA. In 2002-03, caseload growth and COLA result in additional costs of $93 million. In 2003-04 and
subsequent years, annual caseload costs average
about $70 million, and the cost of providing the
COLA ranges from $70 million to $120 million,
depending on the California Necessities Index and the
amount of the federal SSI COLA, which is based on the
Consumer Price Index.
Caseload Trends and Projections. During the
late 1980s and early 1990s, the caseload grew
rapidly, with most of the growth in the disabled
component of the caseload. In the mid-to-late 1990s,
the caseload leveled off and actually declined in
1997-98, in part due to federal policy changes which
restricted eligibility. Since March 1998, the
caseload has been growing at a steady rate of
about 2.2 percent per year. We expect this growth rate
to continue throughout the forecast period.
The IHSS program provides various
services to eligible aged, blind, and disabled persons who
are unable to remain safely in their own homes
without such assistance.
The Spending Forecast. General Fund
spending for IHSS is projected to be about $1 billion in 2002-03, an increase of 14 percent over the
prior year. For 2003-04 we project that costs will
increase by 10 percent. This rate of spending growth will
continue for the next two fiscal years and then fall
to about 8 percent in the final two years of our
forecast, resulting in total expenditures of
$1.6 billion in 2007-08.
Key Forecast Factors. Our forecast assumes
that costs will increase 7.5 percent each year due
to caseload growth and increases in the hours of
service provided to recipients. Recent legislation
authorizing state participation in health benefits
and wage increases for certain IHSS workers will
increase annual costs by an additional $78 million
over the forecast period.
The major state judiciary and criminal justice programs include support for four agencies in the executive branch—the California Department of Corrections (CDC), Department of the Youth Authority, the Department of Justice, and the Office of Criminal Justice Planning—as well as expenditures for local trial courts and state appellate courts. The largest expenditure program—the CDC—is discussed in more detail below.
The CDC is responsible for the
incarceration and care of adult felons and nonfelon
narcotics addicts at 33 state prisons. The CDC also
supervises and provides services to parolees released
to the community.
The Spending Forecast. General Fund
support for CDC is forecast to grow by about
$190 million from 2001-02 to 2003-04, reaching about
$4.8 billion at the end of that period. Expenditures for
CDC are forecast at about $5.8 billion by 2007-08.
(This includes adjustments for employee
compensation increases, but does not include General Fund
support for capital outlay and debt service, which
are accounted for elsewhere in our projections.)
The projected growth in adult correctional expenditures continues a trend of steadily
increasing CDC budgets that has existed since the early
1980s. However, in a change from past growth trends,
the CDC budget now appears likely to grow
significantly more slowly. The forecast assumes that the
CDC budget would grow at an average annual rate of 4.5 percent through 2007-08, compared with
substantially higher prior annual growth rates in
the past that sometimes exceeded 10 percent.
During the forecast period, the department's General Fund costs are
assumed to be partially offset by $143 million in
annual reimbursements from the federal government for
a portion of the state's costs of housing
undocumented immigrants convicted of felonies in California.
This is roughly the same amount budgeted in 2001-02.
Key Forecast Factors. The projected increases
in General Fund support for CDC are driven by a
combination of factors, including correctional officer
salary increases pursuant to the Unit 6 bargaining
agreement; overtime, sick leave, and workers'
compensation costs; and growth in the cost of inmate
health care services. The Unit 6 agreement went into
effect in January 2002 and is estimated to result
in salary increases of over $600 million during
the forecast period, with the first increase expected
in 2002-03. Also, increases in the overall cost of
providing health care to inmates have caused
health care expenditures to increase at a higher rate
than other prison support costs.
Prison population is not a significant driver
of General Fund cost increases after 2002-03. As
seen in Figure 8, although the population is
projected to increase by 2,700 inmates by the end of
2002-03, it is expected to stabilize at this level
increasing by only 540 inmates (or less than
1percent) over the remainder of the projection period.
According to CDC, the 2002-03 population increase
is largely due to a reduction in available local jail
beds for CDC commitments.
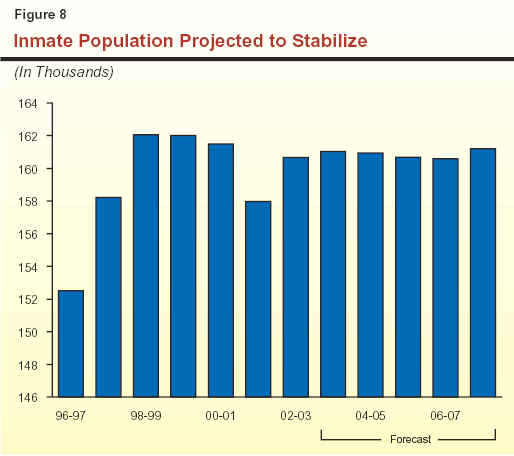
The 2002-03 budget package contained a
number of provisions designed to generate
statewide General Fund savings, including
(1) unallocated reductions in departments' state operations
budgets, (2) a golden handshake program for early retirement from state service, (3) elimination of
vacant positions, and (4) the continuation of a
hiring freeze. In total, these provisions were expected
to generate over $1.1 billion in General Fund
savings in 2002-03.
Based on several factors, we do not expect
these provisions to generate the magnitude of
expected savings in the current year. For instance, the
golden handshake program will likely generate no
savings due to optional participation by departments
and the requirement that positions be held vacant
only long enough to offset increased retirement costs.
As a result, we project savings for these items to
total slightly more than $300 million in 2002-03. We
expect that this amount will increase in 2003-04
and thereafter, as additional vacancies are eliminated
and spending reductions are more fully implemented.
In projecting expenditures for employee compensation costs, we have estimated the future costs for existing agreements between the state and its bargaining units. For instance, the negotiated pay increases for highway patrol and correctional officers will increase General Fund expenditures by $73 million in 2003-04—increasing to $677 million by 2006-07. For the other bargaining units without long-term agreements, we have included the costs for the general 5 percent salary increase due to begin at the start of 2003-04 ($188 million General Fund annually). For these units, we assumed compensation costs in future years will increase at the same rate as inflation. A 1 percent salary increase for state employees in these units increases General Fund costs by about $39 million.
The California Constitution requires the state to reimburse local governments and K-14 school districts for the cost of complying with state mandates. In 2003-04, we estimate that the state will incur costs of about $1 billion to reimburse local governments and K-14 districts for new and ongoing mandates. We assume that funding for education mandates (approximately $500 million of the $1 billion) will be incorporated within the Proposition 98 guarantee—as has been the practice in previous years. We project that these annual mandate costs will grow by 5 percent a year, although recent experience suggests that these costs may grow at an even higher rate. In 2002-03, the state deferred payment on over $800 million of noneducation mandate claims. We assume the state will pay these deferred claims, with interest, between 2004-05 and 2007-08.
| LAO Publications
To request publications call (916) 445-4656. This report and others, as well as an E-mail subscription service, are available on the LAO's Internet site at www.lao.ca.gov. The LAO is located at 925 L Street, Suite 1000, Sacramento, CA 95814. |