
The 2002 California English Language Development Test documents the progress of more than 1.3 million English learner students in the state. This reports summarizes student achievement as measured by the test and evaluates the rate at which students' English skills improve. On the whole, student progress is slow, although some groups of students appear to make rapid progress.
In the fall of 2002, almost 1.3 million English learner (EL) students took the California English Language Development Test (CELDT)—including about 1 million taking the test for the second time. This report describes the progress EL students made in mastering English—an essential step toward long-term success for these students.
The CELDT measures a student's English proficiency in listening, speaking, reading, and writing. All K-12 students identified as ELs take the test each fall. The CELDT uses a five-level scale to report scores, with a level 1 indicating a beginning level of fluency and a level 5 indicating advanced English skills. A score of 4 or 5 signals a student may be ready to be reclassified as "fluent."
The 2002 results showed that almost three-quarters of all EL students scored at level 3 or higher. Students in the early elementary grades scored lower—about half of students scored in the upper three levels.
About half the students tested on CELDT in both 2001 and 2002 improved their score by at least one level. Another 9 percent of students scored at least one level lower on the 2002 test. In general, the proportion of students gaining a level is highest at the earlier stages of learning. For instance, more than 70 percent of students who scored a level 1 in 2001 improved their CELDT score by at least one level in 2002; only 32 percent of students who scored a level 4 in 2001 gained a level in 2002.
Reading and writing pose major challenges to EL students in the early grades. The CELDT tests students in reading and writing for the first time in second grade. In general, students fare poorly on this test and on the third grade test, when the demands of the CELDT in reading and writing increase significantly. These early-grade results seem to reflect longer-term problems that slow student progress in mastering English.
We used the CELDT gains from 2001 to 2002 to simulate the experience of EL students enrolled in kindergarten over their next 12 years of school. Based primarily on the CELDT data, our simulation projects that it takes about six years before half of these students are reclassified as fluent. About 40 percent of the kindergarteners still will not be proficient in English when they begin seventh grade. This is a long time. Students who are still learning English in grades 4 through 6 risk falling behind in school by failing to master the skills needed for success in middle and high school.
Some groups of EL students progress much more quickly, however. The accompanying figure shows the proportion of kindergarten students our simulation projects would achieve proficiency for four language groups. Very few students in any group are reclassified in kindergarten or first grade. Beginning in second grade, there are large differences among language groups in the time it takes for students to reach fluency. For instance, students whose native language is Mandarin make very rapid progress in mastering English—by fourth grade, we project more than half of these students would be reclassified. By sixth grade, 85 percent of Mandarin speakers are proficient in English. This rapid progress is evident in the early elementary grades.

The significant differences among EL students based on their native language suggest that language instruction in K-12 schools is not uniformly effective for all groups. Rather than focus on one or two models, therefore, we think the Legislature should focus on learning about the "mix of services" that work for particular groups of EL students to help them achieve proficiency more quickly.
An effective mix of services for certain groups may look very different than what schools currently provide. A student who arrives in the state from another country at age 14 may need a very different educational program than a kindergarten student who was born in California. Similarly, an effective mix of services for some language groups may require schools to work more closely with parents and communities about the importance of quickly gaining proficiency in English.
The success of EL students is a critical issue for the state's K-12 system and for the state's economy. One-third of California's kindergarten students were identified as ELs in 2001. If our schools are not successful with this group, we will have failed not only the students, but also failed to adequately provide a trained workforce for the state's economy.
In the fall of 2001, K-12 students took the CELDT for the first time. The test was administered to students classified as ELs—that is, those students for whom English is not their primary language. In 2002, almost 1.3 million EL students took the test, and about 1 million took the test for the second time.
The 2002 CELDT results offer a first look at the progress of EL students in learning to speak, listen, read, and write in English. This is an issue of great importance to our state. Almost one-quarter of all K-12 students are classified as ELs. In kindergarten and first grade, more than one-third of all students are ELs. For these students, mastering English is an essential step toward long-term success in school.
This report is intended to help the Legislature understand the significance of these initial results. In the pages that follow, we focus on where students are in their journey to English proficiency and the gains they made between the 2001 CELDT and the 2002 test. Using this data, we provide some preliminary conclusions of whether these results are good news or bad news for California and its education system.
The report does not explain the causes of these results—that is, why certain groups of students demonstrate greater gains than others. The Legislature is currently funding a multiyear evaluation of programs for EL students. We believe this evaluation is the appropriate place to look for suggestions of how to improve programs serving this population.
The CELDT results, however, provide a new perspective on an important question for our state: How well is the K-12 system addressing the needs of EL students? This data represents an indispensable tool for schools, districts, and the state to monitor the progress of EL students and to identify instructional strategies that create improved student outcomes. As the test is administered in future years and student-level scores are merged with results from the Standardized Testing and Reporting (STAR) tests and the High School Exit Examination, the state will be able to expand its understanding of these critical issues.
The CELDT measures a student's English proficiency in listening, speaking, reading, and writing. The test is given in the fall to all students who are identified as ELs. The fall test is known as the "annual" assessment. Students who are new to public education in California (such as kindergarteners and students moving to California during the school year), or students new to a district for whom no previous CELDT results are available, take the CELDT as part of the student's "initial" assessment.
In 2002, listening and speaking were assessed by asking each student to respond to questions that measured such general skills as comprehension and spoken fluency in English, as well as specific skills, such as phonetic awareness. Reading and writing were measured through a group-administered test that included multiple-choice and written exercises.
The CELDT reports a total student score and three component scores (reading, writing, and a combined listening and speaking score).The test uses a five-level scale designed to indicate each student's English proficiency. A score of 1 indicates a beginning level of English fluency; a 5 indicates advanced English skills.
State law requires districts to use CELDT results as one piece of information for determining whether students should be reclassified as fluent. Generally, an overall score of 4 or 5 on the test indicates that a student's English skills are sufficient to allow the student to learn in a regular classroom without additional tutoring or assistance.
Students may not be reclassified, however, until their academic skills are comparable to their English-speaking peers. For this reason, state law requires districts to include STAR results as information used in the reclassification process. (Parent and teacher input also is required as part of the reclassification process.) Because the reclassification process requires that students demonstrate adequate English fluency and academic skills, students can score a 4 or 5 on the CELDT for more than one year as they work to improve their academic skills.
Except as indicated otherwise, data used for this report come from the results of the 2002 CELDT annual administration. This data set is most valuable because it contains both the 2001 and 2002 CELDT scores for most EL students. This allows us to measure both the status and growth of English proficiency for this population.
The limited amount of data on EL students that is reported as part of the CELDT affords a basic description of this large and complex population. In this section, we report on selected characteristics of the students who took the CELDT in 2002. It is important to note that, at the time this report was written, the State Department of Education (SDE) had not released the results for kindergarten students who took the CELDT in 2002. From our review of the 2001 data, however, we believe that including the kindergarten data would not alter significantly the characteristics of this group or the analysis of the CELDT results.
Figure 1 illustrates the number of EL students who took the 2002 CELDT test by grade. As the figure shows, there are about 160,000 EL students each in grades 1 through 3. Beginning in grade 4, the number of students begins to decline. By twelfth grade, there are 40,000 EL students attending California schools.
The EL population comprises a significant proportion of the overall K-12 student population. For all grades, EL students represent 24 percent of all students. In first grade, however, EL students account for one of every three students. By twelfth grade, only 10 percent of students are classified as EL.
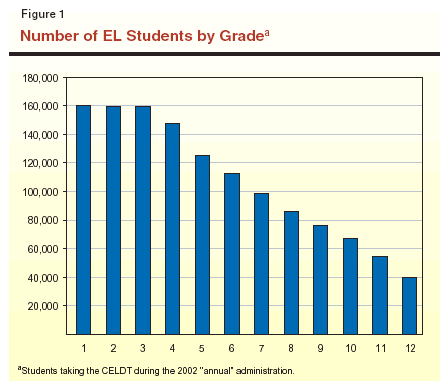
Figure 2 shows the native language of EL students taking the CELDT test. Spanish speakers dominate the EL population in California, accounting for 83 percent of EL students. Asian and Pacific Islander languages account for seven of the next eight largest groups and represent 9 percent of the EL population. The "other" group, accounting for 6.8 percent of EL students, is composed of students speaking one of at least 50 other languages.
|
Figure 2 Number of CELDT
Test-Takers |
||
|
|
Number |
Percent |
|
Spanish |
1,078,006 |
83.1% |
|
Vietnamese |
30,970 |
2.4 |
|
Hmong |
22,618 |
1.7 |
|
Cantonese |
20,448 |
1.6 |
|
Pilipinoa |
15,252 |
1.2 |
|
Korean |
13,518 |
1.0 |
|
Cambodian |
10,379 |
0.8 |
|
Armenian |
10,208 |
0.8 |
|
Mandarin |
8,143 |
0.6 |
|
Other |
87,893 |
6.8 |
|
Totals |
1,297,435 |
100.0% |
|
|
||
|
a
Pilipino is the official language of the Philippine Islands. |
||
The CELDT also reports how long EL students have attended their current school and district. Figure 3 (see next pge) illustrates the proportion of students by grade that attend the same school or district since kindergarten. The percentage of EL students with continuous enrollment in one school drops quickly throughout the primary school years. By fifth grade, only 40 percent of students attend the same elementary school. By seventh grade, when most students have moved from elementary school to a middle school, few students remain in their original school.
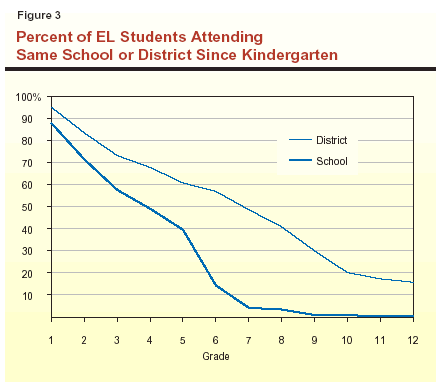
Continuous enrollment in the same district, however, is more stable than school enrollment. By sixth grade, more than half of EL students attend the same district in which they began. There is a noticeable dip in ninth grade and tenth grade—in part, this occurs when students attending elementary districts must "move" to a high school district for ninth grade. In eleventh and twelfth grades, the proportion bottoms out in the high teens.
Figure 4 displays the proportion of students that are classified as ELs in the five regions of the state. As the figure illustrates, EL students represent the highest proportion of students in the counties in the southern part of the state and in the Central Valley. There is significant variation within each region as well. For instance, in Imperial and Los Angeles Counties, EL students comprise 30 percent and 41 percent, respectively, of all students in the county. In contrast, only 17 percent of students are classified as ELs in San Bernardino County.
|
Figure 4 English Learner Students
as a |
|
|
Region |
Percent |
|
South State |
25.3% |
|
Central Valley |
21.4 |
|
Bay Area |
16.7 |
|
Mountain |
3.6 |
|
North State |
3.3 |
Figure 5 displays similar data for the 20 districts serving the largest number of EL students in the state. The districts are ranked in descending order by the number of EL students enrolled in each district. All but two are unified districts and 15 of the 20 districts are in the southern region of the state. Most of these districts are located in a large urban area, although rural and suburban districts also are represented. In total, these 20 districts served more than 580,000 EL students in 2002, or about 45 percent of all EL students in the state.
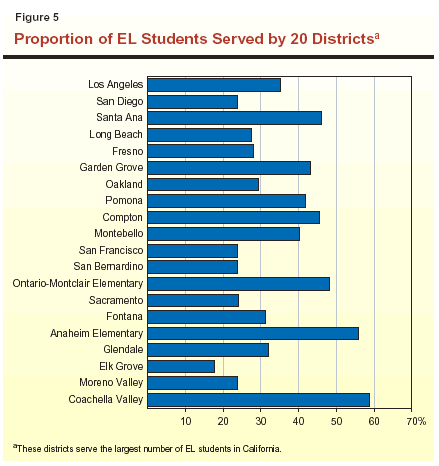
The proportion of EL students in these large districts varies significantly. In five districts, more than 45 percent of the districts' students are classified as ELs. Of these, more than half of the students at Anaheim Elementary and Coachella Valley are ELs. In contrast, about one-quarter of students in six districts—including San Diego and San Bernardino—are ELs and only about 18 percent of students in Elk Grove are classified as ELs.
As discussed earlier, the proportion of EL students in first grade is significantly larger than the percentage for all of grades 1 through 12. In Los Angeles, for instance, 55 percent of first graders are classified as ELs. In Garden Grove, more than 70 percent of first graders are ELs, and in Coachella Valley, 90 percent of first graders are EL students. Consequently, helping EL students to learn English is a central educational objective for schools in these districts.
In this section, we review the results of the 2002 CELDT in two ways. First, we examine how well students fared on the test as evidenced by the proportion of students at each proficiency level. Second, we measure the improvement in English skills of students taking the 2002 test. The 2002 CELDT required districts to include the 2001 CELDT scores as part of the information provided on each student, which permits an analysis of the growth in student English skills during the 2001-02 school year. An analysis of individual student progress is not possible currently for the other state assessments, such as STAR. For the other tests, improvement in achievement can be measured only by examining changes in group scores—such as the change in overall student performance at a school or district level.
Figure 6 displays the proficiency scores of the 1.3 million students who took the CELDT in 2002. As the figure indicates, 477,000 (37 percent) of these students scored a 3 on the test, indicating they have achieved a high level of proficiency but are not yet fluent. Almost 450,000 (35 percent) scored a 4 or 5. These students are probably fluent in English, although they may not be ready to be reclassified. Of the remaining students, 124,000 (10 percent) scored at the lowest level and almost 250,000 (19 percent) scored a 2.
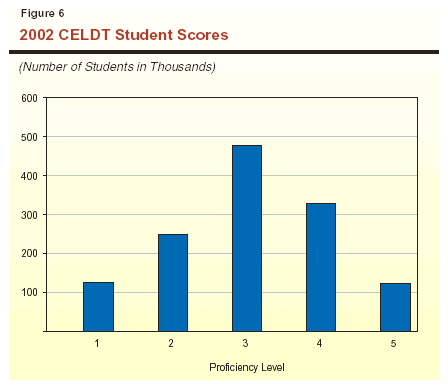
Figure 7 displays the percentage of students at each CELDT proficiency level in 2001 that gained or lost at least one level on the 2002 CELDT. In total, half of students improved at least one level on CELDT in 2002. The proportion of students gaining a proficiency level is highest for students at the earlier stages of learning English. More than 70 percent of EL students who scored a 1 in 2001 scored at least a 2 in 2002. Similarly, 64 percent of students scoring at level 2 in 2001 scored a 3 or higher in 2002.
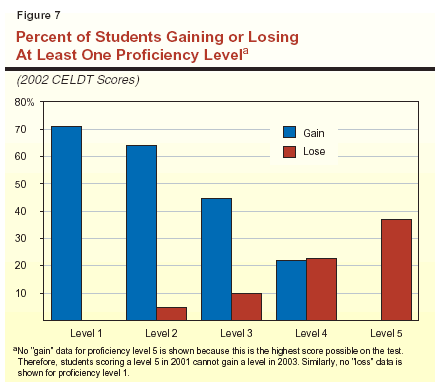
As English proficiency improves, however, gains appear more difficult to achieve. In contrast to the high rates of students at levels 1 and 2, only 45 percent of the students at level 3 improved to at least a 4, and 22 percent of students at level 4 in 2001 improved to level 5 in 2002.
Another 9 percent of students scored at least one level lower on the 2002 CELDT than in 2001. The losses are most significant at levels 4 and 5. At level 4, the proportion of students losing a level completely offset those students who gained a level. Almost 37 percent of students scoring a 5 on the 2001 CELDT scored at a lower level on the 2002 test.
Because of the nature of the data, however, the actual improvement and loss rates in levels 4 and 5 are better than the observed rates. The 2002 CELDT data does not include students who were reclassified as fluent during 2001. We can estimate the number of reclassified students by comparing the number of students reported on the 2001 CELDT to the 2001 scores as reported on the 2002 CELDT. If we add these reclassified students to our calculation, loss rates would be lower than observed. We estimate loss rates of 15 percent at level 4 (down from 23 percent) and 20 percent at level 5 (down from 37 percent).
Similarly, our estimated level 4 improvement rate would be 32 percent (up from 22 percent). This assumes that all reclassified students would have improved to a level 5. Unfortunately, without a true longitudinal database that contains both ELs and reclassified EL students, we cannot provide a better measure of the actual changes in the performance of these groups.
Figure 8 displays the 2002 CELDT scores by grade level. In first grade, the EL population is fairly evenly distributed, with just under 30 percent in both the lowest and highest two levels. The remaining 42 percent of students scored in level 3. The proportion of students scoring in levels 1 and 2 increases to almost 50 percent by third grade. Beginning in fourth grade, the proportion in levels 1 and 2 falls sharply and hovers around 20 percent from grade 5 through grade 12.
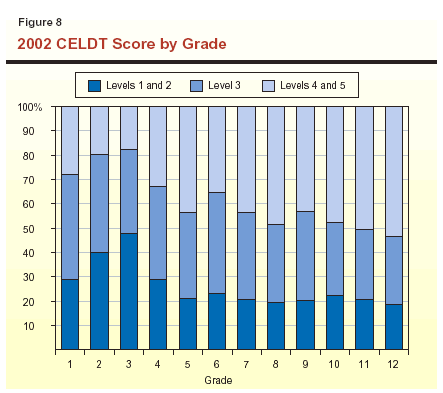
The reverse of this trend is the pattern for the highest performance levels. By grade 3, the proportion at levels 4 and 5 shrinks to 18 percent. In fourth grade, the group expands significantly and reaches 44 percent of the total EL population by grade 5. For the remaining grades, the proportion accounted for by students in levels 4 and 5 generally increases, so that in grades 11 and 12 it exceeds 50 percent.
Perhaps the most surprising trend in this data is the increase in the proportion of EL students scoring at levels 1 and 2 during grades 2 and 3. This increase stems from several factors, including students whose skill development is not keeping pace with the higher demands of the tests in these grades. In the next section, we examine gains and losses by grade and discuss these issues further.
Figure 9 displays the percent of students who gained on the CELDT (or the "improvement" rate) from 2001 to 2002 by grade in two ways. The first bar in each grade reflects the total improvement rate, or the actual percentage of students gaining one or more levels. For the whole EL population tested in 2002, just over 50 percent of students improved at least one proficiency level.
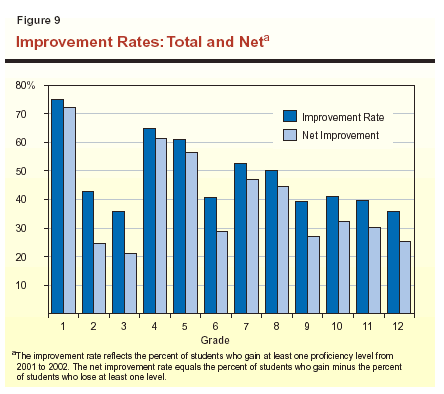
The figure displays several important trends in the CELDT data:
Technical Flaw in the CELDT. Improvement rates shown in Figure 9 for grades 2, 3, 6, and 9 are very different than in the other grades. In each of these grades, there is a large reduction in the proportion of students improving on the test and an increase in the percentage of students losing at least a level on the test. In Figure 8, we observed an increase in the number of second and third grade students scoring at the lower two levels on CELDT. The data in Figure 9 illustrate that smaller gains and larger losses of students in these grades are resulting in these unusual outcomes.
For grades 3, 6, and 9, our analysis suggests that these patterns may be due to a flaw in the CELDT scoring system. The CELDT is comprised of four different tests, each designed to cover three grades—K-2, 3 through 5, 6 through 8, and 9 through 12. Each test has one set of proficiency scores that apply to all students in the three grades covered by each test. The significantly lower proportion of students gaining a level in grades 3, 6, and 9 suggests the proficiency levels for the tests in these grades may be set too high or the levels for the previous grade set too low. The SDE is aware of this problem and is seeking funding to address it.
The second grade CELDT assesses students in reading and writing for the first time (students in K-1 are assessed only on speaking and listening). Thus, the low improvement rates at this grade suggest that reading and writing skills are slowing the progress of some EL students on the test.
Figure 10 displays the reading, writing, listening, and speaking scores of second grade students. The listening and speaking skills of students are much more advanced than the reading or writing skills. The fact that writing scores are higher than reading scores is puzzling. Most experts in language acquisition indicate that reading skills usually develop before writing. As a result, the low improvement rates in grade 2 may be explained in part by a problem with the test.
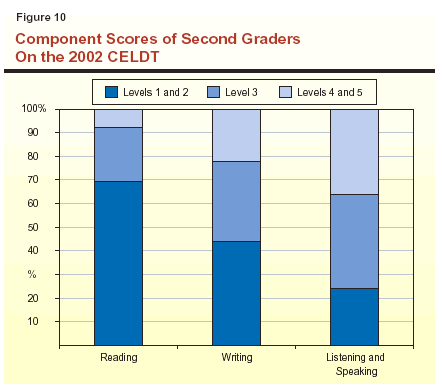
Despite this apparent problem, it is clear that the listening and speaking skills of EL students are considerably more developed than their reading and writing skills. More than 75 percent of second graders score at level 3 or higher on the listening and speaking tests, which indicates a fairly high level of skill. Only 30 percent to 55 percent possess the same level of reading and writing skills.
As we will see later in this report, the status of second graders—and their reading and writing scores—is an important indicator of progress. Some groups of EL students show advanced reading and writing skills on the second grade CELDT. These students appear to become fluent and reclassify much more quickly than students who do not possess early reading and writing skills.
The CELDT growth data provide a powerful tool for answering the question: How long will it take the average EL student to master English and the academic skills needed to be reclassified? To answer this question, we developed a simulation model of the EL population using CELDT improvement rates by grade and proficiency level, as well as data from the STAR tests and the California Basic Educational Data System (CBEDS).
Our simulation model is based on the assumption that the 2002 CELDT improvement rates will apply in the future as students move up the grade levels and improve in English proficiency. As the starting point, we used the number of kindergarten students at each proficiency level in 2001. Then, we applied the improvement rates—both gains and losses—from the 2002 CELDT data to project the English proficiency of kindergarten students when they reach first grade. We repeated that process, applying the gain and loss rates to the number of students at each grade and level to project the progress of the 2001 kindergarten students over the next 12 years.
Several other important assumptions were required in the development of our model, including:
A more detailed discussion of our model can be found in Appendix A.
It is important to stress the preliminary nature of these simulation results. The CELDT improvement rates may change as flaws with the test are corrected. Our assumptions for reclassification were designed to produce a "reasonable" match in the outcomes between our simulation and actual EL enrollment. Despite these caveats, we believe the simulations provide important insights into the meaning of the CELDT data. In addition, the simulation provides a standardized measure to compare the progress of various groups of EL students—one that is not influenced by the mix of grade and proficiency levels of students in a group.
The results of this simulation are displayed in Figure 11. The bottom line in the figure represents the progress of students who enrolled in kindergarten in 2001. This initial group starts at about 160,000 students and declines each year as students are reclassified.
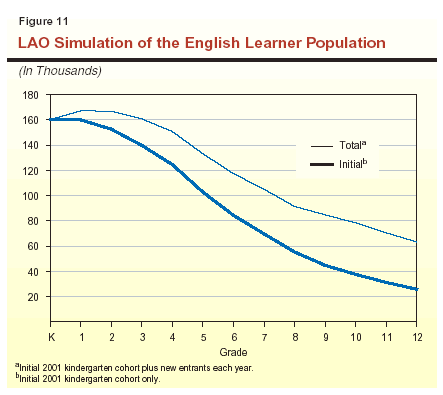
Our projections for the initial cohort paint a picture of fairly slow progress of the EL population.
The top line in Figure 11 displays the simulation results for the 2001 kindergarten cohort plus the new entrants that arrive in California each year. The 12-year trend for this total EL cohort is very similar to the initial cohort. This is not surprising, since the initial cohort accounts for a large proportion of the total EL cohort in every grade. There are two major differences, however. First, the addition of the new entrants results in the total EL population actually increasing in first grade. In succeeding years, the number of students who are reclassified as proficient exceeds the number of new entrants arriving each year, and the total EL population declines.
The second difference is that the total EL population declines at a slower rate than the initial cohort. One reason for the slower decline is that new EL students arriving in the state offset a portion of the reduction in the EL population due to reclassifications. Second, while new entrants appear to make progress at about the same rate as students who begin in kindergarten, they arrive in the state with low levels of English proficiency. As a result, the students take several years before they attain the English fluency needed for reclassification.
Our projections for the "total" EL population illustrate the role of new entrants in determining the size of the total EL population in middle and high school. By seventh grade, new entrants constitute about one-third of EL students. By twelfth grade there are still more than 63,000 EL students. Of this total, 38,000 (60 percent) are new entrants who have not been reclassified during their time in California schools.
Based on our simulation, after six years of public schooling, about half of EL students who attended California schools since kindergarten gained the English and other academic skills needed to be reclassified. During the next three years of schooling, an additional 30 percent of the initial group is reclassified. These findings generally are consistent with recent research indicating EL students are typically reclassified in four to seven years.
Our projections, however, reveal two other important findings about the progress of this group. First, a large proportion of the initial cohort continues into middle and high school without being reclassified. More than 40 percent of the initial kindergarten cohort enters seventh grade as an EL student. In addition, our projections highlight the fact that a significant number of EL students arrive in California beginning in first grade and that a high percentage of these students never establish English proficiency. Our simulation model projects that almost 40,000 students, or 60 percent of those who begin attending school in California after kindergarten, never become reclassified by twelfth grade.
This is not good news. The EL students represent one-third of our first graders, and the CELDT data suggest the transition to English fluency is taking too long. This is because students who are still learning English in grades 4, 5, and 6 risk falling behind in academic proficiency and failing to master the skills needed for success in middle and high school. California's system of content standards and assessments sets high expectations for the skills and knowledge expected of all students. The risk for EL students is twofold: time spent on basic English skills is time taken away from learning higher-level concepts. In addition, a partial grasp of English may further inhibit the acquisition of more complex skills.
Some groups of EL students progress much more quickly than the statewide average suggests, however. In the next section of this report, we examine the progress of the EL population by disaggregating the CELDT results based on the native language spoken by each student.
Unlike the STAR, the CELDT collects little demographic information on students taking the test. For instance, the state collects data on parent education and free and reduced price lunch participation of students taking the STAR. Because this type of data is not collected for CELDT, we are unable to provide much insight about how differences in the student population affect the CELDT results.
One demographic element that is collected by CELDT is the native language of students. This variable is interesting as it is often associated with quite different cultures, which may have an impact on the educational achievements of students prior to coming to the United States and family and community attitudes about the value of education.
Figure 12 shows the 2002 CELDT scores by the nine largest primary language groups and all other language groups. Of the EL students who speak Spanish as their primary language, about 31 percent scored in levels 1 and 2, 37 percent scored in level 3, and the remaining 32 percent scored in levels 4 or 5. The distribution across the proficiency levels for other languages differed considerably. Pilipino speakers, for instance, had the lowest proportion of students in levels 1 and 2 (15 percent). Students speaking Pilipino, Korean, and Mandarin had the highest percentage of students scoring at levels 4 and 5—all exceeding 50 percent.
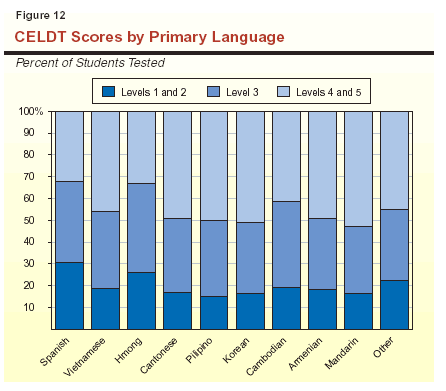
Figure 13 displays the total and net improvement rates by language. As described above, the total improvement rate is the percent of students improving by at least one proficiency level and the net improvement rate subtracts the percent of students losing at least a level from the percent gaining. For most of the language groups, the total improvement rate is about 50 percent and the net improvement rate averages near 40 percent. There are some interesting differences, however.
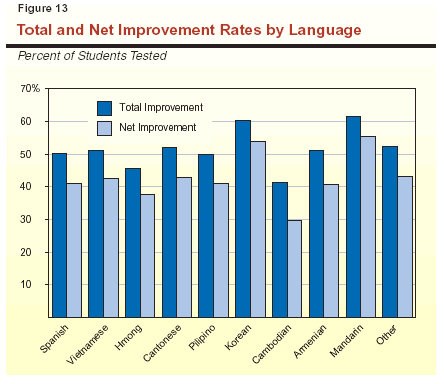
The language groups with the highest total improvement also have the smallest percentage of students losing a level. Students who speak Korean and Mandarin as their primary language show total improvement rates of 60 percent and 61 percent, respectively. Because the proportion of students losing a level (about 6 percent) is one-third lower than the state average, these two groups have net improvement rates of about 55 percent.
Students who speak Hmong or Cambodian as their native language show the lowest improvement rates. The growth in the performance of Cambodian speakers is especially low. Only 42 percent of this group show sufficient growth in English to gain a level on the CELDT in 2002. Because a relatively large proportion of Cambodian speakers also lose a level on the test, the net improvement rate for the group is only 30 percent—about half the rate of the highest performing groups.
The improvement rate for Hmong speakers is about 8 percentage points higher than for Cambodian speakers. This finding is somewhat surprising. A written form of Hmong was developed only recently. As a result, Hmong immigrants often arrive in the United States with low literacy skills in their own language and few traditions of promoting literacy to their children. Given these challenges, we might expect to see this group of students faring significantly worse than the data suggests.
In the analysis of the statewide data, we saw that the increasing language demands of the CELDT in grades 2 and 3 dramatically reduce student gains and increase losses. In the next section, we examine the second grade CELDT scores to see whether all different language groups are similarly affected by the introduction of reading and writing on the test.
Figure 14 displays CELDT reading scores
for second grade EL students by their native language. Grouped this way, the reading skills
of students in English varies significantly. For
instance, more than 80 percent of Korean- and Mandarin-speaking students scored at level 3
or higher. For students who speak Spanish or Hmong, however, that figure is less than 30
percent.
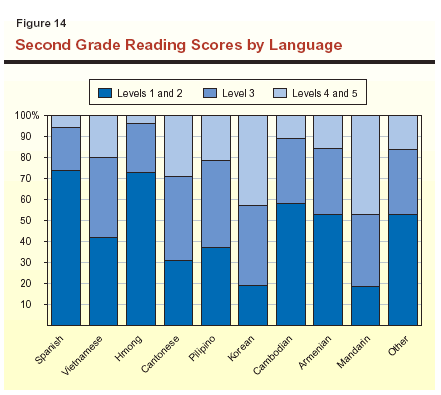
This data suggests that the low 2002 scores on the second grade CELDT tests reflect the fact that certain groups of students are failing to learn reading and writing skills in the very early grades. The rapid progress of Mandarin and other groups, however, indicates that second grade EL students can achieve high levels of reading and writing proficiency in English as measured by the CELDT.
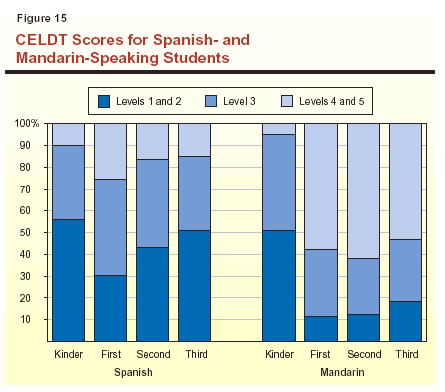
The question is: What factors lead to these very different results? The CELDT data cannot answer this question. A closer look at the data, however, indicates that the higher proficiency groups make very rapid progress in first and second grades, much faster than the lower proficiency groups. Figure 15 shows the different experience of two language groups—Spanish- and Mandarin-speaking students. The CELDT scores of kindergarten students in the two groups are very similar. About half of the students in these groups score in the bottom two levels. The first grade scores, however, signal the beginning of very different paths for the two groups. For Spanish-speaking students, the proportion of first grade students in levels 1 and 2 declines to about 30 percent. In grades 2 and 3, however, CELDT scores for Spanish-speaking EL students fall as the test's language demands increase. By third grade, the scores have fallen almost to the levels this group achieved in kindergarten.
In contrast, scores for Mandarin-speaking students increase dramatically in first grade, when just over 10 percent of students remain in levels 1 and 2. These levels stay almost constant in second and third grades, despite the introduction of reading and writing on the second grade CELDT and the relatively significant increase in third grade proficiency levels.
Figure 15 does not explain why Mandarin students progress more quickly than students who speak Spanish. It merely documents the differences between the two groups. These findings are important because they indicate that EL students can learn English very quickly. Next, we turn to our reclassification simulation to see whether these early experiences have lasting impacts on the transition to fluency of the different language groups.
In this section, we use our simulation model to gauge how the improvement rates of the different language groups would alter our projections of reclassification. We used the same simulation model as described earlier and focused on the reclassification of the initial cohort (the students who began kindergarten in 2001) because we think this cohort allows the clearest picture of the progress of EL students over time. By substituting the gain and loss rates of the different groups, our simulations project how quickly the kindergarten cohort of EL students would be reclassified if the improvement rates for each language group applied to the whole EL population.
Figure 16 shows the results of these simulations. The figure displays the proportion of reclassified students for four language groups: Spanish and Vietnamese (the two largest language groups in the state) and Mandarin and Hmong. It shows, for example, that if the improvement rates for Vietnamese-speaking students applied to the entire EL program, half of the initial cohort would be reclassified in five years—that is, by the fifth grade. This is more than one year sooner than the statewide average. Applying the improvement rates for Mandarin speakers results in even faster reclassification, with almost half being reclassified in 3.6 years, or by third grade.

Figure 17 lists the projected number of years it takes for half of the initial cohort to be reclassified using the improvement rates for all of the language groups discussed in this section. Clearly, there is significant variation in the progress made by the different language groups.
|
Figure 17 Statewide
Reclassification: |
||
|
Language |
Number of
Years |
|
|
Hmong |
7.4 |
|
|
Spanish |
6.7 |
|
|
Cambodian |
6.4 |
|
|
Armenian |
5.0 |
|
|
Pilipino |
5.0 |
|
|
Vietnamese |
5.0 |
|
|
Other |
4.9 |
|
|
Cantonese |
4.7 |
|
|
Korean |
4.0 |
|
|
Mandarin |
3.6 |
|
The results from our simulation are consistent with the pattern of progress shown by students in the first few years of school. Our simulation of Mandarin-speaking students shows large early declines in the size of the cohort—consistent with the rapid gains in proficiency made in kindergarten, first, and second grades. Notice, however, that the size of the Mandarin cohort drops much more quickly than the other groups in grades 4 through 6, which suggests that these rapid gains continue throughout the elementary grades. As Figure 16 illustrates, by sixth grade, the simulation shows 85 percent of Mandarin-speaking students are reclassified, more than the simulation projects for Hmong- and Spanish-speaking students in twelfth grade.
What do these differences mean? The good news is these results suggest that success in acquiring English quickly in the earliest grades is possible. Mandarin students establish proficient oral skills in English in one year. By the beginning of second grade, they appear well on their way to developing a mastery of reading and writing in English. Indeed, these results seem to suggest that that these youngest students can learn English very quickly given the "right" circumstances.
What are the right circumstances? Can they be replicated for all students in the state? It seems likely that these findings reflect a variety of factors. Some of these factors will be outside of the schools' control. For instance, one of these factors may be the extent to which a student's life outside of school involves the use of English. In parts of California, there are communities that use languages other than English for many of life's daily transactions. That is, home life, leisure activities, and shopping may take place in their native language. Our findings on the progress of the major language groups also suggest that some of the right circumstances are influenced significantly by family and community attitudes towards education.
Other variables—such as instructional practices used to educate EL students—are under the control of schools. The CELDT data provides only limited insight into the effectiveness of these variables. In the next section, we discuss the other findings of our analysis of the CELDT data.
In addition to analyzing performance on CELDT based on the native language of students, we reviewed the data by disaggregating test scores based on two other factors that may influence student progress—the type of instructional service and district performance. In this section, we summarize our findings of these analyses. Because of data limitations, however, these analyses were limited in scope and we were unable to draw clear conclusions from our reviews.
Districts employ three types of services to assist EL students in learning English and other academic subjects. Bilingual classes initially provide instruction in the student's primary language. Over time, students learn English and, as their command of English improves, instruction increasingly takes place in English. About 11.5 percent of students were reported as receiving bilingual instruction in 2002.
Students who are not in a bilingual class may receive two types of services. English Language Development (ELD) is instruction to help EL students rapidly learn English. Students may also receive special instruction in academic subjects that is designed for students who are still learning to speak English. Except for those students in bilingual instruction, students receive one or both of these two types of services.
Our analysis of the impact of services was limited by the fact that students often receive different services at different times in their transition to English fluency. Bilingual and ELD instruction are most commonly provided to students in grades 1 through 4. The customized academic instruction is most commonly provided to students in grades 6 through 9. Because there are only two years of CELDT data, it is not possible to track student progress based on the types of services they receive over the years.
Our review of the data, however, revealed two important findings. First, kindergarten students in bilingual programs begin school much less fluent than students receiving other types of services. More than half of kindergarten students in bilingual classes scored in level 1. Only one-quarter of all other EL students in kindergarten scored at the lowest CELDT level.
Second, bilingual students improve more slowly in learning English than other students. By fourth grade, our analysis showed bilingual students about a year behind students who received other services. Since the bilingual model introduces English more slowly than the other services, this finding is not especially surprising. The data, unfortunately, do not allow an assessment of the consequences of this delay on the ultimate goal of achieving English proficiency.
We also reviewed the performance of students at the 20 districts that serve the greatest number of EL students in the state. These districts serve about 45 percent of all EL students in California. Our review identified a fairly large range of performance on the CELDT. Using our simulation model, the improvement rates in the "best" of these 20 districts reduce the amount of time needed to reclassify half of all initial EL students by 1.5 years compared to the state average. At the other end of the spectrum, several districts report student performance that results in 1.5 additional years above the state average to reclassify half of the EL initial population.
These findings are difficult to interpret, however, because these 20 districts serve a unique mix of students. For instance, some of the 20 districts serve mostly Spanish-speaking students, while others serve a large proportion of EL students that speak a native language other than Spanish. Because of the significant difference in the progress of students based on their native language, comparing district performance becomes very complex.
Other district factors that may affect student progress were also noticeable in the CELDT data. Students in large rural districts, for example, appear to make slower progress learning English. Students in large suburban districts appear to make more rapid progress.
Our analysis of the 2002 CELDT data has provided an initial look at how well EL students are faring in their goal of mastering English. Using this data, we project that about half of students who begin kindergarten as an EL student will be reclassified as fluent in a little more than six years. These findings are generally consistent with recent research indicating EL students are typically reclassified in four to seven years.
Student progress as measured by the CELDT results also means that a large proportion of EL students enter middle and high school without being reclassified. Our simulation estimates that more than 40 percent of the original kindergarten cohort will begin seventh grade classified as ELs. In addition, about 60 percent of students who begin school in California after kindergarten will still be classified as ELs in twelfth grade.
This long time period may be endangering the academic progress of EL students if it inhibits students from learning those skills contained in the California Content Standards. Students who are still learning English may be disadvantaged relative to their English-speaking peers in two ways. First, class time spent on basic English skills takes time away from instruction in the grade-level curriculum. Second, if student English skills are insufficient to understand complex topics, students may be unable to grasp more complex concepts or teachers may avoid teaching these higher level portions of the state standards.
Current research on EL programs in California suggests these disadvantages are real. In its second annual report issued last fall, the state-funded evaluation of Proposition 227 documented the lack of consistent focus and implementation of district instructional plans for EL students. In addition, the evaluation found evidence that teachers often have low expectations for the achievement of EL students and may "water down" academic instruction as a result. Almost two-thirds of teachers surveyed for the evaluation expressed the belief that there is not sufficient time to provide the extra instruction in English needed by EL students and also provide a challenging curriculum.
The 2003 STAR results suggest that EL students are not keeping pace with the state's goals for student academic performance. Figure 18 displays the STAR mathematics scores for sixth grade students. We chose sixth grade because it reflects the performance of students at the end of the elementary grades, when state standards call for students to develop language and mathematical skills that are needed for success in the middle and upper grades. In addition, based on our simulation results, only about one-quarter of EL students in the sixth grade begin school in California after kindergarten. Thus, the STAR scores for EL students largely reflect the academic status of students who have attended California schools for their entire academic careers.
|
Figure 18 2003 STARa Scores
in Mathematics |
|||
|
Sixth Grade Students |
|||
|
Subgroup |
Below or
Far |
Basic |
Proficient
or |
|
English learner students |
61% |
29% |
10% |
|
Economically
disadvantaged students |
49 |
32 |
19 |
|
English-only students |
29 |
30 |
41 |
|
|
|||
|
a
Standardized Testing and Reporting. |
|||
Sixth grade EL students generally perform poorly on the STAR mathematics exams. Only 10 percent of sixth grade EL students perform at the "proficient" or "advanced" levels on the STAR mathematics assessment, while 61 percent score in the bottom two performance categories. In comparison, 41 percent of sixth grade students who speak English as their native language performed in the top two tiers on the STAR mathematics test and 29 percent placed in the bottom two ranks. The comparable figures for students from "economically disadvantaged" families are 19 percent and 49 percent, respectively.
Clearly, ELs are performing far below the level desired by the state. In fact, EL students, who make up 24 percent of the sixth grade class, account for about 40 percent of all students who score in the bottom two levels on STAR. This low performance is likely to have long-term consequences, both for students and for the state.
Despite the size and importance of this population, the education system has been unable to help EL students quickly learn English in a manner that allows these students to keep pace with the state's academic standards. We found no instructional service that appears to work dramatically better than others. Our review of the state's largest districts suggest relatively modest differences in the efficacy of local programs.
So, what can the Legislature do? Below, we discuss several steps the Legislature could take to support the local process of improving programs for EL students.
The state and federal governments have created a system of standards, assessment, and accountability to create strong incentives for local educators to find ways to improve student achievement. That system is now in place. With the CELDT and STAR test results, California has, for the first time, good data with which to assess the progress of EL students.
The Legislature should monitor the effectiveness of the accountability programs in improving the achievement of EL students. Recent changes to the accountability system required under the federal No Child Left Behind (NCLB) Act have changed the incentives schools face in improving student achievement. In general, the changes highlight the importance of EL students. Under NCLB, schools must demonstrate that certain subgroups, including EL students, are making progress in academic subjects. This feature will ensure that the performance of this group is a priority for schools. The new federal law also creates an accountability program to ensure that EL students are making progress in learning English. The CELDT will be the primary gauge of this progress under NCLB.
We have concerns in other areas, however. In our Analysis of the 2003-04 Budget Bill, we recommended the Legislature enact a statute to lower the state's definition of proficient student achievement under NCLB. The State Board of Education (SBE) set the proficient level equal to the achievement of the top one-third of students in the state. Our recommendation was based on the concern that, by setting the threshold at such a high level, schools would focus on students who could become proficient in the near future—to the detriment of students who performed in the bottom of the achievement scale. Since many EL students are currently achieving at low levels on STAR, SBE's action may have a disproportionate impact on EL students.
Foster Demonstration Programs. The Legislature also can support the process of local improvement in several ways. The Legislature, for example, could extend greater flexibility to districts over the use of resources to address EL student needs. Perhaps kindergarten for this population should be limited to very small classes—such as a 10 to 1 student-teacher ratio—as a way of providing quickly starting EL students down the path to English fluency. Existing class size reduction funding restrictions do not provide districts with the flexibility to use program funds to support such a demonstration program. The Legislature could provide expanded waiver authority to SBE as a means of helping districts try new approaches to addressing this challenge.
Fund Evaluations. The Legislature should also insist on high quality evaluations of these instructional approaches so that the lessons about how different types of services help different groups of EL students succeed are available to all educators in the state. The current evaluation of Proposition 227 is a good start. More specific feedback on different interventions will be needed, however. Given the complexity of the EL population, it is unlikely that one approach will meet the needs of different groups of students. What works for very young EL students may be very different from the approach that is needed for middle school students who just arrived in the country. Similarly, students who had exposure to English in their native country may benefit from a different mix of services than students with no previous instruction in English.
Finally, we think the state should help districts use the CELDT data for improving local programs. In writing this report, we discussed our findings with several district evaluation and research directors as a way to validate the results of our research. Interestingly, these districts generally had done little analysis of their CELDT data. These districts reported that they used the CELDT data primarily for reclassification and placement purposes and not for student-level diagnostic and program evaluation data.
These district staff reported that the lack of district use of this information is due, in part, to the difficulty of using the data. The state provides little district-specific analysis of the data or a "metric" for understanding how well students fared on the test. In fact, we developed our simulation model because of the difficulties in understanding the data. Without our simulations, we would have found providing a "bottom line" conclusion on the progress of EL students almost impossible.
There are ways to make the data more accessible to districts. We believe the CELDT data is extremely useful and that, to maximize its utility to districts, the state should help them interpret it. This could take a number of forms. At a minimum, the state could provide additional reports that compare district performance on CELDT to the statewide average for similar students. The state could even develop simple software that allows districts to use CELDT and STAR scores to estimate when students are likely to be reclassified.
In reviewing the CELDT data, we identified various problems with the 2002 results that reduce the quality and usefulness of the test. Problems include:
The SDE is aware of these problems and advises that it is taking steps to resolve them. Changes to the test, however, may take several years to implement. The Legislature should monitor the department's progress in improving the CELDT and ensure that the appropriate changes are made as quickly as possible.
This "first look" at the CELDT data reveals significant differences among EL students based on their native language. This data suggests that language instruction is not uniformly effective for all groups. Once the CELDT data becomes part of the state's longitudinal database, we expect researchers will identify other student characteristics—such as age and previous education—that are associated with gains in English proficiency. Rather than focus on one or two models, therefore, we think the Legislature should focus on learning about the mix of services that work for particular groups of EL students.
An effective mix of services for certain groups may look very different than what schools currently provide. Some language groups may require schools to work more closely with parents and communities about the importance of quickly gaining proficiency in English and ways parents can support their children in that process. For instance, to what extent does the fact that, until recently, there was no written form of Hmong slow the development of Hmong-speaking students? How does this affect family support of students? What mix of activities—instructional services, but also outreach or other services to families or communities—might create improved outcomes for this group?
Other factors, such as age and previous educational opportunities seem likely to affect student achievement. A student who arrives in the state from another country at age 14 may need a very different educational program than a kindergarten student who was born in California. Similarly, a 14 year old student who has had significant educational opportunities before coming to the United States may require a different mix of services than another 14 year old who has not attended school for several years. Thousands of older students enter California schools each year, yet there is little solid evidence about what services works best for these groups of students.
The economy of our state will be affected by the education system's ability to help EL students quickly learn English and master the academic skills identified in the state's content standards. One-third of California's kindergarten students are identified as ELs. As the large cohort of "baby boomers" retire from the workforce, employers will look to the product of our K-12 and higher education system for replacement workers. If our schools are not successful with EL students, we may have failed not only the students, but also failed to adequately provide a trained workforce for the state's economy.
There are two basic concepts underlying our simulation model. First, we have used data from a variety of sources as a means of simulating a more dynamic picture of the EL population. This allowed us to better understand how the EL population changes over time as new students arrive in the state and existing students are reclassified (and are removed from the EL totals). The dynamic aspect of our model permitted us to project separately the progress of the initial cohort (those students who start in kindergarten) and new entrants (those who enter California schools in first grade or later). Second, we used the CELDT data to project how quickly students would learn English and be reclassified. These features of our model are described in more detail below.
Creating a Dynamic Model. Our simulation uses CELDT, STAR, and CBEDS data as a way of converting the different "snapshots" of data into a year-to-year change model. The basic idea is simple: we treat the CELDT data as the count of EL students at the beginning of the school year and CBEDS counts as year-end data (CBEDS data on EL students is collected in February). New entrants are added to the CELDT data each year and reclassifications are estimated and subtracted.
Specifically, our model begins with the number of students and the associated CELDT scores for kindergarten students. We used the 2001 scores of the students who are first graders on the 2002 CELDT. Then, for each grade we:
This yielded the total EL students in each grade. These figures were compared to the 2003 CBEDS data on the number of EL students by grade. We adjusted our assumptions slightly in order to roughly achieve the CBEDS total for each grade from the equation described above.
The Growth Model. Our simulation model uses the CELDT growth data as the core input that determines whether student scores increase. Because improvement rates vary so significantly by grade and proficiency level, our model calculates gain and loss rates for each grade and each proficiency level. These rates are then multiplied by the number of students in the appropriate proficiency level in the previous grade.
The number of students in each grade-proficiency level combination results from two basic factors: (1) the number of students who are projected to "leave" that proficiency level (by gaining or losing one or more levels) are subtracted from the prior-year total, and (2) the number of students who "arrive" at that level from a different proficiency level (by gaining or losing one or more levels).
For the mathematically inclined, the number of EL students projected to be in a grade-proficiency level combination is described as follows:
ELg, p= EL(g-1),p* (1-Gg,p-Lg,p) + åp(EL(g-1),(p)* G(g),(p)) + åp(EL(g-1),(p)* L(g),(p))
Where:
The two operations within the summation sign (å) calculate the number of students who arrive at the given proficiency level either by gaining or losing. The summation sign indicates that students can gain or lose more than one proficiency level, and our model accommodates that complexity by adding the number of students who arrive from all other proficiency levels.
We adjusted this standard formula in two major ways. First, reclassified students were subtracted from the grade-level total. Students who scored in level 5 and a proportion of students who scored in level 4 were projected to be reclassified. Students in these two levels who lost at least one level were not eligible for reclassification. The proportion of level 4 students who were reclassified is different for each grade level ranges from 40 percent in the early grades to 25 percent in the high school grades. These figures are based on the difference between the number of students reported in 2001 who were identified as level 4 and the number of students reported in 2002 as scoring a level 4 in 2001.
We also adjusted the gain and loss rates in grades 3, 6, and 9 to adjust for the technical problems with the CELDT. Since the loss rates for proficiency levels 2 and 3 are relatively small, changes to these levels had little impact on the overall results of the simulation. At levels 4 and 5, however, the gain and loss rates are overstated by several factors. Accordingly, we reduced the loss rates in the three grades by 30 percent.
Figure 1 Appendix shows our final simulation result and the CBEDS count of EL students. The simulated estimate of EL students is the same as the "total EL cohort" discussed in the report (2001 kindergarten students plus new entrants).
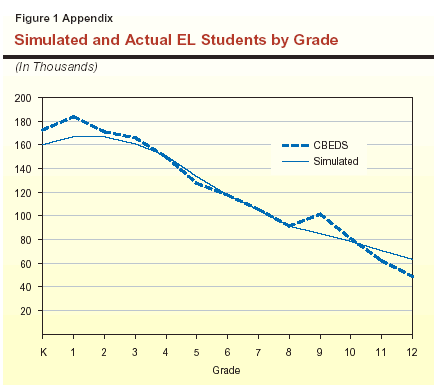
Several factors may cause our model to overestimate the number of EL students being reclassified. Our model cannot, for instance, tell the difference between a student who is reclassified and one who dropped out of school or left the state. In addition, we assumed that students were reclassified fairly rapidly once they reached a level 4 on CELDT—usually within one to two years. Given the STAR scores of EL students, this may prove to be too optimistic.
On the other hand, other factors may lead our model to underestimate the number of EL students reclassified each year. We are unable to account for the larger number of students in kindergarten and first grade in the CBEDS data as compared to the CELDT data. Unfortunately, the way SDE maintains the kindergarten data on CELDT renders it not comparable to the data for the rest of the EL population. In addition, we have no direct measure of the number of "new entrants" to first grade—that is, students who were new to California schools in first grade—because the STAR data begins with the second grade. As a result, we may have significantly undercounted this group.
This report was prepared by Paul Warren. The Legislative Analyst's Office (LAO) is a nonpartisan office
which provides fiscal and policy information and advice to the
Legislature. To request publications call (916) 445-4656. This report and others, as well as an E-mail
subscription service, are available on the LAO's Internet site at
www.lao.ca.gov. The LAO is located at 925 L Street, Suite 1000,
Sacramento, CA 95814.
Acknowledgments
LAO Publications
Return to LAO Home Page