
January 2006
There has been much interest recently both by the Governor and the Legislature in investing in the state’s infrastructure and using bonds to do so. This reflects both the state’s large current and future infrastructure needs and the key role that bonds will inevitably have to play in financing them. This brief answers a number of common questions related to using bonds to fund infrastructure. These questions include the overall nature of the infrastructure needs facing California, the different options for paying for them, and key issues and concerns associated with using more bonds.
What Are California’s Infrastructure Needs?
What Does California’s Infrastructure Include?
As a large and highly industrialized state, California’s past investments in and current inventory of public infrastructure easily totals in the hundreds of billions of dollars. As shown in Figure 1, the state’s major infrastructure includes a diverse array of capital facilities associated with such program areas as water resources, transportation, higher education, natural resources, criminal justice, health services, and general government office space.
In addition to the state government infrastructure investments shown in Figure 1, the state has historically provided funds for local public infrastructure. These include such areas as K-12 school construction, community college construction, local streets and roads, local parks, wastewater treatment, flood control, and jails.
|
Figure 1 Major State Infrastructure |
|
|
Program Area |
Major State Infrastructure |
|
Water Resources |
· 34 lakes and reservoirs. · 25 dams. · 20 pumping plants. · 4 pumping-generating plants. · 5 hydroelectric power plants. · 701 miles of canals and pipelines—State Water Project. · 1,595 miles of levees and 55 flood control structures in the Central Valley. |
|
Transportation |
· 50,000 lane miles of highways and 12,000 bridges. · 9 toll bridges. · 11 million square feet of Department of Transportation offices and shops. · 209 Department of Motor Vehicles offices. · 141 California Highway Patrol offices. |
|
Higher Education |
· 10 University of California campuses. · 23 California State University campuses. |
|
Natural Resources |
· 287 park units containing 1.5 million acres and 4,000 miles of trails. · 228 forest fire stations, 39 conservation camps, and 13 air attack bases. · 16 agricultural inspection stations. |
|
Criminal Justice |
· 33 prisons and 43 correctional conservation camps. · 8 youthful offender institutions. · 11 crime laboratories. |
|
Health Services |
· 5 mental health hospitals comprising over 4 million square feet of facilities and 2,300 acres. · 5 developmental centers comprising over 5 million square feet of facilities and over 2,000 acres. · 2 public health laboratory facilities. |
|
General state office space |
· 8.5 million square feet of state-owned office space. · 16.6 million square feet of leased office space. |
Given the Past Infrastructure Investment, Why Should the State Spend Even More on Infrastructure?
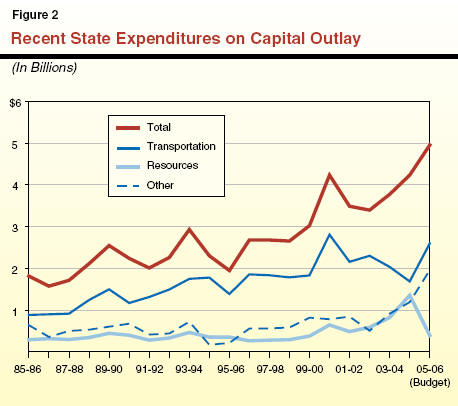
Most of the state’s infrastructure investment was made in the 1950s through the 1970s, particularly in such areas as higher education, transportation, and water management. As shown in Figure 2, the state has continued to spend increasing amounts on infrastructure in the past 20 years.
However, the state still faces the need for substantial infrastructure investments in a wide variety of program areas. Future investments are necessary in order to:
As shown in Figure 3, California’s per-capita state infrastructure spending dropped off throughout the 1970s, after hitting a high in the late 1960s. This trend has reversed since 1981 and the state’s per-capita spending on infrastructure has been on a steady increase. Nonetheless, the state still faces significant infrastructure needs.
The Department of Transportation, for example, estimates that the state highway system needs about $30 billion in rehabilitation and reconstruction (including design and engineering support) from 2002 through 2012. In May 2005, a research group that ranks the nation’s road conditions using federally collected data found that out of the ten urban areas nationwide (with at least 500,000 people) that have the highest proportion of rough roads, five are in California. These areas are San Jose, Los Angeles, San Francisco-Oakland, San Diego, and Sacramento. Travel demand has increased in California such that in 2000, over 1,800 miles of the state’s urban freeways were congested, compared to around 1,000 miles in 1987. The congestion resulted in about 530,000 vehicle-hours of delay to motorists, in turn wasting billions of dollars in terms of time and fuel used by drivers each year. These costs are borne by both businesses and individuals.
Other examples of a general deterioration of the state’s infrastructure are found in the resources area. These include the state parks system which has a backlog of over $900 million in deferred maintenance, which adversely impacts the quality of the experience of state park visitors. As another example, the Department of Water Resources (DWR) has estimated that it would cost roughly between $1 billion and $1.5 billion to rehabilitate aging levees in the state’s Central Valley flood control system just to perform at the level for which they were originally designed-a standard that would not necessarily provide adequate protection for today’s urban areas.
What Is the Most Recent State Infrastructure Spending Proposal?
To identify and plan for the state’s infrastructure investment, Chapter 606, Statutes of 1999 (AB 1473, Hertzberg), requires the Governor to submit annually, in January, a comprehensive five-year infrastructure development plan for state agencies, K-12 schools, and higher education institutions, along with a proposal for its funding. The Governor did submit such a plan in both 2002 and 2003, but has not done so since. The 2003 plan identified $54 billion in infrastructure spending for the period from 2003-04 through 2007-08. As shown in Figure 4, about half of the expenditures ($28.5 billion) called for in the plan were for transportation, and nearly 30 percent for K-12 schools and higher education facilities improvement.
|
Figure 4 Components of 2003 California Five-Year Infrastructure Plan |
|
|
2003‑04 Through 2007‑08 (In Billions) |
|
|
|
|
|
Transportation |
$28.5 |
|
K-12 schools |
10.4 |
|
Higher education |
5.4 |
|
Supply, quality, and management of water |
3.1 |
|
Seismic retrofit of office buildings and facilities replacement |
1.8 |
|
Natural resources and environmental protection |
1.7 |
|
Public safety |
1.1 |
|
Trial court facilities |
1.0 |
|
Other |
1.2 |
|
Total |
$54.2 |
It is our understanding that state agencies and departments have developed updated information on the infrastructure needs in their respective areas, and that this information has been submitted to the administration. Thus, hopefully an updated plan will be forthcoming soon that effectively identifies, prioritizes, and proposes funding for the state’s infrastructure expenditures for 2006-07 through 2010-11. If the same rate of expenditure growth proposed in the 2003 plan holds, the plan’s proposals would be in the range of $60 billion to $75 billion for the next five years.
How Did the State Propose to Fund the 2003 Plan?
The 2003 plan proposed to fund the identified expenditures of $54 billion with a combination of funding sources. About 54 percent of the amount was from a mix of state and federal transportation funds for transportation improvements. About 36 percent was from general obligation and lease-revenue bond funds. The remaining investments were from direct appropriations from the General Fund and other special fund sources.
How Comprehensive Is the State Infrastructure Plan?
The state plan focuses on state government-owned facilities, with a few exceptions. The three main exceptions are K-12 schools, community colleges, and local transportation systems. However, there are other elements of statewide infrastructure needs that are not included or understated.
First, a number of state infrastructure investment requirements have not been included, among them:
Second, the infrastructure plan generally excludes local infrastructure investment requirements. As mentioned previously, the state has traditionally provided financial assistance as a matter of policy for various types of local infrastructure. As one example of local infrastructure requirements, the State Water Resources Control Board has estimated the total projected funding requirements for local water quality infrastructure (such as for wastewater treatment) to be in the several tens of billions of dollars through 2025. Similarly, the plan excludes the state’s funding assistance for local transit (mainly rail) facilities which in recent years has averaged a couple of hundreds of millions of dollars annually.
Third, it should be noted that information is lacking to allow for a comprehensive estimate of the investment requirements for some types of infrastructure. For example, while there is ample evidence of deterioration in the Central Valley flood control system, there is no program at the local, state, or federal level that assesses the structural integrity of the flood control projects on an ongoing basis. Lacking a comprehensive assessment of the infrastructure’s structural integrity (which would cost upwards of $100 million, according to DWR), the DWR is only able to provide a very rough and necessarily incomplete estimate of the system’s investment requirements.
Furthermore, as required by law, the state plan identifies capital improvements to be funded over a five-year period. It does not include any additional improvements that would be required beyond that time horizon. For instance, the 2003 plan called for $1 billion in trial court facility improvements through 2007-08. This level would likely be more than sufficient to fund court improvements in the next couple of years because of the slow pace of transferring trial court facilities to the state. However, over the next ten years, funding of several more billions of dollars would potentially be needed as the state takes over the construction and management of hundreds of trial court facilities, as required under current law.
How Should the State Determine What Infrastructure Investment Requirements to Fund and the Timing of Such Investments?
We think the state should take a systematic approach in funding and developing the needed infrastructure. This approach involves a number of steps, including:
What Are State Versus Local Responsibilities in Funding Infrastructure? There are many reasonable answers to this question. Given the magnitude of state infrastructure demands, a key consideration is how much of the state’s financial capacity should be devoted to meet local needs and priorities versus those with statewide implications. Applying this approach to transportation, for example, could mean that the state would be responsible for developing and managing the statewide network of highways, while regional and local governments would be responsible for the improvement of arterial roads and local streets. Similarly, only those parks that have statewide significance in terms of their natural or cultural resources would be a state responsibility, while local government would have primary responsibility for meeting local demands for recreational opportunities.
Are There Policy Changes That Can Be Made to Reduce the Demand for Infrastructure Improvements? The amount of investment spending identified in the statewide plan generally assumed programs and services are provided in the future in the same manner as they are today. These future spending requirements could be reduced if the state modifies the way some services are provided. For instance, more intensive use of university facilities (such as year-round operations, as we have recommended) would reduce the number of new facilities needed to accommodate enrollment growth. Other policy changes such as an increase in gas tax would potentially reduce the amount of miles people drive, alleviating the growth in congestion. As another example, the Legislature could enact legislation to more closely tie local land use decision making to flood risks and the related fiscal consequences of those decisions. Such an approach would potentially reduce the demand for state-funded flood control infrastructure.
What Criteria Should Be Considered in Setting Funding Priorities for Infrastructure Investment? Once the Legislature has determined which infrastructure funding requirements are appropriately state responsibilities, we think it should set state funding priorities based on a clear set of criteria. The Legislature could consider using the following criteria:
Are There Other Factors That Should Be Taken Into Consideration in Determining the Amount and Timing of Infrastructure Investment? Yes, there are practical, operational considerations that should be taken into account. These practical factors could limit the state’s capability to deliver a large increase in capital improvement projects within a short time frame. For instance, many infrastructure projects require several years to design and construct. To the extent that projects are not yet identified, it would take some time before they can be designed and engineered for construction. Additionally, getting these projects plan-ready within a short period of time may require a large increase in state staff or contracting out, something departments may not be able to do effectively. Similarly, a large increase in construction work could result in higher project construction cost due to the increased demand on labor, material, and equipment.
What Options Exist for Financing New Infrastructure?
What Are the Key Issues Involved?
In deciding how to fund infrastructure, the state has two basic decisions to make, depending on the project involved:
First, what basic financial approach should be used-direct appropriations (that is, pay-as-you go), renting and/or leasing (when it is possible to use facilities that are owned by private parties or other governmental entities, such as buildings), and borrowing (primarily by issuing bonds)?
Second, what source of funds should be used to ultimately pay for the infrastructure (regardless of the financial approach used)-the state’s general revenue base, specific earmarked taxes, user fees, sales of existing physical assets or income streams, or other alternatives?
What Have We Used in the Past To Fund Infrastructure?
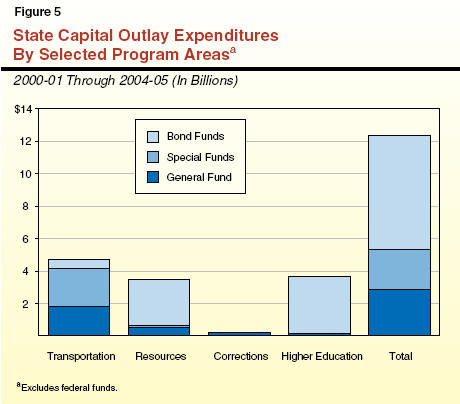
To varying degrees, all of the above financing approaches and funding sources have been used to fund infrastructure in the past. As regards funding sources, for example, transportation has relied heavily on its dedicated annual stream of gas tax revenues, certain water projects have been paid for from water fees collected from water users, and other capital outlays have been paid for out of the state’s general tax revenues, including income and sales taxes. As regards funding approaches, some infrastructure has been acquired through direct appropriations while the state has also rented and leased certain facilities, such as office space. However, the majority of all state infrastructure spending has been financed by borrowing, using long-term bonds paid for by the General Fund. Figure 5 shows the role that bond funding has played in state capital outlay expenditures for selected major program areas. (It also should be noted that large amounts of state bonds have been used to fund local K-12 school facilities. However, these are not included as state capital outlay spending.)
How Should California Fund Its Current Infrastructure Needs?
In theory, we could fund all of our infrastructure needs upfront through the direct appropriations of taxes and fees under a pay-as-you-go approach without any borrowing. However, this is not realistic, given the large volume of our infrastructure needs, the importance of having this infrastructure available within the foreseeable future, and the substantial magnitude of tax and fee increases that direct appropriations would necessitate. Thus, although direct appropriations and renting/leasing may be able to play an important role in addressing our infrastructure needs, borrowing through the use of bond financing will have to play a significant role.
Basic Information About Bond Financing
What Exactly Is Bond Financing?
Bond financing is a type of long-term borrowing that state and local governments frequently use to raise money, primarily for long-lived infrastructure assets. They obtain this money by selling bonds to investors. In exchange, they promise to repay this money, with interest, according to specified schedules. The interest the state has to pay investors on the bonds it issues for public infrastructure is exempt from their federal and state income taxes, which makes the state’s interest cost on the bonds less than it otherwise would be.
Why Are Bonds Used?
As noted above, the state often uses bonds to finance its major capital outlay projects such as educational facilities, prisons, parks, water projects, and office buildings. This is done mainly because these facilities provide services over many years, their large dollar costs can be difficult to pay for all at once, and different generations of taxpayers benefit from the facilities. The latter fact offers a rationale for spreading the costs of infrastructure over time, as bond repayments allow you to do.
What Types of Bonds Does the State Sell?
The state traditionally has sold two main types of bonds. These are:
General Fund-Supported Bonds. These are paid off from the state’s General Fund, which is largely supported by tax revenues. These bonds take two forms:
Traditional Revenue Bonds. These also finance capital infrastructure projects, but are not supported by the General Fund. Rather, they are paid off from a designated revenue stream-usually generated by the projects they finance-such as bridge tolls, parking garage fees, or water contract payments. These bonds normally do not require voter approval.
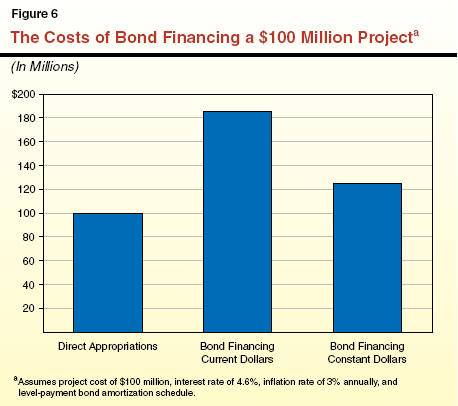
Doesn’t Using Bonds Cost More?
Funding infrastructure using bonds is definitely more costly than direct appropriations due to the interest that has to be paid. This extra cost depends primarily on the interest rate and the time period over which the bonds have to be repaid. For example, the most recent general obligation bonds sold for an interest rate of about 4.6 percent and will be paid off over a 30-year period. Figure 6 shows that their total cost will be about $185 million for each $100 million borrowed-$100 million for repaying the amount borrowed and $85 million for interest. However, because the repayment is spread over the entire 30-year period, the cost after adjusting for inflation is considerably less-about $1.25 million for each $1 million borrowed.
So, Given This Extra Cost, Why Use Bonds?
It makes sense to pay the extra cost of using bonds when this expense is outweighed by the benefits of having projects in place sooner than otherwise would be possible. This criterion is often met in the case of capital outlays, given the large costs of infrastructure projects, the many years over which they provide services, and the substantial increases in taxes or other charges that would be needed to pay for them up front. The need to use more bonds, however, does raise a number of other key questions as we discuss below.
What Is the State’s Current Debt Situation?
How Much Do We Already Owe?
Figure 7 shows that as of November 1, 2005, the state had almost $53 billion of General Fund debt outstanding. This includes about $42 billion in bond debt that it has used to fund infrastructure (close to $35 billion in general obligation bonds and nearly $8 billion of lease-revenue bonds). The figure also shows the debt outstanding from the deficit-financing bonds issued in 2004 (currently $10.4 billion).
|
Figure 7 Summary of State of California Outstanding and Unissued General Fund Debt, By Program Area and Type |
||
|
As of November 1, 2005 (In Billions) |
||
|
|
Outstanding Debt |
Unissued Debta |
|
General Obligation Bonds |
|
|
|
Corrections |
$1.1 |
—b |
|
Health |
— |
$0.8 |
|
Higher Education |
4.7 |
3.7 |
|
Housing |
— |
2.1 |
|
K-12 Education |
22.0 |
12.3 |
|
Resources |
1.7 |
0.8 |
|
State Administration |
0.3 |
0.2 |
|
Stem Cells |
— |
3.0 |
|
Transportation |
1.8 |
0.2 |
|
Water |
2.8 |
6.5 |
|
Local Governmentc |
0.1 |
0.3 |
|
Other |
—d |
— |
|
Total, General Obligation Bonds |
$34.5 |
$29.9 |
|
Lease-Revenue Bonds |
$7.8 |
$3.2 |
|
Deficit-Financing Bondse |
10.4 |
4.1 |
|
Totals |
$52.6 |
$37.2 |
|
|
||
|
Source: California State Treasurer |
||
|
a Includes $19.4 billion in authorized commercial paper, of which $1.2 billion has been issued. These funds are used to initiate projects until bonds are sold. |
||
|
b Includes $10 million in unissued bonds. |
||
|
c Includes bonds for reading and literacy improvement and library construction. |
||
|
d Includes $4 million in bonds for hazardous substance clean up and senior citizens’ centers. |
||
|
e These are self-liquidating general obligation bonds secured by a one-quarter cent share of the local sales and use tax. However, in exchange, the General Fund pays an equivalent amount in increased Proposition 98 funding to schools. |
||
Are There Any Unused Infrastructure-Related Bond Authorizations Still Left?
Figure 7 also shows that the state has not yet sold about $30 billion of authorized general obligation bonds, either because the projects involved have not yet been started or those in progress have not yet reached their major construction phase. It should be noted that in some program areas, such as K-12 education, substantial sums of authorized but unissued bonds have been committed for specific projects, and thus bond issuance will be occurring in the near future.
What Does Our Debt Cost Us Each Year?
In our recently released report entitled California’s Fiscal Outlook (November 2005), we estimated that General Fund debt payments for general obligation and lease-revenue bonds will total about $3.9 billion in 2005-06 and $4.3 billion in 2006-07 for infrastructure-related purposes. If the annual costs of the deficit-financing bonds are included, total debt-service costs will be about $5.1 billion in 2005-06 and $5.8 billion in 2006-07.
Where Are Our Debt-Service Expenses Heading?
The future path of General Fund debt-service costs will be the net result of two opposing factors. First, debt service on already-issued bonds will be steadily declining in future years as these securities are paid off. Second, there will be new debt service to pay as additional bond sales occur. The net effect of these two factors will be a likely increase in General Fund debt-service costs. In our fiscal outlook report, we calculated that if the volumes and maturity structures of future annual bond sales are similar to recent experience, and bond interest rates track our economic forecast, General Fund debt-service costs would reach somewhat over $6 billion by 2010-11.
How Much More Debt Can We Afford?
There is no accepted “rule” for how much debt is “too much” or how many bonds the state can “afford.” Rather, this depends on policy choices about how much of our revenues to devote to the funding of infrastructure versus other state spending priorities, and also what level of taxes and user charges is appropriate for the funding of infrastructure. In addition, it depends on the state’s ability to sell its bonds at reasonable interest rates in the financial marketplace.
What About the State’s Low Bond Ratings-Aren’t They a Problem?
California’s credit ratings currently are scored as A, A2, and A, respectively, by the nation’s three major rating agencies-Standard & Poor’s, Moody’s Investors Service, and Fitch Ratings. Although these all are investment-grade ratings and reflect recent improvement, they remain the lowest of all states rated by these agencies. The state’s current low ratings are principally related to factors other than the amount of debt outstanding-most notably, its continued projected imbalance between revenues and expenditures and the ongoing structural deficit this implies. It would appear that the main adverse implication of the low ratings thus far has been the additional interest premium the state has had to pay on its new bond issues compared to what AAA-rated states pay. For example, according to the California State Treasurer’s estimate in his 2005 Debt Affordability Report, the state’s 20-year bonds were trading at about 0.22 percentage points of interest more than the AAA average as of early August 2005.
Isn’t the State’s Debt-Service Ratio a Good Guideline?
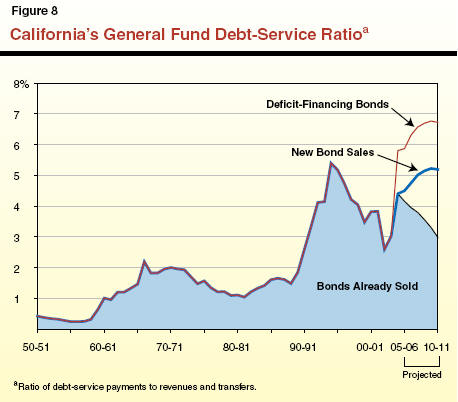
Some parties in the investment community look to the debt-service ratio (that is, the DSR, or ratio of annual debt-service costs to yearly revenues) as a general guideline regarding whether the state has become overextended in terms of its debt burden. In past years, for example, some concerns have been voiced when a state’s DSR began to exceed 5 percent or 6 percent. Figure 8 shows that California’s DSR increased in the early 1990s and peaked at somewhat over 5 percent in the middle of the decade. In our above-cited fiscal outlook report we estimated that the DSR will stand at about 4.5 percent for 2005-06 and 4.8 percent for 2006-07 for infrastructure-type bonds, or 5.9 percent and 6.3 percent respectively if the deficit-financing bonds are included. Thus, even though the ratio has risen recently, it is still in the general range of what many would consider acceptable.
Other indicators of debt capacity or affordability that sometimes have been used are the ratio of state debt outstanding to statewide personal income, and per-capita debt outstanding. A representative of a national bond rating firm recently was quoted regarding California’s ratio of outstanding debt to personal income-namely, that the state’s current ratio of below 5 percent was well short of the 7 percent level that would start to be of concern. This conclusion is similar to the DSR indicator noted above.
In terms of how California’s debt levels compare to other parts of the country, the California State Treasurer described them as consistent with those of other large states in his above-cited 2005 Debt Affordability Report. The report also indicates that while the state’s ratios of net tax-supported debt to personal income and debt per capita rank well above the medians for the ten most populous states, several states are above California, and California’s position partly reflects its deficit-related borrowing versus investments in capital projects.
Does This Mean Affordability Is Not a Major Issue?
Even if the state is able to market additional debt at reasonable interest rates, it still needs to be able to make room in its budget to pay the added debt service. This is because for any given level of state revenues, each new dollar of debt service comes at the expense of a dollar that could be allocated to another program area, whether this be education, health, social services, or tax relief. Thus, the “affordability” of more bonds has to be considered not just in terms of their initial marketability, but also whether their debt service can be accommodated both on a near-term and long-term cumulative basis within the state’s budget, given other spending priorities. This is a particularly important consideration, given that the costs of using bonds are largely delayed, and each $1 billion of new bonds sold currently adds close to $65 million annually for as long as 30 years to state debt-service costs.
But What If the DSR Does Become a Potential Issue?
Figure 8 also shows that the state’s DSR would increase from its current level if the recent annual volumes and maturity structures of bond sales continued for several years. In addition, beyond the effects of this on the DSR, should the state decide to be even more aggressive in authorizing and selling bonds to address its infrastructure needs, it certainly is possible that its DSR could rise to a level that might lead to some investor concerns, higher interest costs, and possibly some challenges in marketing the bonds. This might occur even if the state’s bond ratings held constant or improved, due to the need to attract a sufficient number of new bond investors to absorb the added debt. Under these conditions, it would be particularly important that the state mitigate the situation by being committed to a well-thought-out, multiyear capital infrastructure plan capable of convincing investors that the plan made financial sense, would be effectively carried out, and would eventually pay dividends in terms of benefiting California’s economy. Thus, it is critical that the state have an effective capital outlay game plan and implementation process in order to accommodate a substantial amount of new bond debt without adverse financial consequences.
What About Using Other Types of Bonds?
As noted earlier, bonds can take a variety of forms other than General Fund general obligation bonds and lease-revenue bonds, in terms of how they are secured and the ultimate source of their required debt-service payments. For example, the state currently uses traditional revenue bonds to fund seismic bridge safety projects. These revenue bonds are funded by bridge tolls paid by motorists who use the bridges.
As another variation, general obligation bonds can be supported by funding sources other than the General Fund, such as user fees, or by a combination of funding sources of which the General Fund is one source. User fees may be an appropriate source to fully or partially fund bonds in cases where there is a clearly identified group of parties that benefit directly from the bond expenditures. This is an application of the “beneficiary pays” funding principle that can be used to guide the allocation of a project’s costs among funding sources. For instance, property owners who benefit directly from flood control infrastructure could pay a fee that would be used to partially repay bonds issued for flood management purposes. A number of infrastructure funding proposals under recent consideration by the Legislature and the administration have included a user fee component.
Legislative Considerations
In developing its strategies to address the financing of state infrastructure using bonds, we believe the state should have a multiyear capital infrastructure plan in place and an effective process to implement it. There are several issues that the Legislature should consider, given the above discussion. These are summarized in Figure 9.
|
Figure 9 Financing of State Infrastructure— Issues to Consider |
|
|
|
» Determine What and How Much to Fund And When Financing Is Needed |
|
What are state versus local responsibilities in funding specific types of infrastructure? |
|
How do different policy actions affect the level of infrastructure investment needed? |
|
What are the improvements needed within a specified time horizon? |
|
What criteria should be used to prioritize funding among various types of state infrastructure projects? |
|
What are the practical factors that would affect the state’s capability to make capital outlay improvements within the time period being contemplated? |
|
» Determine Financing Approaches And Funding Sources |
|
What general approach should be used to fund specific individual capital outlay projects—pay-as-you-go financing using direct appropriations, renting or leasing capital facilities, or borrowing through the use of bonds? |
|
What should be the ultimate source of funding for infrastructure investments, regardless of the financing approach used—general taxes, selective taxes, user charges, or some other alternative? |
This report was prepared by
Jon David
Vasché,
Dana Curry,
Mark Newton,
and Robert Ingenito. The Legislative Analyst's Office (LAO) is a nonpartisan office
which provides fiscal and policy information and advice to the
Legislature. To request publications call (916) 445-4656. This report and others, as well as an E-mail
subscription service, are available on the LAO's Internet site at
www.lao.ca.gov. The LAO is located at 925 L Street, Suite 1000,
Sacramento, CA 95814.
Acknowledgments
LAO Publications
Return to LAO Home Page