February 2007
Frequently Asked Questions About Bond Financing
Our office recently issued
Implementing the 2006 Bond Package
(we also released a
video summary of that report), aimed at helping the Legislature in overseeing the spending of the $43 billion in bond funds just approved by the voters. This report is intended to complement the report on the 2006 bond package. It answers basic questions about the state’s use of bonds to finance its infrastructure.
What Exactly Is Bond Financing?
Bond financing is a type of long-term borrowing that state and local governments frequently use to raise money, primarily for long-lived infrastructure assets. They obtain this money by selling bonds to investors. In exchange, they promise to repay this money, with interest, according to specified schedules. The interest the state has to pay investors on the bonds it issues for public infrastructure is exempt from their federal and state income taxes, which makes the state’s interest cost on the bonds less than it otherwise would be.
Why Are Bonds Used?
As noted above, the state often uses bonds to finance its major capital outlay projects such as educational facilities, prisons, parks, water projects, and office buildings. This is done mainly because these facilities provide services over many years, their large dollar costs can be difficult to pay for all at once, and different generations of taxpayers benefit from the facilities. The latter fact offers a rationale for spreading the costs of infrastructure over time, as bond repayments allow you to do. In contrast, funds to operate facilities or deliver services to the public are paid out of current revenues.
What Types of Bonds Does the State Sell?
The state traditionally has sold two main types of bonds. These are:
General Fund-Supported Bonds. These are paid off from the state’s General Fund, which is largely supported by tax revenues. These bonds take two forms:
-
The majority are general obligation (GO) bonds. These must be approved by the voters and their repayment is guaranteed by the state’s general taxing power. Most of these are directly paid for by the General Fund, although there are some that are paid off from designated revenue streams like mortgage or water contract payments and for which the General Fund only provides back-up security. In addition, the state recently issued GO bonds to help finance its budget deficit. Although their debt service is paid for by an earmarked one-quarter cent local sales tax, the General Fund ends up paying this amount through its increased share of Proposition 98 educational funding.
-
The second type is lease-revenue bonds, which are authorized by the Legislature. These are paid off from lease payments (primarily financed by the General Fund) by state agencies using the facilities they finance. (Historically, most of these bonds have been used to finance higher education facilities, prisons, and state office building.) These bonds do not require voter approval and are not guaranteed. As a result, they have somewhat higher interest costs than GO bonds. Figure 1 compares key features of lease-revenue and GO bonds.
|
Figure 1
Comparisons Between
State General Obligation (GO) Bonds and Lease-Revenue Bonds |
|
Feature or Characteristic |
General Obligation Bonds |
Lease-Revenue Bonds |
|
Legislative authorization needed
for program |
2/3 vote in each house |
Majority vote in each house |
|
Voter approval required? |
Yes—majority vote of the electorate |
No |
|
Pledged security to bondholders |
Full faith and credit of the state
(its taxing power) |
Annual debt-service appropriations,
plus available bond reserve funds |
|
Interest rate on bonds |
Lowest possible |
Recently has been averaging roughly
0.2 percentage point above GO bond rate |
|
Underwriting process |
Usually competitive bidding, but
negotiated sales allowed if cheaper |
Some competitive bidding, but most
sales to date have been negotiated |
|
Need for reserve fund to effectively market bonds? |
No |
Yes |
|
Need to purchase property and
liability insurance? |
No |
Yes |
|
Amount of bonds required |
Based on project costs, plus small
amount (less than 1 percent) for issuance costs |
Bond volume upsized, typically by
roughly 15 percent over project costs, to cover
underwriting fees, debt-service during construction
period, other issuance costs, and reserve fund |
|
Type of amortization schedule currently used |
Typically level total payment
(principal and interest) over 30 years |
Typically level total payment
(principal and interest) over 25 years |
|
Real cost of bond financing |
Lowest possible (typically about $1.20 to $1.30 per
$1 of capital costs |
Typically 10 percent to 15 percent above GO bond
cost, depending on circumstances |
Traditional Revenue Bonds. These also finance capital infrastructure projects, but are not supported by the General Fund. Rather, they are paid off from a designated revenue stream-usually generated by the projects they finance-such as bridge tolls, parking garage fees, or water contract payments. These bonds normally do not require voter approval.
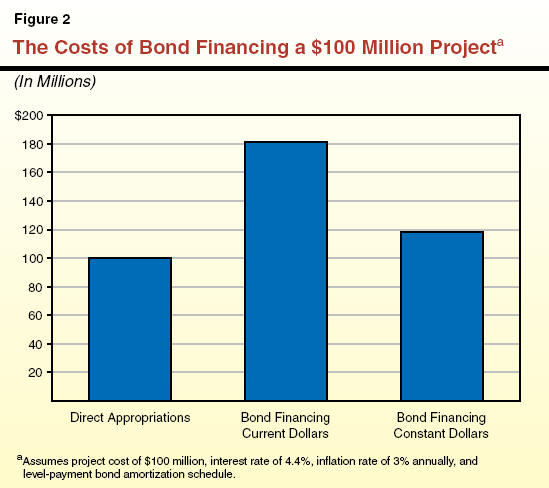
Doesn’t Using Bonds Cost More?
Funding infrastructure using bonds is definitely more costly than direct appropriations due to the interest that has to be paid. This extra cost depends primarily on the interest rate and the time period over which the bonds have to be repaid. For example, the most recent GO bonds sold for an interest rate of about 4.4 percent and will be paid off over a 30-year period. Figure 2 shows that under these assumptions, the total cost of a bond will be about $180 million for each $100 million borrowed-$100 million for repaying the amount borrowed and $80 million for interest. However, because the repayment is spread over the entire 30-year period, the cost after adjusting for inflation is considerably less-about $1.2 million for each $1 million borrowed.
So, Given This Extra Cost, Why Use Bonds?
It makes sense to pay the extra cost of using bonds when this expense is outweighed by the benefits of having projects in place sooner than otherwise would be possible. This criterion is often met in the case of capital outlays, given the large costs of infrastructure projects, the many years over which they provide services, and the substantial increases in taxes or other charges that would be needed to pay for them up front. Proposals to use more bonds, however, do raise a number of other key questions as we discuss below.
How Much Do
We Already Owe?
Figure 3 shows that as of January 1, 2007, the state had $37.7 billion of GO bond debt outstanding. (“Outstanding” debt is the total amount of bonds that have been sold less any that have been paid off.) Almost two-thirds of this debt is in K-12 education. In addition to the $37.7 billion in GO bond debt, the state has nearly $8 billion outstanding in lease-revenue bond debt and $9.6 billion in deficit-financing bond debt.
|
Figure 3
Summary of California General Obligation Bonds By Program Area and Type |
|
As of January 1, 2007 (In Billions) |
|
|
Outstanding Debt |
Unissued Bonds |
|
Pre-November 2006 Authorizations |
November 2006 Authorizations |
Total Authorizations |
|
Corrections |
$1.0 |
—a |
— |
— |
|
Health |
0.1 |
$0.7 |
— |
$0.7 |
|
Higher Education |
5.0 |
3.2 |
$3.1 |
6.3 |
|
Housing |
— |
2.1 |
2.9 |
5.0 |
|
K-12 Education |
23.2 |
8.6 |
7.3 |
16.0 |
|
Local Governmentb |
0.1 |
0.2 |
— |
0.2 |
|
Resources and Flood Control |
4.9 |
6.8 |
9.5 |
16.3 |
|
State Administration |
0.2 |
0.2 |
— |
0.2 |
|
Stem Cells |
— |
3.0 |
— |
3.0 |
|
Transportation |
3.2 |
0.4 |
19.9 |
20.3 |
|
Total, General Obligation Bonds |
$37.7 |
$25.2 |
$42.7 |
$67.9 |
|
|
|
Source: California State Treasurer |
|
a
$10 million in unissued bonds. |
|
b
Includes bonds for reading and literacy improvement
and library construction. |
|
Detail may not add due to
rounding. |
How Many Bonds Have Not Been Sold?
Figure 3 also shows that the state has not yet sold $25.2 billion of GO bonds authorized prior to November 2006. About 70 percent of this amount, however, is already committed to specific projects, largely to education. In addition, the voters just approved $42.7 billion in new bonds last November.
Why Are There So Many Unissued Bonds?
There are several reasons why the state typically has a large amount of authorized, but-as-yet unsold bonds:
-
One reason is that when voters are periodically asked to approve bonds, the volume authorized is often expected to last for a number of years.
-
A second reason is that there often is a time lag between when bonds are authorized and funds are needed for their projects. This can be because the projects involved have not yet been started, or those in progress have not yet reached construction. This, in turn, depends largely on such factors as how long it takes to acquire any necessary property, prepare any required environmental documents, develop project plans and working drawings, agree to contracts, make arrangements for actual construction to begin, and make progress on the projects themselves.
- A third factor reflects the fact that short-term loans are typically made to bond programs (using commercial paper or the state’s Pooled Money Investment Account) to bridge the gap between when programs need funds and when the state sells the bonds.
Once it is time to sell bonds, they are marketed by the State Treasurer, generally through a competitive-bid auction process. This is where the bidder (often a consortium of financial firms) offering the lowest interest rate gets to purchase the bonds, generally for resale to the investment community. Typically, GO bonds from several different programs will be bundled together in a single sale.
What Does Our Debt Cost Us Each Year?
In our recently released report
Implementing the 2006 Bond Package
(January 2007), we estimated that General Fund debt payments for already authorized GO and lease-revenue bonds for infrastructure-related purposes will total about $4.7 billion in 2007-08, rising to a peak of $7.5 billion in 2014-15. (These numbers would increase further if bonds proposed by the Governor for future years are approved and sold. Figure 4 summarizes the Governor’s proposal.) If the annual costs of the deficit-financing bonds are included, total debt-service costs will be about $7.8 billion in 2007-08 and $8.3 billion in 2008-09.
|
Figure 4
Governor’s Proposed Bond Package—by Bond Type |
|
(In Billions) |
|
|
General Obligation |
|
|
|
|
|
2008 Ballot |
2010 Ballot |
Lease Revenue |
Revenue |
Total |
|
K-12 Education |
$6.5 |
$5.1 |
— |
— |
$11.6 |
|
Higher Education |
7.2 |
4.3 |
$0.1 |
— |
11.6 |
|
Corrections |
— |
— |
9.5 |
— |
9.5 |
|
Flood control/ water supply |
4.0 |
— |
— |
$2.0 |
6.0 |
|
Courts |
2.0 |
— |
— |
— |
2.0 |
|
Other |
0.3 |
— |
2.3 |
— |
2.6 |
|
Totals |
$20.0 |
$9.4 |
$11.9 |
$2.0 |
$43.3 |
How Much More Debt Can We Afford?
There is no accepted “rule” for how much debt is “too much” or how many bonds the state can “afford.” Rather, this depends on policy choices about how much of our revenues to devote to the funding of infrastructure versus other state spending priorities, and also what level of taxes and user charges is appropriate for the funding of infrastructure. In addition, it depends on the state’s ability to sell its bonds at reasonable interest rates in the financial marketplace.
What About the State’s Low Bond Ratings-Aren’t They a Problem?
California’s credit ratings currently are scored as A+, A1, and A+, respectively, by the nation’s three major rating agencies-Standard & Poor’s, Moody’s Investors Service, and Fitch Ratings. (State ratings typically range from a low of “BBB” up to the best rating of “AAA.”) Although these all are investment-grade ratings and reflect recent improvement, they remain nearly the lowest of all states rated by these agencies. The state’s current low ratings are principally related to factors other than the amount of debt outstanding-most notably, the continued imbalance between state revenues and expenditures and the ongoing structural deficit this implies. (Figure 5, shows the history of the state’s credit ratings by the three agencies. California was last rated a AAA state in the early 1990s.) It would appear that the main adverse implication of the low ratings thus far has been the additional interest premium the state has had to pay on its new bond issues compared to what AAA-rated states pay. In recent years, this premium has been somewhat over 0.2 percentage points. Put another way, for every $1 billion in new debt sold, the added interest cost to the state is roughly $1.5 million annually over the life of the bonds.
|
Figure 5
History of California's General Obligation Bond Credit Ratings |
|
Standard & Poor's |
|
Moody's Investors Service |
|
Fitch |
|
Date |
Rating |
|
Date |
Rating |
|
Date |
Rating |
|
May-06 |
A+ |
|
May-06 |
A1 |
|
June-06 |
A+ |
|
August-04 |
A |
|
July-05 |
A2 |
|
July-05 |
A |
|
July-03 |
BBB |
|
May-04 |
A3 |
|
September-04 |
A- |
|
December-02 |
A |
|
December-03 |
Baa1 |
|
December-03 |
BBB |
|
April-01 |
A+ |
|
August-03 |
A3 |
|
December-02 |
A |
|
September-00 |
AA |
|
February-03 |
A2 |
|
February-00 |
AA |
|
August-99 |
AA- |
|
November-01 |
A1 |
|
October-97 |
AA- |
|
July-96 |
A+ |
|
May-01 |
Aa3 |
|
February-96 |
A+ |
|
July-94 |
A |
|
September-00 |
Aa2 |
|
July-94 |
A |
|
July-92 |
A+ |
|
October-98 |
Aa3 |
|
September-92 |
AA |
|
December-91 |
AA |
|
July-94 |
A1 |
|
February-92 |
AA+ |
|
July-86 |
AAA |
|
July-92 |
Aa |
|
July-86 |
AAA |
|
February-85 |
AA+ |
|
February-92 |
Aa1 |
|
October-82 |
AA |
|
January-83 |
AA |
|
October-89 |
Aaa |
|
Prior to 1982 |
A |
|
January-80 |
AA+ |
|
April-80 |
Aa |
|
|
|
|
May-68 |
AAA |
|
September-72 |
Aaa |
|
|
|
|
|
|
|
November-40 |
Aa |
|
|
|
|
|
|
|
January-38 |
A |
|
|
|
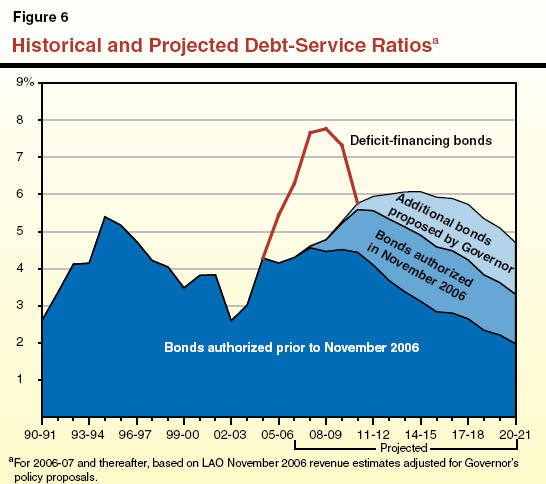
Isn’t the State’s Debt-Service Ratio a Good Guideline?
Some parties in the investment community look to the debt-service ratio (that is, the DSR, or ratio of annual debt-service costs to yearly revenues) as a general guideline regarding the state’s debt burden. Figure 6 shows that California’s DSR increased in the early 1990s and peaked at somewhat over 5 percent in the middle of the decade. It currently stands at 4.3 percent.
Other indicators of debt capacity or affordability that sometimes have been used are the ratio of state debt outstanding to statewide personal income, and per-capita debt outstanding. California also appears to be in an acceptable range using these measures. This conclusion is similar to that for the DSR indicator noted above.
In terms of how California’s debt levels compare to other parts of the country, the California State Treasurer described them as consistent with those of other large states in his
2006 Debt Affordability Report. The report also indicates that while the state’s ratios of tax-supported debt to personal income and debt per capita rank well above the medians for the ten most populous states, several states are above California, and California’s position partly reflects its deficit-related borrowing as opposed to the use of bonds for capital projects.
Does This Mean Affordability
Is Not a Major Issue?
Even if the state is able to market additional debt at reasonable interest rates, it still needs to be able to make room in its budget to pay the added debt service. This is because for any given level of state revenues, each new dollar of debt service comes at the expense of a dollar that could be allocated to another program area, whether this be education, health, social services, or tax relief. Thus, the “affordability” of more bonds has to be considered not just in terms of their initial marketability, but also whether their debt service can be accommodated both on a near- and long-term cumulative basis within the state’s budget, given other spending priorities. This is a particularly important consideration, given that the costs of using bonds are largely delayed, and each $1 billion of new bonds sold at 5 percent interest adds close to $65 million annually for as long as 30 years to state debt-service costs.
What Will the 2006 Bond Package
Mean for the DSR?
Figure 6 also shows that the state’s DSR would increase from its current level as bonds authorized in the 2006 package are sold. We estimate that the DSR would peak at 5.6 percent in 2010-11. At that time, the 2006 bond package will be adding about 1.2 percent to the DSR.
What Will the Governor’s New Bond Proposals Mean?
Including the new GO and lease-revenue bonds proposed by the Governor, the DSR would peak at 6.1 percent in 2014-15. At that time, the new bond proposal would add another 1.2 percent to the DSR. To put this into perspective, this additional debt service is roughly equivalent to total state spending proposed for the In-Home Supportive Services program in 2007-08.
So What’s the Bottom Line?
It certainly is possible that the state’s DSR could rise to a level that might lead to some investor concerns, higher interest costs, and possibly some challenges in marketing the bonds. This might occur even if the state’s bond ratings held constant or improved, due to the need to attract a sufficient number of new bond investors to absorb the added debt. Under these conditions, it would be particularly important that the state mitigate the situation by being committed to a well-thought-out, multiyear capital infrastructure plan capable of convincing investors that the plan made financial sense, would be effectively carried out, and would eventually pay dividends in terms of benefiting California’s economy. Thus, it is critical that the state have an effective capital outlay game plan and implementation process in order to accommodate a substantial amount of new bond debt without adverse financial consequences.
|
Acknowledgments This report was prepared by
David Vasché and reviewed by
Robert Ingenito, with the assistance of many others in
the office. The Legislative Analyst's Office (LAO) is a nonpartisan office which provides
fiscal and policy information and advice to the Legislature.
|
LAO Publications To request publications call (916) 445-4656.
This report and others, as well as an E-mail
subscription service
, are available on the LAO's Internet site at www.lao.ca.gov. The LAO is
located at 925 L Street, Suite 1000, Sacramento, CA 95814.
|
Return to LAO Home Page