April, 2007
California's Tax System: A Primer
Contents
Introduction
California has over 37 million residents; is the eighth largest economy in the world; exhibits tremendous economic and demographic variation; and has substantial and diverse demands in such areas as education, health care, and infrastructure. It is not surprising, therefore, that its public sector is one of the largest and most diversified in the world. Like most governments, California relies primarily on taxes to fund the public services that it provides to its individuals and businesses. California’s state and local governments raise well over $200 billion annually in own-source revenues to provide public services, with roughly 60 percent of this from taxes. (Own-source revenues includes levies raised direcly by government—such as taxes and fees—but excludes payments from other levels of governments.)
What are the different types of taxes upon which California relies? What is their relative importance, and how have they evolved over time? How large a “burden” do these taxes impose on Californians, both in absolute terms and compared to other states, and how is this burden distributed? What types of policy issues are associated with the current tax structure, especially in light of our changing economy? The purpose of this primer is to address these and other tax-related questions, so as to aid policymakers and other interested parties in their tax-related deliberations and decision making.
The primer is organized into the following six sections: (1) overview of California’s tax structure, (2) the personal income tax, (3) the sales and use tax, (4) the corporation tax, (5) other state taxes, and (6) local taxes. Also, a glossary of common tax terms is included in the back of the booklet.
Overview of California’s Tax System
Taxes Pay for Most of California’s Public Services
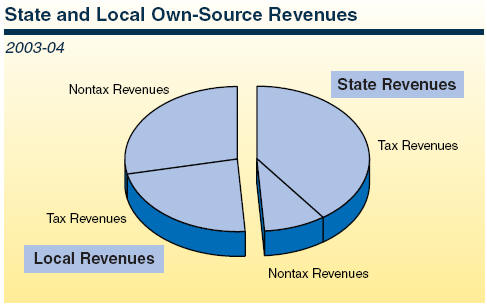
Taxes play a vital role in California’s state and local fiscal system. In 2003-04 (the last year for which comprehensive data are available), $268 billion was spent annually to provide public services to California’s residents and businesses. Of this total, $54 billion came from the federal government while the remaining $214 billion was financed through own-source state and local government revenues. Of own-source revenues, roughly one-half was raised by the state and the other one-half by localities. Taxes account for 80 percent of the state share of own-source revenues and about 45 percent of the local share.
What Taxes Are Levied in California?
State Taxes
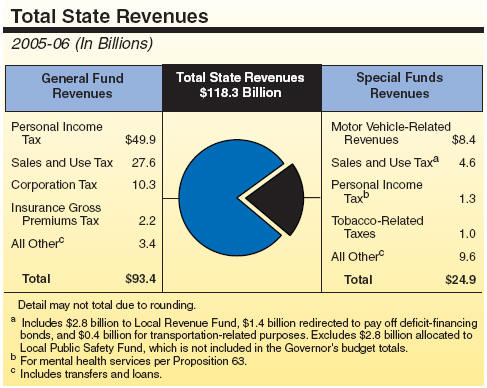
Approximately 85 percent of the state’s own-source revenue comes from four sources: the personal income tax (PIT), the sales and use tax (SUT), the corporation tax (CT), and major motor vehicle-related levies.
- The first three largely finance the state’s General Fund, which supports about 80 percent of all state spending. By far the largest single tax is the PIT, accounting for over one-half of all General Fund revenues.
- The remaining 20 percent of state revenues is from special funds for designated purposes, including over one-third for transportation funded by motor vehicle-related levies. Certain income and tobacco-related taxes go into special funds to support health programs, and certain sales taxes are used to support targeted local government activities.
Included among other state taxes are the gross premiums insurance tax, alcoholic beverage taxes, cigarette and tobacco taxes, lottery tax, various fuel-related levies, and disability and unemployment insurance taxes. The latter two taxes are directed into trust funds, and thus, do not constitute general state revenues.
Local Taxes
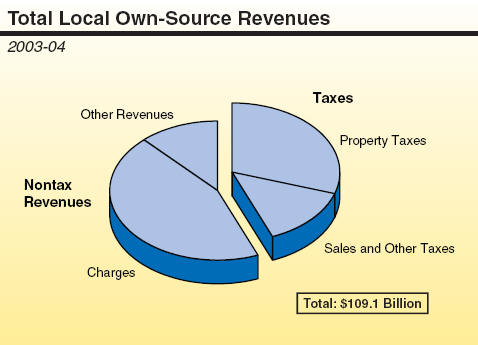
In contrast to the state, less than one-half of local own-source revenues come from locally imposed taxes, including the property tax, sales tax, business license tax, and utility users’ tax. (These levies are discussed later in this primer.) Instead, most local governments, with the exception of schools, are heavily reliant on user fees and other charges for services.
In addition to the local own-source revenues shown in the figure, local governments rely heavily on intergovernmental aid. In some cases, this aid consists of taxes that the state imposes on behalf of local governments, including a one-half cent sales tax for public safety programs, a one-half cent sales tax for health and social services programs, and the vehicle license fee (VLF). In other cases, the state provides local governments general state revenues to pay for local programs, particularly K-14 education and health and social services programs.
How Has the Tax Structure Changed Over Time?
The basic elements of California’s current state tax system were put in place in the late 1920s and early 1930s. Prior to that time, state revenues were raised by an insurance tax, utility tax, and fuel tax. The severe fiscal disruptions that accompanied the depression, however, led to the adoption of both the PIT and state SUT. Since that time, California’s tax system has remained largely intact, although a number of important statutory and constitutional modifications have occurred. One of the most important of these changes was the adoption of Proposition 13 in 1978, which resulted in a dramatic reduction in property taxes and altered state-local fiscal relations. (The box
below describes the differences between constitutional provisions—such as Proposition 13—and statutory provisions.)
|
Selected Major
California Tax Law Changes Since Proposition 13 |
|
|
|
1982—Proposition 6 (eliminated inheritance
tax; adopted “pickup” tax). |
|
1982—Proposition 7 (indexed PIT tax brackets
for inflation). |
|
1987—Federal conformity (adopted, for
example, net operating loss deductions, Subchapter S option, and alternative
minimum tax [AMT]). |
|
1988—Proposition 99 (imposed 25 cent per-pack
surtax on cigarettes and other tobacco products for health programs). |
|
1991—Double-weighting of sales factor
(amended corporate income tax apportionment
formula). |
|
1991—Temporary high-income tax rates (imposed
PIT rates of 10 percent and 11 percent, which lapsed in 1996). |
|
1992—Proposition 163 (repealed the “snack
tax”). |
|
1992—Proposition 172 (imposed half-cent SUT
rate and dedicated revenues to local public safety programs). |
|
1996—CT reduction (franchise rate to
8.84 percent from 9.3 percent; AMT rate from 7 percent to 6.65 percent). |
|
1996—Proposition 218 (limited local fiscal
authority; required majority vote to approve general
tax increases). |
|
1998—Proposition 10 (imposed a 50 cent
per-pack excise tax on cigarettes and other tobacco products for health
programs). |
|
2001—VLF reduced to 0.65 percent (from its
historical 2 percent level). |
|
2002—Proposition 42 (redirected gasoline
sales taxes to transportation). |
|
2004—Proposition 1A (restricted state’s
ability to reduce or reallocate local tax revenues). |
|
2004—Proposition 63 (imposed additional
high-income PIT rate to fund mental health
services). |
How Tax Laws Are Adopted and Modified
California’s tax provisions are of two general types—statutory and constitutional.
Statutory Tax Provisions. These provisions typically reside in the California Revenue and Taxation Code and account for the vast majority of tax laws. They can be enacted either by the Legislature directly (as most are) or by a vote of the public (placed on the ballot either by the Legislature or through a voter-sponsored initiative). For measures that result in a net increase in tax revenues, a two-thirds vote of the Legislature is required; otherwise, a simple majority vote suffices. Typically, statutory tax provisions approved by the voters can be modified only through a subsequent vote of the people.
Constitutional Tax Provisions. Amending the California Constitution, including establishing or modifying constitutional state tax provisions, requires voter approval. As with statutory tax measures, constitutional tax measures may be put on the ballot either by the Legislature directly or by a voter-sponsored initiative. As with statutory provisions adopted by voters, changes to constitutional tax provisions require a subsequent vote of the people. Examples of constitutional tax provisions are Proposition 13 (involving local property taxation), PIT indexing, insurance taxation, and Propositions 10 and 99 (involving cigarette taxation).
|
California’s Tax Burden
The term “tax burden” describes how significant the taxes are that individuals and businesses pay. Tax burden measures can facilitate comparisons among states.
There are a variety of issues involving how the tax burden should be defined and measured (see box
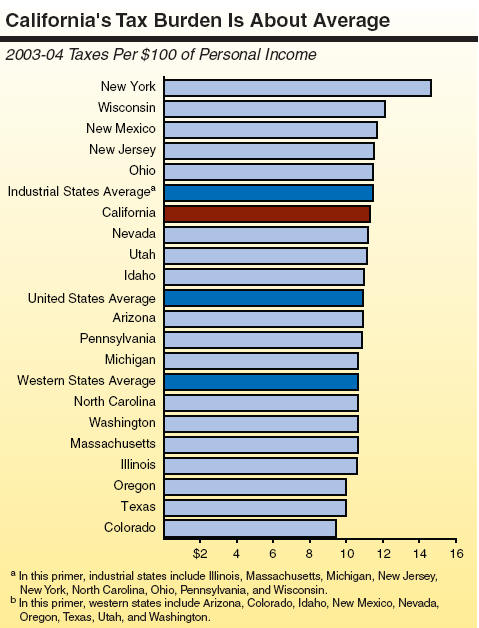
below). However, probably the single most commonly used measure of the tax burden is taxes paid as a percent of personal income. According to this measure, California’s aggregate tax burden is about average when compared to other states.
Issues Regarding the Tax Burden
Terminology. One basic tax burden issue involves using the term burden when referring to taxes generally. Taxes are used to provide public services that taxpayers value—such as education, parks, roads, and public safety. Without taxes, citizens either would have to pay directly for acquiring such services or forgo them altogether. Some economists argue that because such taxes simply measure the expenditures taxpayers incur to buy public services, a more neutral term—such as “tax price”—should be used as an alternative.
Measurement Issues. A second basic issue is how best to measure the tax burden. Among the most common approaches are taxes per capita, taxes as a percent of personal income, taxes as a percent of total statewide output, and taxes per worker. Another approach is to establish a set of representative taxpayer characteristics for individuals and businesses and compare what their taxes would be in different states. Each of these different measures has advantages and disadvantages in portraying a state’s tax burden relative to other states.
Tax Incidence. A third issue is that tax burden calculations say nothing about exactly who ultimately pays the taxes, including: (1) how the tax burden is distributed by income level, and (2) how it is eventually shared by consumers, workers, and business owners once the effects of taxes on prices and wages are considered.
Expenditure Impacts. A last issue involves how to interpret and use tax burden information. To the extent that a “high” or “low” tax burden simply measures amounts spent for public services, it says nothing about whether taxes are “too high” or “too low” in the minds of taxpayers. Thus, tax burden comparisons do not address the expenditure side, including how such expenditures benefit different income groups or regions.
|
- In 2003-04, the most recent year for which comprehensive interstate data are available, California’s state and local taxes per $100 of personal income totaled $11.30.
- This was slightly above the national average for
all states ($11.04). It was also somewhat above the average for other
western states ($10.66), but below that for other industrial states
($11.46).
How Does California’s Tax System Rate?
There are a number of specific criteria that economists commonly cite as elements of well-designed tax systems.
- Broad Bases With Low Rates. Is the tax base sufficiently diverse so as to allow for the financing of public services to be shared broadly, with tax rates kept to a minimum?
- Economic Neutrality. Is the revenue system relatively neutral in terms of its influence on economic decision making by individuals and businesses?
- Equity. Are taxpayers in similar situations treated similarly, and are the differing tax burdens placed on taxpayers with differing characteristics fair?
- Administrative Feasibility. Can the system be administered in an efficient, effective, and uniform manner, with minimal compliance and enforcement costs and a high degree of voluntary compliance?
- Adequacy, Stability, and Reliability. Can the system routinely be counted on to generate sufficient revenues to fund agreed-upon public services?
Although California’s system scores relatively well in many areas, substantial challenges exist in other areas. As discussed in later sections, these challenges include capturing the “new economy’s” increased reliance on services and E-commerce, addressing local revenue issues, and ensuring that tax expenditures are effective and efficient uses of taxpayers’ money.
Personal Income Tax
Overview of the Personal Income Tax (PIT)
The PIT was established in 1935 and is the state’s single largest revenue source. The PIT:
- Raised over $50 billion in 2005-06, accounting for roughly 40 percent of all state revenues and one-half of General Fund revenues.
- Is levied on both residents and nonresidents, with the latter paying taxes on income derived only from California sources. There were over 14 million PIT returns filed in 2004, including 680,000 from part-year residents and nonresidents.
- Applies not only to individuals, but also to sole proprietorships, partnerships, estates, and trusts. In addition, the income “passed through” to individuals by Subchapter S corporations and certain other entities is subject to PIT taxation.
- Is applied to all sources of income unless specifically excluded, including wages and salaries, interest, dividends, business-related income, and capital gains.
Filing Status and Tax Rates
Taxes are levied based on the filing status of the taxpayer. California has five filing statuses: single, married filing a separate return, married filing a joint return, surviving spouse, and head of household. There are six tax brackets for each filing status, with marginal tax rates ranging from 1 percent to 9.3 percent, depending on a taxpayer’s income level. Also, an additional 1 percent tax is levied on the portion of taxpayers’ incomes in excess of $1 million, with the proceeds used for mental health services.
|
California Tax Schedule for Married Couples Filing Joint Returns |
|
2006 Tax Year |
|
If Taxable Income Is: |
|
Computed Tax Is:a |
|
Over |
But Not Over |
|
Base Amount |
Plus |
Of Amount Over |
|
$0 |
$13,244 |
|
$0 |
1.0% |
$0 |
|
13,244 |
31,396 |
|
132 |
2.0 |
13,244 |
|
31,396 |
49,552 |
|
495 |
4.0 |
31,396 |
|
49,552 |
68,788 |
|
1,222 |
6.0 |
49,552 |
|
68,788 |
86,934 |
|
2,376 |
8.0 |
68,788 |
|
86,934 |
— |
|
3,828 |
9.3 |
86,934 |
|
|
|
a
Taxpayers pay an additional 1 percent on the portion
of their incomes in excess of $1 million. Thus,
taxpayers with incomes of over $1 million have a
marginal tax rate of 10.3 percent. |
Key PIT Features
The PIT’s key features include:
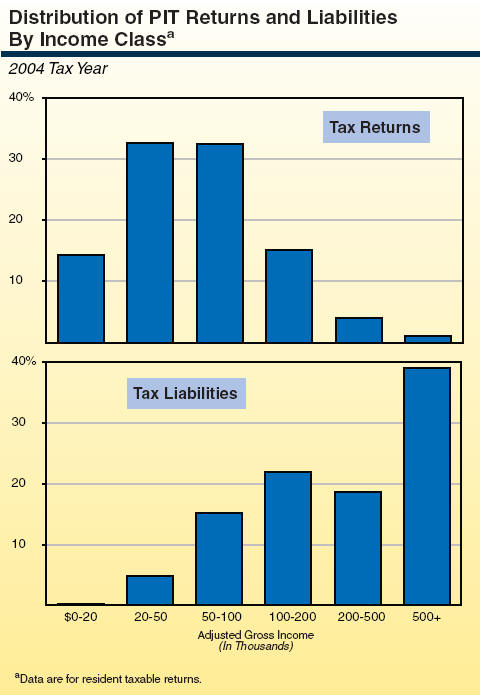
- Single taxpayers account for 43 percent of total returns filed but only 24 percent of tax liabilities, whereas married-filing-joint taxpayers constitute 40 percent of total tax returns but over 70 percent of tax liabilities.
- The PIT’s tax brackets and certain credits and deductions are indexed annually to offset the impacts of inflation.
- There are approximately 85 PIT-related tax expenditure programs (TEPs), the sum of which totaled about $30 billion in 2006-07. These TEPs include a variety of income exemptions, income exclusions, tax deductions, and tax credits (the largest of which are shown in the next figure).
- A 7 percent Alternative Minimum Tax (AMT) is levied under certain circumstances. Its purpose is to restrict tax benefits from so-called tax preferences, including deductions and credits. In 2004, the AMT resulted in raising taxes for over 10,000 taxpayers by $46 million.
|
Largest PIT Tax
Expenditure Programs |
|
2006-07 (In Millions) |
|
Program |
Type
of Provision |
Revenue Reduction |
|
Mortgage Interest Expenses |
Deduction |
$4,885 |
|
Employer Contributions to Pension Plans |
Exclusion/Exemption |
4,450 |
|
Employer Contributions to Accident and Health Plans |
Exclusion/Exemption |
3,975 |
|
Basis Step-Up on Inherited Property |
Exclusion/Exemption |
3,030 |
|
Capital Gains on the Sale of a Principal Residence |
Exclusion/Exemption |
1,770 |
|
Dependent Exemption |
Credit |
1,650 |
|
Charitable Contributions |
Deduction |
1,600 |
|
Real Property Tax Deduction |
Deduction |
1,315 |
|
Exclusion of Benefits Provided Under Cafeteria Plans |
Exclusion/Exemption |
1,220 |
|
Exclusion of Proceeds From Life Insurance and
Annuity Contracts |
Exclusion/Exemption |
1,165 |
|
Social Security and Railroad Retirement Benefits |
Exclusion/Exemption |
1,000 |
|
Personal Exemption |
Exclusion/Exemption |
1,000 |
|
Standard Deduction |
Deduction |
1,000 |
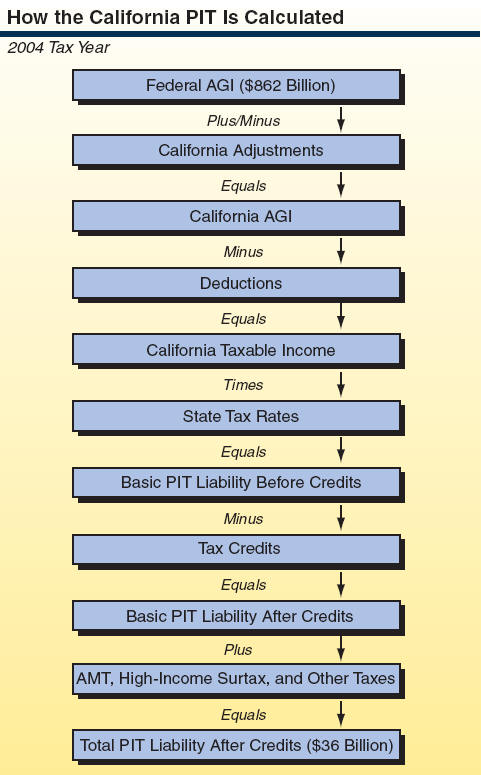
California’s PIT Closely Follows the Federal PIT
The computation of California PIT liabilities is based on federal adjusted gross income (AGI). In turn, federal AGI equals total income from all sources less exempt or excluded income, plus certain federal adjustments. California generally conforms to federal PIT law except in specific circumstances. The procedure for calculating California’s PIT is shown in the nearby figure.
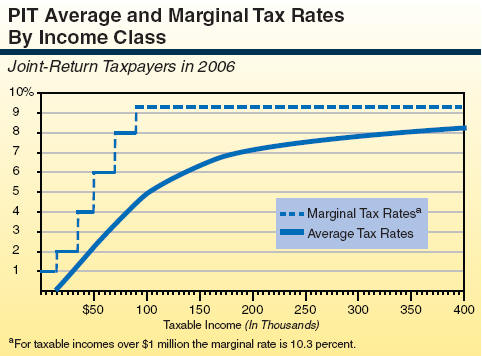
California’s PIT Is Progressive
California’s PIT is a progressive tax, meaning that the “last” dollar of income earned is subject to increasingly higher marginal tax rates as income increases until the last bracket is reached. As a result, the share of one’s income paid in taxes generally rises with income. Put another way, the average tax rate rises with income, causing taxpayers with higher taxable incomes to pay a proportionately larger share of their income in taxes than those with lower incomes. For example, a married couple filing jointly with no dependents would have an effective tax rate of 2.1 percent based on taxable income of $50,000, versus an effective rate of 4.9 percent based on $100,000 of taxable income.
In 2004:
Wages and Salaries Account for Most PIT Revenues
Of the different types of income subject to the PIT, wages and salaries constitute by far the largest portion. In 2004:
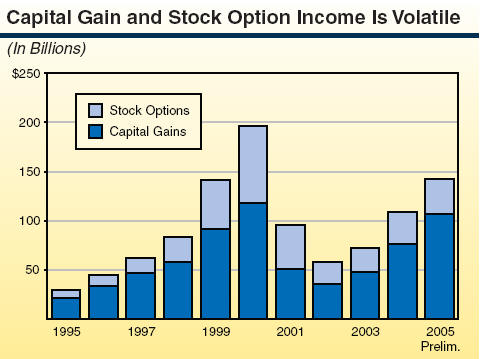
Capital Gains/Stock Options Important But Volatile Sources of PIT Revenues
Although wages and salaries continue to account for the majority of PIT revenues, the share attributable to capital gains and stock options has become significant in recent years.
The importance of these sources in generating PIT revenues reflects two main factors:
- First, their dollar amount is much more than in the mid-1990s and before.
- Capital gains and stock options accrue disproportion-ately to high-income taxpayers and, thus, are taxed at higher-than-average marginal tax rates.
The increased role of capital gains also has brought with it certain revenue-related challenges. Most important, it has made the PIT inherently more volatile and difficult to forecast than previously. This is because capital gains themselves are highly variable, due to (1) their dependency on the volatile stock market and housing sectors and (2) the fact that most stock-related capital gains are not taxed in the year of accrual and can remain unrealized for many years. Stock options, too, are quite volatile and dependent on stock market performance.
Comparisons to Other States
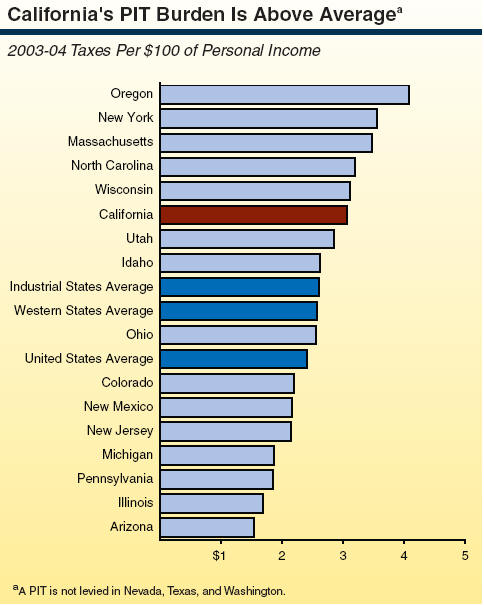
A PIT is imposed by 43 states and the District of Columbia. The PIT-related interstate comparisons of greatest interest involve overall tax burden and relative marginal tax rates. With regard to the former, the state’s overall PIT tax burden—as measured by tax liabilities per $100 of personal income in 2003-04—is $3.07 (see following figure). This is above the average of both all states ($2.40) and other industrial and western states ($2.61 and $2.57, respectively).
The latter issue of marginal tax rates is of special interest because high-marginal rates may in some situations result in discouraging work. California’s highest marginal rate of 10.3 percent is above that of other western and industrial states. Its lowest marginal tax rate, however, is less than most other states. Of course, the fact that California’s total burden for all state and local taxes combined is about average means that its higher PIT burden is offset by a lower combined burden for its other taxes.
Important PIT Policy Issues
Some key PIT-related policy issues facing policymakers include:
- Marginal Rate Structure. Should California’s PIT marginal tax rates be reduced and the cost be financed through base broadening?
- Federal Conformity. Should California more fully conform to federal PIT law in areas where it currently differs, such as capital gains tax rates, depreciation, certain credits, and net operating losses?
- Broad-Based Simplification. Should California move towards a more simplified PIT system with fewer special provisions for particular groups/businesses?
- Targeted Simplification. Alternatively, should California leave its basic system intact, but focus on simplifications in those PIT areas where the greatest complexities for taxpayers lie, such as the AMT?
- Tax Expenditure Programs. Are there certain PIT-related TEPs that are ineffective and inefficient, and therefore in need of elimination or modification?
- Reliance on the PIT. Has California become overly dependent on the PIT, given that it now accounts for over one-half of the state’s General Fund total?
- Volatility. Given that the PIT is a somewhat volatile revenue source, should this be addressed and what are the trade-offs between revenue volatility and robustness?
|
Comparison of PIT Marginal Tax Rates |
|
Single Taxpayers, 2006 |
|
State |
Starting Marginal Tax Rate |
Applies to Taxable Income Up to |
Top Marginal Tax Rate |
Applies to Taxable Income Beginning |
|
California |
1.00% |
$6,622 |
10.30% |
$1,000,000 |
|
Oregon |
5.00 |
2,750 |
9.00 |
6,850 |
|
New Jersey |
1.40 |
20,000 |
8.97 |
500,000 |
|
North Carolina |
6.00 |
12,750 |
8.25 |
120,000 |
|
Idaho |
1.60 |
1,198 |
7.80 |
23,963 |
|
Utah |
2.30 |
863 |
7.00 |
4,313 |
|
Ohio |
0.68 |
5,000 |
6.87 |
200,000 |
|
New York |
4.00 |
8,000 |
6.85 |
20,000 |
|
Wisconsin |
4.60 |
9,160 |
6.75 |
137,410 |
|
New Mexico |
1.70 |
5,500 |
5.30 |
16,000 |
|
Massachusetts |
5.30 |
all |
5.30 |
all |
|
Arizona |
2.73 |
10,000 |
4.79 |
150,000 |
|
Colorado |
4.63 |
all |
4.63 |
all |
|
Michigan |
3.90 |
all |
3.90 |
all |
|
Pennsylvania |
3.07 |
all |
3.07 |
all |
|
Illinois |
3.00 |
all |
3.00 |
all |
Sales and Use Tax
Overview of the Sales and Use Tax (SUT)
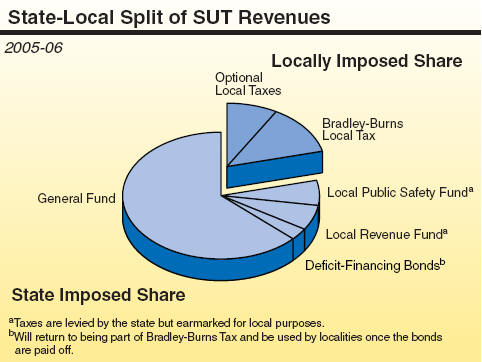
The SUT is the second largest tax levied in California and is assessed at both the state and local levels. California is one of 45 states that levy a SUT with only Alaska, Delaware, Montana, New Hampshire, and Oregon not levying one. California’s state-level SUT was established in the 1930s and its local SUT in 1955. In 2005-06, California SUT revenues totaled about $44 billion, with about 70 percent going to the state and 30 percent to localities.
The Sales Tax Versus the Use Tax
California’s SUT has two distinct components—the sales tax and the use tax.
- The sales tax, begun in 1933, is imposed on retailers selling tangible personal property in California. It is collected and paid by registered sellers and constitutes the bulk of revenues raised by the SUT.
- The use tax, begun in 1935, is imposed on the users of a product purchased out of state but brought into California for use (such as a mail order item from another state). Although required to be paid by purchasers, this remittance generally occurs only in certain circumstances (due to enforcement issues).
Taxed Items
The SUT is a tax on final sales of tangible personal property, such as clothing, household furnishings, appliances, and motor vehicles. Intermediate sales of goods (say, from a wholesaler to a retailer) are not taxed and, in addition, certain individual items are specifically exempted from SUT. The largest of these tax expenditure programs (TEPs) involve utilities and home-consumed food. Services are largely exempt from taxation, although California does tax a few. Services are indirectly taxed, however, to the extent that their cost is incorporated into the final prices of tangible goods. For those states that do directly tax services, they vary greatly in terms of what services their SUTs apply to, with personal services more likely to be taxed than professional services. For example, 23 states tax laundry services, while only 5 tax accounting services.
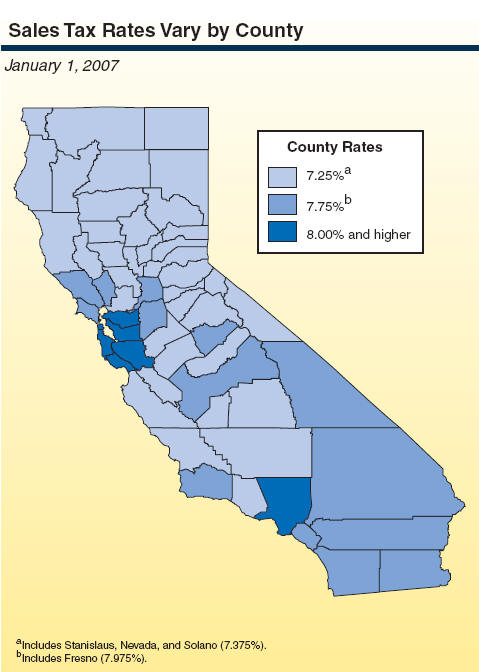
SUT Rates Vary by County and Locality
The SUT rates in California differ by county and locality, and range from 7.25 percent to 8.75 percent, depending on whether optional taxes are levied.
As of January 1, 2007, the average statewide SUT rate was 7.94 percent (weighted by sales). This includes:
- A state rate of 6.25 percent—5 percent for the General Fund, 1 percent for specified local purposes, and 0.25 percent to pay off the deficit-financing bonds. The SUT on gasoline is diverted to transportation-related special funds.
- A weighted average local rate of 1.69 percent, including 0.75 percent for general purposes, 0.25 percent for county transportation purposes, and the remaining 0.69 percent from optional SUTs largely used for transportation (see
box below). The maximum optional SUT rate is 1.5 percent.
|
Largest SUT Tax Expenditure Programs |
|
Estimated 2006-07 (In Millions) |
|
|
Estimated 2006-07 Sales |
Revenue Reduction |
|
Exemption |
Statea |
Local |
Totals |
|
Food productsb |
$59,796 |
$3,139 |
$1,609 |
$4,748 |
|
Gas, electricity, water |
31,082 |
1,632 |
836 |
2,468 |
|
Prescription medicines |
24,256 |
1,273 |
652 |
1,926 |
|
Candy and snack food |
6,360 |
334 |
171 |
505 |
|
Animal life, feed, and plants |
6,154 |
323 |
166 |
489 |
|
Farm equipmentc |
2,286 |
120 |
— |
120 |
|
Bottled water |
1,134 |
60 |
31 |
90 |
|
Custom computer programs |
940 |
49 |
25 |
75 |
|
Motion picture leases |
880 |
46 |
24 |
70 |
|
Diesel fuel used in farming and food processingc |
819 |
43 |
— |
43 |
|
Motion picture production services |
640 |
34 |
17 |
51 |
|
|
|
a
Includes 0.25 percent rate for deficit-financing
bonds. |
|
b
Excludes candy and snack food. |
|
c
Partial state-only exemption. |
Local SUT Levies
The SUT comprises on average about 30 percent of city tax revenues and 7 percent of county tax revenues and, thus, is a significant local revenue source.
Uniform Local SUT. The 1 percent Bradley-Burns Uniform Local SUT is allocated to cities and counties as follows (1) 0.25 percent to the county in which a sale occurs to fund transportation projects, and (2) 0.75 percent for general purposes to the city in which the sale occurs, or the county if the sale was in an unincorporated area. After the deficit-financing bonds are repaid, the general tax rate will return to 1 percent and the overall Bradley-Burns rate will return to 1.25 percent. Special district taxes are allocated to the appropriate local district.
Optional Local SUT. Regarding the optional SUTs that localities can levy, these average 0.69 percent on a statewide basis. They are levied countywide in 24 of California’s 58 counties, and in another 11 counties there are individual localities that levy them. They can be adopted by counties, cities, or special taxing jurisdictions or districts. The latter are formed to fund local programs such as transportation projects, hospital services, public libraries, and schools. California’s 58 counties, 478 cities, and 35 special tax districts have a plethora of individual SUT levies that makes administering and allocating their revenues challenging.
These optional SUTs require two-thirds voter approval if the revenues are to be dedicated to a specific purpose. A majority vote is required for an optional general purpose local sales tax. Statewide, these optional taxes currently range from 0.10 percent to 1 percent.
|
Comparisons to Other States
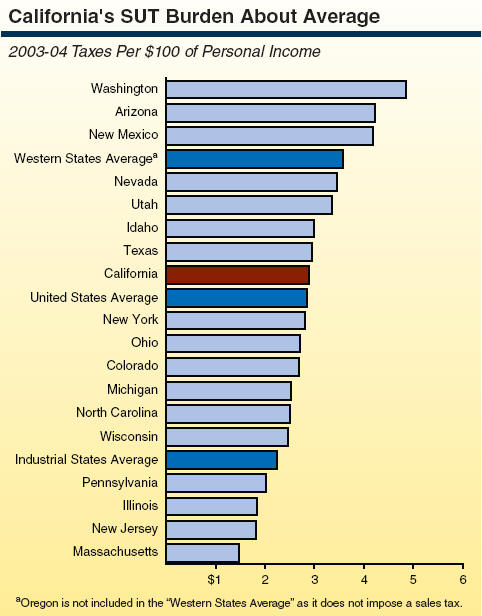
Compared to other states, California has the highest combined state-local SUT rate. However, because it also has many SUT exemptions and exclusions, its SUT revenues per $100 of personal income are more in line with other states—somewhat above the national average and average for major industrial states, but significantly below the western states’ average.
Recent Trends and Future Performance
California’s SUT revenues have increased at a healthy rate over the last few years; in 2005-06, for example, revenues increased by 7 percent. However, the tax performed poorly in the early 2000s during the recession. Taxable sales have declined as a share of personal income over the last 20 years, due to changes in both consumption patterns and the structure of the economy. However, the share appears to have stabilized in recent years.
SUT Tax Policy Issues
The basic structure of the SUT has been a topic of increased attention and concern for many years, especially in recent decades as the economy and California’s fiscal landscape have experienced change. Key SUT-related issues include:
- Base Erosion. What is the long-term viability of the SUT, given the shift toward nontaxed services and intangible goods?
- Remote Sales. Vendors with no physical presence in California are not required to remit the SUT to California that its residents owe associated to the use tax on their out-of-state Internet or mail-order purchases (see
box below). This creates a price advantage for remote retailers compared to California-based businesses, and also results in a substantial revenue loss to California. How can and should this issue be addressed?
- Interstate Tax Variations.
Considerable interstate variation exists in SUT provisions, which can both complicate tax administration and create challenges for taxpayers. The Streamlined Sales Tax Project (SSTP) is a multistate effort to create greater uniformity and simplicity in the administration and collection of state sales taxes. California has attended meetings and provided advice to SSTP. However, California has not yet conformed its SUT to all SSTP recommendations, and doing so would both require substantial changes in California tax law and reduce state autonomy in this area. What should be California’s position on this issue?
- Local Finances and Land Use. What role should the sales tax play in local government finance? Does the current method for allocating SUT revenues (based on point of sale) give cities undue incentives to encourage retail development? What actions could the Legislature take given that state authority to change the Bradley-Burns sales tax rate and revenue allocation was greatly reduced due to voter approval of Proposition 1A in 2004?
- Tax Expenditure Programs. Are certain SUT-related TEPs ineffective or inefficient, and therefore deserving of elimination or modification?
Tax Policy and the Internet
The United States Supreme Court has ruled that states may not require retail businesses with no physical presence in a state to remit sales taxes owed to them on Internet or mail-order sales. The Supreme Court’s finding was based on the adverse effects on interstate commerce that might result from such a requirement. The Court noted, however, that Congress has the power to override this decision by changing the law. However, Congress has not taken action on this issue.
Given this, Internet sellers with no physical presence in California are not required to charge state SUTs when taking orders from California residents. The state may still attempt to directly collect these taxes from residents, but such collection is often prohibitively complex and burdensome. This inability to collect taxes on remote sales raises issues related to both fairness and the potential adverse revenue effects on the state and its localities.
Tax Fairness. The issue of tax fairness exists because retail businesses with a physical presence in California must collect SUT from purchasers, while businesses operating over the Internet (or other remote means) and with no physical presence in the state cannot be required to collect the tax. Some businesses argue that this is unfair because it creates a tax-generated bias toward remote sellers. Other businesses claim that it would be unfair for businesses with no physical presence in a state to be required to collect taxes.
Revenue Effects. Possible revenue effects on state and local governments is of concern due to two particular features of Internet commerce. First, if Internet commerce grows at the expense of growth in sales by traditional “main street” businesses, the SUT base will continue to decline, which could have a direct impact on state and local revenues. Second, Internet technology is capable of transforming numerous tangible goods into a nontangible form (for example, the replacement of CDs with downloadable MP3s). These would then not be part of the SUT base, and would result in state and local revenue losses.
California is inherently limited regarding what it can do in dealing with these issues. However, there are a number of administrative steps states have taken to partially address them. In addition, some have suggested that greater uniformity of state sales tax provisions (as envisioned in SSTP) would reduce the burden of tax collection for retailers operating in multiple states, and thus make Congress more likely to permit requiring SUT collections on remote sales. For a further discussion on this topic, see the LAO publication
California Tax Policy and the Internet (January 2000).
|
Corporation Tax
Overview of the Corporation Tax (CT)
California is one of 45 states to levy a broad-based tax on corporate profits, and its CT is the state’s third largest source of General Fund revenues. As used in this primer, the CT includes regular corporations, Subchapter S of corporations, financial institutions, and certain other business entities. In 2005-06, it raised an estimated $10.3 billion, or about 11 percent of total General Fund revenues. The CT applies to all corporations which earn income derived from, or that is attributable to, sources in California. Nonprofit corporations (such as churches and charitable organizations) are exempt, as are insurance companies (which instead pay a gross premiums tax).
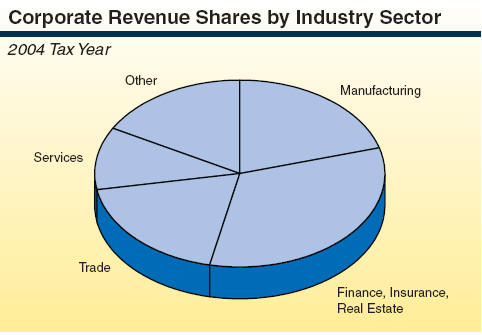
Of the more than 600,000 corporations filing CT returns in California, only about 55 percent actually report profits, and thus, pay CT taxes. The remainder report losses, and thus, are subject only to the state’s minimum tax. Those firms making profits are distributed among different industry sectors. Finance, insurance, and real estate firms account for almost one-third of all CT tax liabilities.
The CT actually encompasses three different individual taxes—the corporate franchise tax, corporate income tax, and bank tax. The corporate franchise tax is paid by most businesses in the state for the privilege of doing business in California, while the corporate income tax is paid by businesses which do not have sufficient presence or activity in the state for franchise tax purposes. The bank tax is paid by banks and financial institutions. All three components of the CT are assessed based on income. The franchise tax is by far the most significant component, accounting for about 96 percent of CT revenues.
Taxation of S Corporations
“S corporations” are business entities that receive the limited liability benefits of a corporation, but are taxed like a partnership. That is, their income is “passed through” to shareholders on a pro-rata basis and taxed at each individual’s PIT rate rather than at the regular corporate rate. In 2004, there were more than 268,000 S corporation returns filed in California, generating $739 million in CT revenues. Nearly one-half of all California corporations are S corporations. Regarding their tax treatment, S corporations:
- Pay a reduced corporate income tax rate of 1.5 percent (3.5 percent for financial S corporations).
- Are not subject to the AMT but are subject to the same minimum tax requirements as other corporations.
Most California S corporations are small businesses which also have elected federal Subchapter S corporation status, in that they have no more than 75 shareholders and only one class of stock. However, there also are many very large S corporations in terms of assets, sales, and net income.
|
Key CT Features
The CT’s key features include:
- A basic tax rate on profits of 8.84 percent and an $800 minimum tax (except during a firm’s first year of operation). Banks and financial institutions pay at a higher rate of 10.84 percent to compensate for being exempt from certain local levies.
- Corporations are also subject to an alternative minimum tax (AMT) similar in principle to the personal income tax (PIT) AMT, but at a slightly lower rate of 6.65 percent.
- A reduced tax rate of 1.5 percent for Subchapter S corporations, whose income “flows through” and is taxed on shareholders’ PIT returns (see shaded box).
- The right to “carry forward” a certain percentage of the net operating losses (NOLs) incurred in one year so as to reduce taxable profits in subsequent years.
- The apportionment to California of a share of the domestic or worldwide business income for multistate and multinational corporations.
- A broad range of income exemptions, exclusions, and deductions, as well as tax credits. The value of these tax expenditure programs (TEPs) to taxpayers exceeds $4.3 billion (see the accompanying figure for a description of the largest TEPs).
|
Largest Corporate Tax Expenditure Programs |
|
2006-07 (In Millions) |
|
Program |
Type of Provision |
Revenue Reduction |
|
Subchapter S Corporations |
Special Filing Status |
$1,500a |
|
Research and Development Expenses Credit |
Credit |
850b |
|
Water's-Edge Election |
Special Filing Status |
610 |
|
Carryforward of Net Operating Losses |
Deduction |
600 |
|
Activities in Economically Depressed Areas |
Credit |
270 |
|
Double-Weighted Sales Apportionment Formula |
Apportionment Rule |
165 |
|
Manufacturers' Investment Tax Credit |
Credit |
120 |
|
Exploration, Development,
Research, and Experimental Costs |
Deduction |
119 |
|
Tax-Exempt Status for Qualifying Corporations |
Exclusion/Exemption |
115 |
|
|
|
a
Net effect that takes into account the associated
personal income tax revenue increase. |
|
b
Accounts for increased deductions that would occur
without the credit. |
Relationship to Federal Law
California conforms in a great many CT areas to federal corporate tax law regarding its basic structure and TEPs. However, some notable exceptions exist. For example, federal law offers more generous depreciation allowances, does not levy an entity-level tax on Subchapter S corporations, and allows 100 percent of NOLs to be “carried back” to prior tax years.
Taxing National and International Corporations
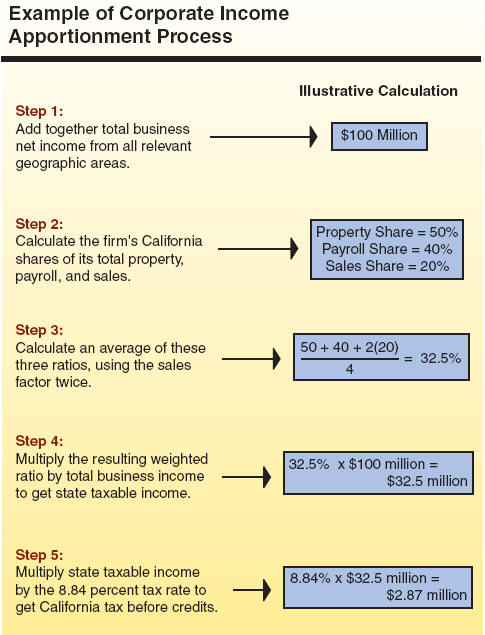
The taxation of corporations doing business only in California is relatively straightforward in terms of computing their taxable profits, in that California profits equal the difference between receipts and allowable deductions (such as expenses for employee salaries). Most businesses filing under the CT are California-only corporations; however, most corporate income—over 70 percent—accrues to multistate and multinational corporations.
For these firms, California profits are determined by apportioning a share of their total domestic or worldwide business income to California, based on California’s weighted share of their total property, payroll, and sales (in most cases, the sales factor is double-weighted in doing this calculation). International corporations are given the option of using a domestic or worldwide base in doing their apportioning. In contrast to business income’s treatment, nonbusiness corporate income, such as interest, is “sourced” to different states and nations using a set of prescribed rules.
The CT’s Distribution
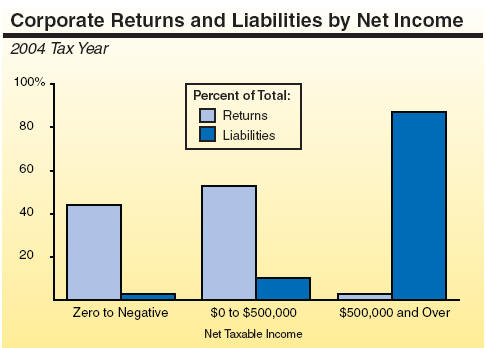
In 2004, 97 percent of CT filers had taxable income of less than $500,000. The tax revenues generated by these firms accounted for 13 percent of the total CT taxes paid. Corporations earning a taxable income of $500,000 or more, in contrast, represented only 3 percent of returns, but had 87 percent of the tax liability.
Comparisons to Other States
California’s basic CT rate of 8.84 percent is relatively high compared to other states. However, in making interstate tax-burden comparisons, one also must take into account more than just the basic tax rate—such as the various TEPs taxpayers benefit from. In addition, there are often a variety of special tax rates, income thresholds, and other provisions that apply in specified circumstances. One way to adjust for this is by looking at corporate income taxes relative to personal income. In this regard, California’s CT burden is a bit above average for the U.S. as a whole (0.6 percent versus 0.4 percent).
|
Comparison of Key Corporation Tax Provisions |
|
2006 Tax Year |
|
State |
Basic Tax Rate (%) |
General Minimum Tax ($) |
S Corporation Taxabilitya |
|
Pennsylvania |
9.99% |
— |
Exempt |
|
Massachusetts |
9.50 |
$456 |
Exempt |
|
New Jersey |
9.00 |
500 |
Taxable |
|
California |
8.84 |
800 |
Taxable |
|
Wisconsin |
7.90 |
— |
Exempt |
|
Idaho |
7.60 |
20 |
Exempt |
|
New York |
7.50 |
100 - 1,500 |
Taxable |
|
Arizona |
6.97 |
50 |
Exempt |
|
North Carolina |
6.90 |
— |
Exempt |
|
Oregon |
6.60 |
10 |
Exempt |
|
Ohio |
5.10 - 8.50 |
50 |
Exempt |
|
Utah |
5.00 |
100 |
Exempt |
|
New Mexico |
4.80 - 7.60 |
— |
Exempt |
|
Illinois |
4.80 |
— |
Exempt |
|
Colorado |
4.63 |
— |
Exempt |
|
Michigan |
1.90 |
— |
Taxable |
|
|
|
a In
some states, exempt entities do not face a general
state tax, but still must: (1) pay tax on certain
income components that are federally taxable (such
as some capital gains) or (2) face a state
replacement income tax at reduced rates. |
The CT’s Future
The CT has experienced relatively good growth in the past several years, consistent with the economy’s strong profits growth. This is in contrast to its relatively subdued growth performance throughout much of the 1990s, which raised questions regarding the CT’s future role as a major revenue source. The 1990s’ pattern is not fully understood, but some tax experts have pointed to increased use of creative corporate accounting and tax shelters. Whether these activities will constrain CT growth in the future is unknown, but remains a concern.
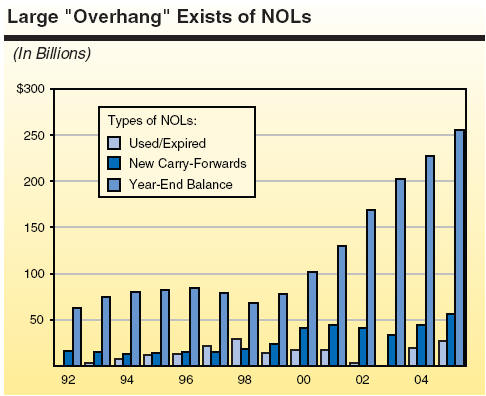
Future CT growth also could be affected by the substantial overhang of previously generated, but as yet unclaimed, NOLs. The magnitude of unused NOLs has risen steadily since the late 1990s, and they total over $250 billion. They are worth a potential tax savings of more than $20 billion to California corporations (and thus, revenue losses to the state), if and when used.
CT Policy Issues
Key CT issues involve:
- Income Apportionment. Does California’s use of a double-weighted sales factor in its income apportionment formula best achieve the state’s tax policy goals?
- Dividend Taxation. California (like the federal government) “double-taxes” dividend income, since it is taxed under both the PIT and CT. Should this be changed?
- Integration. More generally, since both the PIT and CT tax income, some have proposed integrating the two taxes in some fashion. Should this be considered?
- Federal Conformity. California conforms to federal CT law in many areas. Is California’s policy of generally conforming still appropriate, and should additional conformity occur where it does not currently exist (such as with depreciation)?
- Tax Expenditure Programs. Are certain CT-related TEPs ineffective or inefficient and, therefore, deserving of elimination or modification?
- Revenue Performance. What will CT growth be in the future, given increased use of tax shelters and creative accounting practices in recent years? Are there associated problems with how the tax will be administered and enforced?
Other State Taxes
In addition to the three main taxes described in earlier chapters, California imposes an insurance tax; alcoholic beverage tax; and various tobacco-related, gambling-related, and motor vehicle-related levies. In addition, employees and employers pay taxes into trust funds to finance the state’s disability and unemployment insurance programs.
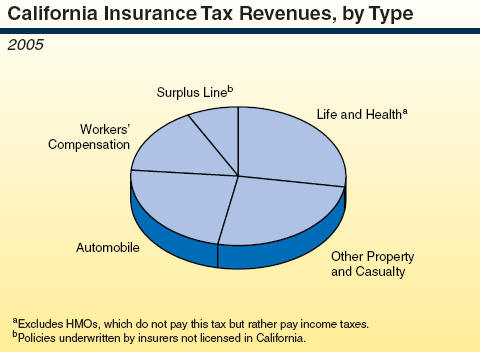
The Insurance Tax
Implemented in 1911, the insurance tax is one of the oldest taxes in California. The tax is levied on the premiums sold by insurance companies, and is in place of all other levies on insurance companies except real property taxes and motor vehicle license fees. The fourth largest General Fund revenue source, it raised an estimated $2.2 billion (2 percent of the total) in 2005-06 from the approximately 2,000 companies subject to it.
- The tax base consists of premiums written in the previous calendar year.
- Since 1990, the tax rate has been 2.35 percent.
- There is no corresponding insurance premium tax at the federal level. Rather, insurance companies pay the standard federal corporate income tax.
- Special provisions apply to (1) title insurers and ocean marine insurers, which must use a different tax base, and (2) certain pension and profit-sharing insurance contracts and specialized insurers, which are taxed at different rates.
The Estate Tax and the Generation-Skipping Transfer (GST) Tax
Estate Tax
This tax was established by Proposition 6 in June 1982, which eliminated the state’s Inheritance and Gift Tax law. The tax is levied on the adjusted value of property holdings of individual taxpayers upon their deaths. However, the tax imposes no net burden on California taxpayers. This is because federal law allows for a credit against the federal estate tax for any state estate taxes paid, and the state’s rate is set equal to the maximum allowable federal credit. Since the state is able to “pick up” revenues for itself at no cost to taxpayers through this mechanism, the state’s tax is often referred to as the estate pickup tax.
In 2005-06, the tax brought in only about $4 million and no revenues will occur under current law for several years. This is because the federal estate tax credit for state payments has been repealed for estates of decedents dying after 2004 and replaced with a deduction. As a result, California does not currently impose any estate taxes on estates of decedents dying after 2004. The federal estate tax is currently being phased out through 2010, at which time the deduction will no longer exist. However, starting in 2011, current federal law provides that the federal estate tax will be put back in place, in which case the state pick-up tax would again generate revenues.
GST Tax
Similar to the estate tax, California’s GST tax is equal to the amount allowable as a credit under federal law. The GST tax is imposed only on the value of interests in property that actually pass to certain transferees. Its current situation is similar to that of the estate tax discussed above.
Motor Vehicle-Related Levies
Motor vehicle-related levies, including taxes and fees, are the main source of state special funds revenues. They accounted for $8.4 billion in 2005-06—about one-third of the total. They also are the main source of transportation funding. Including funds received from applying the sales and use tax (SUT) to fuel, such levies were responsible for about $5.8 billion, or 96 percent, of state transportation funding in 2005-06.
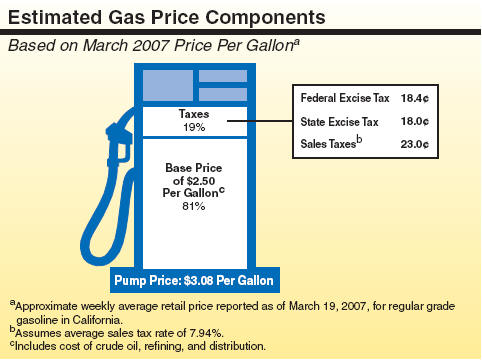
Fuel Taxes
State excise taxes on fuel accounted for $3.2 billion, or 53 percent, of transportation funding in 2005-06. These taxes are levied at a flat rate on each gallon of motor fuel sold, as follows:
- The Motor Vehicle Fuel License Tax, or so-called gas tax, is imposed on fuel distributors at a rate of 18 cents per gallon.
- The Diesel Fuel Tax is levied on the sale and delivery of diesel fuel. It is also 18 cents per gallon, and is generally collected from distributors.
- Other alternative fuels are taxed at varying rates, many of them lower than the 18 cent rate for conventional gasoline. For example, ethanol is taxed at 9 cents per gallon.
The standard SUT is also charged on the sale of fuel. It is levied “on top of” the excise tax, except in the case of diesel fuel, where the 18 cent diesel fuel tax is excluded from the SUT base.
Policy Issues. There are a number of important tax policy issues regarding fuel taxes—including how they should be levied and what their allocation should be. For example:
- Application of the Tax. There have been proposals to change the gas tax from a per-gallon excise tax to an ad valorem excise tax based on wholesale price. Proponents argue that this would result in revenues more closely tracking increasing demand for transportation infrastructure.
- Sales and Use Taxation. Is it appropriate to continue the current practice of levying the SUT on top of the fuel excise tax?
- Social Costs. While gas taxes are loosely linked to the use of the state transportation system, some argue that gas is undertaxed in that no taxes are directly levied on fuel for indirect costs imposed on society by automobiles—such as congestion and pollution. Should this be addressed?
Truck Weight Fees
In addition to the fuel tax, the state also collects weight fees on commercial vehicles (trucks). This fee is based on either the truck’s unladen weight (for trucks lighter than 10,000 pounds) or its gross weight (for trucks in excess of 10,000 pounds). This fee raised $915 million in 2005-06, and accounted for 15 percent of transportation revenues.
Vehicle License Fee (VLF)
The VLF is an annual fee on the depreciated purchase price of a registered vehicle in California, levied in lieu of taxing vehicles as personal property. The revenues, which totaled an estimated $2.2 billion in 2005-06, are distributed to cities and counties and can be used for any purpose.
Proposition 1A (November 2004) permanently set the VLF level to 0.65 percent of a vehicle’s estimated market value. The 0.65 percent rate represents a substantial decline from the VLF rate that had existed in the 1980s and 1990s (typically 2 percent). However, cities and counties did not experience a decline in revenues due to this change, since reduced VLF revenues were replaced by property tax revenues shifted to them from schools.
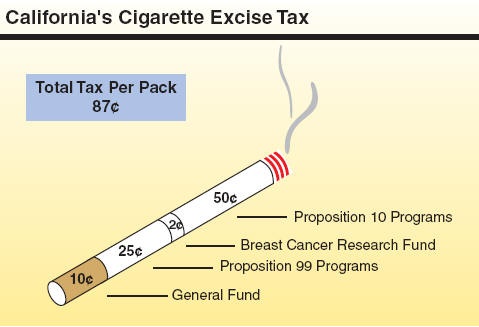
Tobacco-Related Taxes
These taxes raised an estimated $1.1 billion in total state revenues in 2005-06, with the proceeds used for both General Fund and special fund-related purposes. The state’s cigarette tax is currently 87 cents per pack (20 cigarettes) and is levied on cigarette distributors. As shown, the total tax is comprised of both General Fund and special funds components.
As with other taxes, generally, consumers ultimately share in the burden of the tax in the form of higher retail prices. Other tobacco products (such as cigars, chewing tobacco, pipe tobacco, and snuff) are taxed at a rate that is equivalent to the tax on cigarettes. In addition to state excise taxes, a tax of 39 cents per pack is imposed by the federal government.
A key policy issue regarding these taxes is their future revenue potential given declining tobacco consumption caused by higher excise taxes and health concerns.
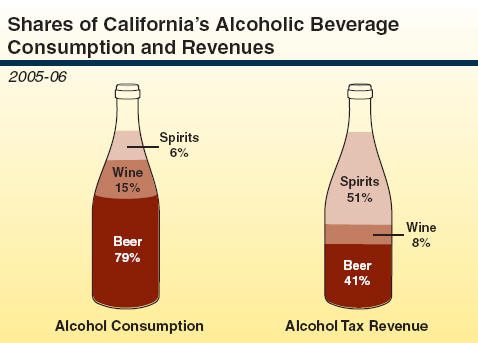
Alcoholic Beverage Taxes
Excise taxes are imposed on the sale of alcoholic beverages by manufacturers on a per-gallon basis. California’s alcoholic beverage tax is levied in addition to a federal excise tax. In addition, annual license fees must be paid by retail establishments selling liquor. As shown in the accompanying figure, different tax rates apply, depending on the beverage.
|
Alcoholic Beverage Tax
Rates |
|
Beverage |
Tax Per Gallon |
|
Beer, wine, and sparkling hard cider |
$0.20 |
|
Champagne and sparkling wine |
0.30 |
|
Distilled spiritsa |
3.30 |
|
|
|
a For
100 proof or less. Tax is doubled for higher proof. |
General Fund revenues raised from this tax in 2005-06 totaled an estimated $318 million. Revenues have remained relatively stable in real terms over the past decade. The majority of revenues come from distilled spirits and beer.
Gambling-Related Taxes
The California Constitution allows for a state-run lottery and wagering on horse races, as well as bingo for charitable purposes.
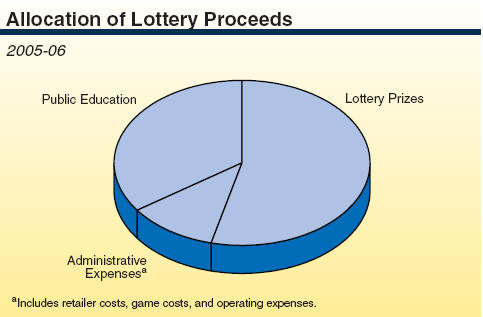
The California State Lottery
The lottery was established by Proposition 37 (November 1984). The California State Lottery Act sets forth how the proceeds of lottery ticket sales shall be distributed—one-half returned to bettors, up to 16 percent for administrative expenses, and at least 34 percent to education. Lottery wagering was estimated to total $3.6 billion in 2006, of which $1.3 billion went to public education. Lottery revenues are a minor source of funds for schools. For instance, they represented approximately 1.5 percent of total K-12 school revenue in 2005-06.
Tribal Gambling Revenue
State and local governments are limited in their abilities to tax Indian tribes, including those with gambling enterprises, due to the tribes’ sovereign status under federal law. California governments, however, receive revenue from tribes with casinos pursuant to the provisions of tribal-state gambling compacts that are negotiated by the Governor and ratified by the Legislature. In 2005-06, the state government received $301 million of such payments, of which $27 million was deposited into the General Fund.
Horse Racing Levies
Horse racing license fees and taxes are levied on the amounts wagered at horse racing meets. The tax rate ranges from 0.4 percent to 2 percent depending on the style of racing, the type of wager, and where the wager is placed. In 2005-06, state revenues from these levies amounted to approximately $38 million.
Employment-Related Taxes
State Disability Insurance (SDI) Taxes
The SDI tax is levied on employees in the form of payroll deductions in order to fund the disability insurance program. This program provides short-term insurance benefits to offset, in part, lost wages due to nonjob-related illnesses, injuries, and pregnancy. For 2007, the SDI effective contribution rate is 0.6 percent of the first $83,389 of an employee’s annual income.
- California is one of five states to operate a publicly funded disability insurance program.
- About 12.8 million employees are covered by the SDI program. Coverage is mandatory for most Californians, with some limited exceptions.
Unemployment Insurance (UI) Taxes
The UI tax is levied on employers. Tax revenues provide partial wage replacement to unemployed workers looking for new work. Employers pay taxes on up to $7,000 in annual wages paid to each worker. The actual tax rate depends on the employer and the amount of benefits paid to former employees. The UI program was created by the federal Social Security Act of 1935 and it is administered by states. All states have similar federal-state programs, but rates and provisions vary.
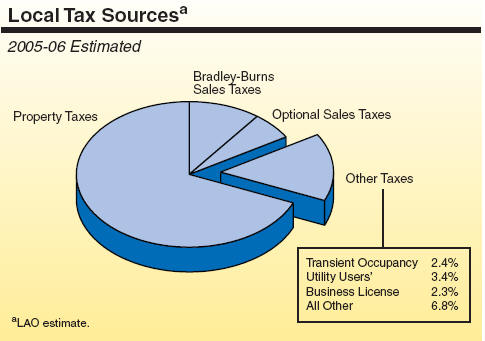
Local Taxes
In 2005-06, local taxes raised over $55 billion and accounted for approximately 44 percent of local government own-source revenues. The main sources of local tax revenues are the property tax (69 percent); local sales and use taxes (SUTs) (16 percent); and other levies (15 percent), including the utility users’ tax, business license tax, and transient occupancy tax. The local SUT was discussed in Chapter 3. This section focuses on the property tax and other local taxes.
Property Tax
The property tax is a major source of revenue for California’s local governments: school districts, community colleges, counties, cities, redevelopment agencies, and special districts. Property taxes have been part of California’s tax structure since 1849, and are among the most stable of its revenue sources. In 2005-06, the property tax raised $38.3 billion. This amount includes $34.9 billion under the 1 percent property tax rate and $3.4 billion in additional property taxes levied to pay bonded indebtedness.
Property Tax Base. The property tax applies to all classes of property—residential, commercial, industrial, agricultural, open space, timberland, vacant land, and certain personal property. Real property includes land, buildings, fixtures, mineral rights, and other components. Personal property includes things like equipment, machinery, and aircraft, and is generally limited to businesses.
Certain types of property are exempt, such as property owned by governments or charities, household personal property, automobiles, securities, and business inventories.
Property Assessment. The property tax is based on the assessed value of real and personal property in the state. Most property is assessed locally by county assessors, although some property—including railroads and utilities—is assessed by the state. Prior to the adoption of Proposition 13, all property was assessed at the market rate and a locally determined tax rate was applied to the assessed value in order to calculate the total tax levy.
The adoption of Proposition 13 in 1978 imposed assessment restrictions on the property tax that limit local governments’ ability to raise revenues from this tax. Under Proposition 13, locally assessed real property is assessed based on its acquisition value (other property continues to be assessed at market value). Assessed value is allowed to increase annually by the lesser of 2 percent or the rate of inflation.
For most other property (locally assessed personal property or state assessed real property), the assessment practice continues to be based on market value.
Property Tax Rate. Under Proposition 13, the countywide property tax rate is limited to 1 percent of assessed value. Additional levies are permitted for voter-approved general obligation debt. For 2005-06, the average countywide tax rate was 1.098 percent, with the highest at 1.159 percent for the County of Alameda.
Property Tax Allocation. The share of the 1 percent property tax rate received by individual local governments varies significantly throughout the state. Most of this variation reflects differences in property tax rates and assessed values during the mid-1970s, the period used as the basis for the state’s tax allocation formulas. In addition, the share of property tax allocated to education agencies (schools and community colleges) versus other local governments has changed over time.
Before 1978, local agencies determined their property tax rate and the distribution of their revenues. In 1978, Proposition 13 shifted the responsibility for allocating the property tax to the state and set the 1 percent maximum rate. Beginning in 1979, the state basically prorated property tax revenues among local agencies, except that it gave a smaller share of overall tax revenues to education agencies (39 percent instead of 53 percent), and backfilled these reduced tax revenues with state aid.
In the early 1990s, to reduce state education funding costs, the state modified the property tax allocation formulas to shift some property taxes from cities, counties, and special districts to education agencies. As a result, education agencies’ share of the overall property tax in 1994 increased from 39 percent to 52 percent.
In 2003 and 2004, the state shifted property taxes from education agencies to cities and counties to offset city and county revenues losses from (1) the ongoing reduction in the vehicle license fee and (2) the redirection of some local sales tax revenues for payment of the state’s deficit-financing bonds (the “triple flip”).
|
California Property Tax Allocation |
|
(Dollars in Billions) |
|
Fiscal Yearsa |
|
Tax Distribution |
|
Revenue |
Schools |
Counties |
Cities |
Otherb |
|
1977-78 |
$10.3 |
53% |
30% |
10% |
7% |
|
1979-80 |
5.7 |
39 |
32 |
13 |
16 |
|
1994-95 |
19.3 |
52 |
19 |
11 |
18 |
|
2005-06 |
34.9 |
38 |
26 |
18 |
18 |
|
|
|
a
Information for 1977-78 includes debt levies. Data
for 2005-06 are estimated. |
|
b
Redevelopment agencies and special districts. |
Property Tax Policy Issues. The property tax has numerous issues associated with it. These include:
- Fairness of Tax. Under current assessment methods, owners of identical properties can pay vastly different taxes based solely on when they purchased their property.
- Variation in Property Tax Shares. Individual local governments vary greatly in the share of the property tax they receive. Most of this variation reflects differences in local property tax rates and values during the mid-1970s. Local governments have no authority to modify the tax allocation formulas in response to modern needs and preferences. State authority to modify these allocation formulas was greatly reduced due to voter approval of Proposition 1A in 2004.
- Administrative Complexities. The property tax’s complex allocation formulas and many statutory provisions regarding assessment practices make it one of the state’s most difficult taxes to administer.
-
Property Tax Burden Borne by Homeowners. The share of the total property tax paid by homeowners (versus business and other property owners) has increased modestly over the last three decades. The economic factors underlying this change are not known, but could include different rates of investment in homes versus other properties and different property ownership transfer rates.
Other Local Taxes
Utility Users’ Tax. About one-half of the state’s residents live in a city or county that levies a utility users’ tax. This tax is assessed on the consumer of one or more of the following services: electricity, gas, cable television, water, and telephone. Statewide, cities and counties raised over $1.8 billion from this source in 2004-05. Most utility users’ taxes are imposed by city councils and at rates ranging from 1 percent to 11 percent. For cities that impose a utility users’ tax, its revenues account for approximately 15 percent of their general-purpose tax revenues.
Transient Occupancy Tax (TOT). The TOT is imposed on occupants for the privilege of occupying a motel, hotel, or similar room. The tax represents an attempt on the part of many local governments to “export” a portion of the tax burden to nonresidents and/or to recoup the costs imposed by nonresidents. Cities and counties collected over $1 billion in TOT revenues in 2003-04.
Business License Tax (BLT). The BLT is a type of excise tax imposed on businesses for the privilege of operating within a city or county. The tax is commonly based on gross receipts or levied at a flat rate. Cities rely on the BLT for roughly 6 percent of their general-purpose tax revenues. The BLT revenues contributed more than $860 million to local governments in 2003-04.
Other Taxes. Local governments impose a variety of other taxes, including: property transfer taxes, construction development taxes, Mello-Roos community facilities taxes, and parcel taxes. These taxes vary widely across different types of local governments and totaled over $3.8 billion in 2003-04.
Glossary of Common Tax Terms
Ad Valorem Tax—A tax assessed based on the dollar value of an item or activity. Typical examples are property and sales taxes. Ad valorem taxes contrast with per-unit taxes, such as California’s alcoholic beverage and cigarette taxes, which are assessed at a fixed dollar amount per unit of the item purchased.
Adjusted Gross Income—An amount calculated for income tax purposes which equals total income minus various exclusions, exemptions, and adjustments.
Alternative Minimum Tax (AMT)—An additional tax that must be computed by individual and corporate taxpayers who take advantage of certain special tax preferences. If this tax exceeds the regular tax liability, the excess amount is separately assessed. In addition, the AMT can reduce the amount of tax credits that can be claimed, even if a separate add-on AMT liability is not owed. The underlying intent of the AMT is to ensure that some tax is paid by those who claim special tax preferences. The state’s AMT is (in many respects) similar to the federal AMT.
Bracket Creep—Since monetary wages and other types of compensation often go up with inflation, inflation can “push” taxpayers into higher tax brackets, even though their “real” income may be unchanged. This can inadvertently lead to a higher personal income tax (PIT) marginal tax rate being applied and increased tax liabilities being assessed.
Capital Gains—Income or profit from the sale of capital assets, such as real or personal property, stocks and bonds, and other property held by taxpayers. Certain capital losses can occur as well as capital gains.
Carryback or Carryforward—The amount of business-related losses from one year that can be used to offset taxable income in past years (a carryback) or in future years (a carryforward). Such losses are due either to the sale of capital assets or to the realization of a net operating loss (see below).
Credit—An amount which can be subtracted from the computed tax owed, and thereby reduce a tax liability. A credit is usually tailored to benefit specific categories of individuals or businesses, or encourage certain types of behavior. Examples are California’s tax credits for research and development expenditures and senior citizens.
Deduction—Amount subtracted from gross income to arrive at taxable income. Examples for individuals include home mortgage interest expenses and charitable contributions. Examples for businesses include employee salaries and depreciation charges for equipment.
Depreciation—Income tax deduction allowed for the decrease in the value of structures and capital assets due to use and obsolescence. Depending on the type of asset and the year placed in service, different methods for calculating depreciation are applicable.
Effective Tax Rate—Percentage of market value, income, or other taxed amount that a tax liability represents. Also known as the average tax rate.
Excise Tax—General term for a per-unit levy on the manufacture, sale, or use of a specific service or commodity. Examples include California’s excise taxes on alcoholic beverages and cigarettes.
Exemption—Refers to the partial or complete exclusion from taxation of specified items, such as certain types of income under the PIT or transactions under the sales and use tax. Can constitute either a specified dollar or percentage amount, and can apply to specified types of individuals, businesses, property, institutions, sources of income, or other classifications. An example is the exemption of income from taxation of nonprofit organizations, as long as receipts received are related to the nonprofit activities of the entity.
Incidence—Refers to who bears the burden of a tax. Tax incidence can take two forms—economic and statutory incidence. Economic incidence involves who ultimately bears the cost of the tax. This may differ from statutory incidence, which is simply who initially pays the tax. For example, a landlord initially pays the property tax and thus has statutory incidence, whereas renters share in economic incidence to the extent that the property tax is “passed on” to them in the form of higher rent.
Income Apportionment—The process of determining the amount or share of a taxpayer’s income that is allocable to a particular geographic jurisdiction—such as California—for tax purposes.
Indexing—The annual upward adjustment under the income tax of marginal tax bracket boundaries, certain credits, and the standard deduction by the Consumer Price Index to compensate for inflation.
Marginal Tax Rate—The income tax rate that is applied to the highest or last dollar of a taxpayer’s income.
Marriage Penalty—The amount by which the tax liability of a married couple exceeds their combined tax liability that would have existed had they not been married and filed as two single taxpayers.
Net Operating Loss—When the gross income of a business is exceeded by its allowable deductions, thereby causing a loss for tax purposes. In California, these losses may be carried forward and used to offset positive net income in future years, subject to various rules.
Nexus—Minimum threshold of “connection” or “presence” with a taxing jurisdiction that is required before taxes or tax collection responsibilities can be imposed on out-of-state individuals and businesses.
Passive Income—Income from trade or business activities for which a taxpayer does not actively participate, such as activities involving certain limited partnerships or rental properties. Net losses (called “passive losses”) from these types of investments are limited in their use as offsets to regular “active” income, such as wages and salaries. Unused passive losses may be carried forward to offset passive income in the future, however.
Progressive Tax—Occurs when high-income taxpayers pay a greater percentage of their income in tax than do low-income taxpayers. A regressive tax involves the opposite situation.
Subchapter S Corporation—A “closely held” corporation with a relatively limited number of shareholders (75 or less), that qualifies for and elects special tax treatment, including the “pass through” of income to its shareholders for tax purposes.
Tax Base—The individuals, entities, objects, transactions, or other types of activities to which a tax is applied.
Tax Bracket—An upper- and lower-bounded range of taxable income levels within which a particular marginal tax rate is applied. California’s PIT structure has six different basic income tax brackets for each of its five different filing statuses. As one moves to higher and higher brackets, a progressively higher marginal tax rate is applied. There also is a special surtax that applies to the portion of one’s income over $1 million.
Tax Expenditure Program—A tax provision—such as an exemption, exclusion, credit, deduction, deferral, or preferential tax rate—which deviates from the “basic tax structure” and results in a reduction in government revenues that would otherwise be raised.
Throwback—In applying the income apportionment formula to multistate and multinational corporations, the sales of tangible personal property are usually attributed to the “destination state” to which the goods are shipped. However, when the destination state does not have jurisdiction to tax the corporation involved, the sales are “thrown back” to the geographic point of their shipment when making the apportionment calculation.
Value Added Tax (VAT)—A VAT is similar to a sales tax. However, rather than levied on a good’s final sales value, it is assessed at each stage of the manufacturing process, based on the increase in the product’s value attributable to that stage. Many countries throughout the world levy VATs, including many in Europe.
Water’s-Edge Combination—One of two main methods for multistate and multinational corporations to use in combining the income of their various geographic activities in order to determine the amount of California taxable income. The water’s-edge method combines activities from the 50 states of the U.S. and certain tax havens. The alternative method—worldwide combination—uses total income from all geographic jurisdictions throughout the world.
Worldwide Combination—The second of two main methods for multistate and multinational corporations to follow in combining their geographic income in order to determine the amount of California taxable income. In California, this method must be used if water’s-edge election is not made.
UDITPA—Acronym for Uniform Division of Income for Tax Purposes Act. First drafted by the National Conference of Commissioners on Uniform Tax Laws in 1957, it provides a uniform method for allocating the income of multistate and multinational taxpayers among states for income tax purposes. Use of this method both keeps income from escaping taxation altogether and from being taxed more than once.
|
Acknowledgments This report was prepared by
Robert Ingenito,
Marianne O'Malley,
Marcus Stanley, and
Crystal Taylor, and reviewed by
David Vasché
. The Legislative Analyst's Office (LAO) is a nonpartisan office which provides
fiscal and policy information and advice to the Legislature.
|
LAO Publications To request publications call (916) 445-4656.
This report and others, as well as an E-mail
subscription service
, are available on the LAO's Internet site at www.lao.ca.gov. The LAO is
located at 925 L Street, Suite 1000, Sacramento, CA 95814.
|
Return to LAO Home Page