June 2008
A New System of Support For Low–Performing Schools
California currently operates two systems designed to turn around low–performing schools—one for state purposes and one for federal purposes. The two systems are uncoordinated and often duplicative, in addition to being poorly structured. We recommend replacing the two systems with an integrated system that serves both state and federal purposes. Under the new system, the state would support district reform efforts. Districts would receive different levels of support depending on the severity of their underlying performance problem and be given short–term funding linked to specific short–term district reform activities. By virtue of being integrated and district–centered, the new system would cost substantially less than the existing system and could be supported entirely with federal funding.
Executive Summary
California, like most states, continues to grapple with how to improve schools that are failing to meet performance expectations. It continues to struggle despite widespread participation and substantial investment in its school improvement programs. Currently, over 2,400 schools in California (about one quarter of all schools) participate in school improvement programs. Since 1999, the state and federal government have invested $2.5 billion in these programs. Despite these efforts, more schools in California are deemed in need of improvement today than a decade ago.
The state and federal government has each devised its own school improvement system. They differ in important ways—measuring performance differently, setting different performance expectations, and taking different approaches to supporting low–performing schools. Taken individually, each system has its own inherent flaws. Taken together, the state and federal systems form a labyrinth of duplicative and disconnected program requirements that send mixed messages to teachers, parents, schools, and districts. As listed in the figure below, we think this dual system of school improvement has major problems.
Given the shortcomings of the current systems, many have acknowledged the need for a new system. In an effort to move toward an improved system, the administration presented a budget plan in January 2008 that entails a restructuring of the federal school improvement program. Although the administration’s budget plan contains some promising components, it leaves intact many of the fundamental problems of the existing dual system.
In this report, we provide a comprehensive reform plan that unifies the state and federal systems and attempts to overcome the various problems mentioned above. Compared to the existing school–centered system, the new system would be district centered. It would distinguish among districts based on the magnitude of their performance problems and link short–term funding to specific short–term reform activities. Because of the substantial overlap in participation that now exists among state and federal school improvement programs and the substantial federal funding that California now has available for school improvement efforts, the new system could be supported entirely with federal funds. Indeed, given available federal funds exceed the estimated ongoing cost of the new system, our reform plan includes a companion one–time initiative centered around improving the quality of student data in California.
Eight Major Shortcomings of
Dual School Improvement System |
|
✔ Having two sets of performance measures and expectations sends mixed messages to schools. |
✔ State decile rankings mask large differences in school performance. |
✔ Federal indicators of progress mask large differences in school performance. |
✔ School-based approach to reform shown to be ineffective. |
✔ School-based approach ignores critical role of districts. |
✔ School-based approach is unsustainable. |
✔ Having multiple interventions is confusing and can be counterproductive. |
✔ Neither state nor federal funds tightly linked to reform. |
Introduction
For more than a decade, California has been measuring school performance and identifying schools that are not meeting state performance expectations. Since 1999, the state also has funded school improvement programs designed to turn around low–performing schools. Separate from these efforts, the federal government implemented a new school improvement system in 2002 pursuant to the No Child Left Behind Act (NCLB). Today, 25 percent of California schools are participating in school improvement programs. A growing number of schools are expected to enter the federal intervention program in the coming years, and many schools already participating will encounter more severe sanctions as they fail to meet increasingly stringent exit criteria. Regrettably, evaluations of state school improvement programs have consistently shown a negligible impact on student achievement.
This report examines the existing state and federal school improvement systems. It contains four sections. The first provides background on the state and federal systems and the second discusses the shortcomings of this existing dual system. We then describe and analyze the Governor’s 2008–09 budget plan, presented in January 2008, to improve part of this system. The last section identifies five principles we believe should guide the development of a new system and then lays out a new model for state intervention as well as an accompanying budget plan for 2008–09.
Background
Currently, California operates two school improvement systems—one for state and one for federal purposes. The systems are based mainly on Standardized Testing and Reporting (STAR) assessment results. However, the two systems use different school performance measures and set different performance expectations. They also take two distinct approaches to intervening in schools and districts that fail to meet performance targets. Below, we describe the state and federal systems and then highlight the differences between them.
State System
The state system is based on the Public Schools Accountability Act (PSAA)—Chapter 3x, Statutes of 1999 (SB 1x, Alpert). The cornerstone of the system is the Academic Performance Index (API), intended to measure a school’s overall academic performance as well as its progress over time. The major features of the state system are: (1) performance measures and expectations; (2) special planning, technical assistance, and support to help low–performing schools; and (3) sanctions (or consequences) for schools that fail to improve after receiving these special support services.
Performance Measures and Expectations
The state relies on two performance measures:
- API Scores. The state measures school performance using data from STAR assessments. For each school, student achievement on these standardized tests is combined into an API score that ranges from 200 to 1,000. The state has set a school API performance target of 800, which falls above the performance level that represents a “basic” mastery of grade–level skills (700) and below the performance level that represents academic “proficiency” (875).
- Decile Rankings. Schools also receive a statewide rank and a similar schools rank. Both rankings place schools into deciles (10 percentage point groupings), with the top decile (10) indicating the highest performing schools. The statewide rank compares schools by type (elementary, middle, high school). The similar schools rank compares schools of the same type that have similar student demographics.
Annual Targets. Schools that have yet to reach the API performance target of 800 are expected to meet an API growth target. A school’s API growth target is equal to 5 percent of the distance between a school’s prior–year API and 800, or a gain of 5 points, whichever is greater. Each significant student subgroup at a school also is expected to meet an API growth target (the distance between the subgroup’s prior–year API and 800, or a gain of 5 points, whichever is greater). A subgroup is significant if it consists of: (1) 100 or more students or (2) at least 50 students making up at least 15 percent of the school’s student population. Subgroups exist for African American, American Indian/Alaska Native, Asian, Filipino, Latino, Pacific Islander, White (not of Hispanic origin), economically disadvantaged, English learner (EL), and special education students.
Support for Low–Performing Schools
State school improvement programs are voluntary and focus directly at the school site level. The state provides schools that have chosen to participate in these programs with limited–term funding for planning, technical assistance, and support. In exchange, participating schools agree to greater state oversight and the risk of state–imposed sanctions if they fail to meet specified program requirements. Schools that have chosen not to apply or otherwise have been deemed ineligible are not subject to direct state monitoring or sanctions regardless of their performance.
To date, the state has funded three school improvement programs for low–performing schools struggling to meet state performance targets: the Immediate Intervention for Underperforming Schools Program (II/USP), the High Priority Schools Grant Program (HPSGP), and the Quality Education Investment Act (QEIA). The II/USP was established as part of the PSAA in 1999. Three years later, HPSGP was established with the intent to replace II/USP. Compared to II/USP, HPSGP gave priority to lower performing schools along with higher funding levels. The state began phasing out II/USP in 2005 (though some II/USP schools remain in some stage of state monitoring or sanctions). An additional state school improvement program, QEIA, was created in 2006. Like HPSGP, it gave priority to lower performing schools but with even higher funding levels. Figure 1 summarizes basic information for these programs, discussed in more detail below.
Figure 1
State School Improvement Programs |
|
II/USP |
|
HPSGP |
|
QEIA |
Program Components: |
|
|
|
|
|
Entrance criteria |
Schools in bottom five deciles. |
|
Schools in bottom two deciles. |
|
Schools in bottom two deciles. |
Program requirements |
Develop and implement action plan for up to three years. |
|
Develop and implement action plan
for up to four years. |
|
Implement six specific strategies for seven years. |
Exit criteria |
Meet annual API growth targets each year. |
|
Make at least one point of API growth and meet annual API growth target two out of three years. |
|
Exit in seven years if all implementation requirements are met, as well as meet annual API growth target during first three years (on average) and each year thereafter. |
|
II/USP = Immediate Intervention for Underperforming Schools Program, HPSGP = High Priority Schools Grant Program, QEIA = Quality Education Investment Act,
API = Academic Performance Index. |
Entrance Criteria. Although the three state programs have somewhat different entrance criteria, they all are based on API statewide rankings. As shown in Figure 1, schools in the bottom five deciles were eligible for II/USP, whereas schools in the bottom two deciles are eligible for HPSGP and QEIA. Participation in one state school improvement program (or the federal school improvement program) does not preclude a school from participating in other school improvement programs.
Program Requirements. Schools participating in these programs must implement reform strategies to improve student outcomes. Schools in II/USP and HPSGP develop and implement a local school reform plan with the help of outside technical assistance providers. Schools in QEIA, on the other hand, must implement a uniform set of improvement strategies, including class size reduction, teacher and principal training, and adding counselors to high schools.
Exit Criteria. In general, participating schools that show consistent improvement during implementation exit the program. Figure 1 shows the specific exit requirements for each state school improvement program. Schools in II/USP were required to meet annual API growth targets each year. However, HPSGP and QEIA schools have more latitude in meeting API requirements. In addition, QEIA schools must comply with six specific implementation requirements, as well as four interim requirements, throughout the seven years of the program.
Sanctions for Failing to Improve
Schools that fail to meet exit criteria but make some progress are placed “under watch,” while those who fail to make any progress become “state monitored.” While under watch, schools have no specific requirements, however, their progress is reviewed annually to determine if they should remain under watch, exit, or become state monitored. Under state monitoring, the Superintendent of Public Instruction recommends, and the State Board of Education (SBE) approves, sanctions for failing schools. The most common sanction is requiring schools to contract with a School Assistance and Intervention Team (SAIT). If schools continue to show no improvement, they may receive more severe sanctions. Only six schools have received further sanctions—three were assigned a trustee with the power to override local governing board actions and three were required to contract with a new SAIT provider at their own expense.
Federal System
In contrast to the state’s school–centered system, the federal system supports and sanctions both schools and districts. The federal system also applies to county offices of education (COEs) that operate special education and alternative education programs. In these cases, COEs are treated the same as districts. (For simplicity, in this section, we generally use the term “district” to apply to both districts and COEs.) The federal system is based on the NCLB Act of 2001. The cornerstone of this system is “adequate yearly progress” (AYP), intended to measure if schools and districts are meeting performance targets for all students. Similar to the state system, the federal system has annual performance targets, planning and support for low performers, and sanctions for those failing to improve.
Performance Measures and Expectations
Schools and districts are required to annually meet AYP, which measures success on four specific indicators, described below:
- Percent Proficient. This indicator measures the percentage of students that score at “proficient” or above on STAR assessments in English Language Arts (ELA) and math. The indicator applies to schools and districts as well as to each numerically significant subgroup (same subgroup definition as state) within a school or district. Allowed discretion under NCLB, California has defined a score of 875 on STAR assessments as proficient. The expectation is that all students will reach proficiency by 2013–14.
- Participation. The AYP requires at least 95 percent of students to be tested on each subject. This indicator applies to a school’s and district’s students overall as well as to each subgroup.
- Graduation Rate. The AYP requires schools and districts to reach a graduation rate of at least 84 percent by 2013–14. This indicator applies only to high schools and high school districts.
- API. The AYP requires each state to adopt an “additional” performance indicator. California chose to use API as its additional indicator. (This is the same indicator that is used for state purposes.) By 2013–14, all schools and districts are expected to reach an API score of 800 or above.
Counting all school and subgroup measures, the AYP consists of 46 performance targets.
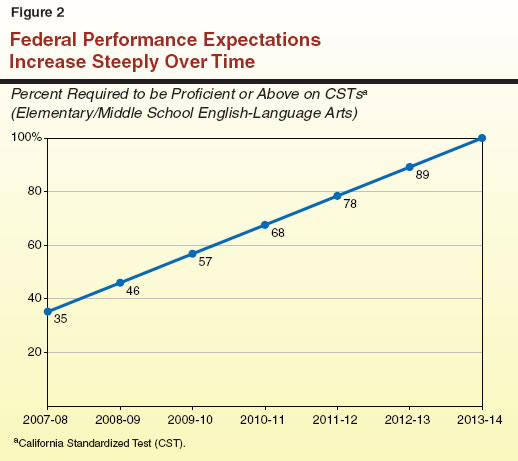
Annual Targets. Schools and districts that have yet to reach all the performance expectations set forth by the state under NCLB are to meet annual AYP targets. The state has established annual AYP targets for the percentage of students required to score at proficient or above on STAR assessments in ELA and math. As shown in Figure 2 (see next page), in 2007–08, 35 percent of students are expected to score proficient or above in ELA for elementary schools. This target will increase by about 11 percent each year until all students are expected to be proficient in 2014. Although not shown in Figure 2, the annual targets for the percent of students required to be proficient in math for elementary schools are very similar, as are the ELA and math targets for high schools. The state also has annual graduation targets (set at 83.1 percent for all schools in 2007–08) that will increase by 0.1 percent annually. However, this requirement also can be met by simply improving high school graduation rates from one year to the next. Similarly, the state has set annual targets for API but allows schools and districts to satisfy the requirement if at least one point of growth on the API is made. The annual API target is set at 620 for all schools in 2007–08 and increases by 30 API points each year.
Support for Low–Performing Schools and Districts
To date, the federal government has funded two school improvement programs—Comprehensive School Reform (CSR) and Program Improvement (PI). The federal government also requires the state to intervene in districts that fail specific Title III performance expectations for EL students, though it does not have a dedicated funding stream for this purpose. (We discuss Title III requirements in the nearby box.) The CSR provided five cohorts of schools with grants to do comprehensive research–based reform between 1999–00 and 2006–07. The CSR was a school–based program tightly linked to state improvement efforts. In fact, the first two CSR cohorts overlapped with II/USP, while the last two cohorts overlapped with HPSGP.
In contrast to CSR, PI encourages states to focus on district accountability and relies on districts to work with individual schools to implement reforms. In contrast to the state’s voluntary school improvement programs, the federal system mandates all Title I schools and districts to participate in PI if they fail to meet performance expectations. While in PI, schools and districts receive technical assistance and support, along with sanctions if progress is not made. In addition, the federal government recently awarded California a School Improvement Grant (SIG) to help districts intervene in the neediest PI schools.
Entrance Criteria. Under the federal system, schools and districts that fail to meet performance targets for two consecutive years enter PI. Title I schools enter PI after failing to meet the same indicator or any AYP indicator in the same content area for two consecutive years. For example, a school would be identified for PI if it failed to meet its graduation requirement for two consecutive years or its math achievement target in one year and its math participation requirement the next year. In comparison to schools, districts enter PI only if they fail the same indicator or an AYP indicator in the same content area for all grade–spans for two consecutive years. For example, a district would be identified for PI if it failed to meet its graduation requirement for two consecutive years or if it failed to meet its ELA achievement target for EL students for all grade spans in one year and its ELA participation requirement for special education students in all grade spans the next year.
Program Requirements. Figures 3 and 4 show program requirements for schools and districts, respectively. Upon entering PI, both schools and districts must conduct a self–assessment and develop a reform plan with the help of a technical assistance provider. Districts identified for PI receive technical assistance through a regional support system, the Statewide System of School Support (S4), for two years. The S4 also provides support to non–PI districts with PI schools. In turn, districts provide technical assistance and support for PI schools to develop and implement a two–year improvement plan. As part of the reform plan, PI schools and districts must reserve 10 percent of their Title I funds for professional development. Although schools and districts are subject to the same planning requirements, PI schools have two additional requirements. As shown in the top half of Figure 3, students attending a PI school must be given the option to transfer to a higher performing school within the district. Schools entering their second year in PI also must make supplemental services available to low–income students who score below the proficient level on STAR assessments.
Figure 3
Requirements for Schools in Program Improvement |
Initial Program Requirements |
Year 1: School Choice |
✔ Develop a two-year improvement plan. |
✔ Use 10 percent of Title I funds for professional development focused on
school improvement. |
✔ Provide students with the option to transfer to any other school in the school district and pay the transportation costs. |
Year 2: Supplemental Services |
Year 1 requirements plus: |
✔ Use Title I funds to provide tutoring/after school programs from a
state-approved public or private provider. |
Sanctions |
Year 3: Corrective Action |
Year 1 and 2 requirements, plus district must do one of the following: |
✔ Replace staff responsible for school’s performance problems. |
✔ Implement new curriculum. |
✔ Significantly decrease management authority at school level. |
✔ Appoint an external expert to advise school. |
✔ Restructure internal organization of school. |
Years 4 and 5: Restructuring |
Year 1, 2, and 3 requirements, plus restructuring. Restructuring options include: |
✔ Reopen school as a charter. |
✔ Replace most of the school staff. |
✔ Hire private management company to operate school. |
✔ Turn the operation over to California Department of Education. |
Exit Criteria. To exit PI, both schools and districts must meet all AYP requirements for two consecutive years. This means meeting up to 46 possible performance targets depending on the number of a school’s or district’s significant subgroups. (The same exit criteria apply to districts and schools even though they have different entrance criteria.)
Title III Requirements
Title III of the No Child Left Behind Act (NCLB) Act funds supplemental services for English learner (EL) students. As with Title I, federal law requires states to hold districts receiving Title III funds accountable for student achievement. (Title III also applies to direct–funded charter schools, consortia of smaller districts, and county programs. For simplicity, in this box, we use the term “district” to refer to any of these local education agencies.) Below, we describe specific Title III district improvement requirements.
Performance Measures and Expectations. The State Board of Education established the following three Title III performance expectations for districts:
- EL Students Must Make Annual Progress in Learning English. Each year, an increasing percentage of a district’s EL students must make gains on the California English Language Development Test (CELDT).
- EL Students Must Attain English Proficiency. Each year, an increasing percentage of a district’s EL students must score proficient on CELDT. (This expectation applies only to (1) the subset of a district’s EL students who were close to achieving English proficiency in the prior year or (2) EL students who have been attending schools in the United States for at least four years.)
- EL Students Must Meet Adequate Yearly Progress Requirement. Each year, an increasing percentage of a district’s EL subgroup must score proficient or above on the state’s English Language Arts and math assessments. This requirement is the same as the one that applies under Title I.
Requirements for Low–Performing Districts. Unlike Title I, the federal government has not established a separate school improvement program under Title III. States, however, are required to intervene in districts that fail to meet Title III performance expectations. Specifically, a district that fails to meet one or more performance expectations for two consecutive years must design a reform plan that addresses its EL issues. If a district fails to meet performance expectations for four consecutive years, it must revise its reform plan as well as modify its curriculum, program, and method of instruction for EL students.
Funding and Participation. Although the federal government does not explicitly require states to set aside funding for Title III improvement efforts, federal law allows states to use a portion of their Title III grant to support improvement activities. The CDE has set aside $1.8 million in Title III funds in 2007–08 for 11 designated county offices of education to provide technical assistance to struggling districts. Currently, 277 districts (or roughly one–half of districts receiving Title III funds) have failed to meet Title III performance expectations. Almost 100 of these districts have failed to meet performance expectations for four consecutive years. |
Sanctions for Failing to Improve
Districts and schools that fail to meet performance targets after being in PI for two years are subject to federal sanctions. Districts enforce school sanctions whereas the state enforces district sanctions.
School–Level Sanctions. Each year that a school fails to make AYP results in additional program requirements. As shown in the bottom half of Figure 3, districts must choose among five corrective actions for schools entering their third year in PI. After four years of being in PI, federal law requires districts to undertake a major restructuring of the school (planning for the restructuring occurs in year 4 and implementing the restructuring occurs in year 5). In addition to the four restructuring options listed in Figure 3, federal law gives districts the flexibility to implement any other major restructuring of the school’s governance (such as reconstituting the school into smaller autonomous learning communities or narrowing the grades served at the school sites).
District–Level Sanctions. As shown in Figure 4, the state must choose one of six corrective actions for districts entering their third year in PI. The state can choose the seventh corrective action only in conjunction with another action.
Figure 4
Requirements for Districts in Program Improvement |
Years 1 and 2: Planning |
✔ Develop or revise district plan. |
✔ Use 10 percent of Title I funds for professional development focused on school improvement. |
Year 3: Corrective Action |
The State Board of Education must impose one of the following sanctions on a district: |
Defer programmatic funds or reduce administrative funds. |
✔ Institute a new curriculum. |
✔ Replace school district personnel. |
✔ Remove schools from jurisdiction of school district and establish other public governance supervision. |
✔ Appoint a trustee in place of the superintendent of local school board. |
✔ Abolish or restructure the school district. |
✔ Authorize students to transfer to other school districts. |
Funding and Participation in School Improvement Programs
In this section, we describe how each state and federal program is funded, identify overall investment in these programs, and track program participation over time.
Funding for School Improvement
Funding Allocations for State Programs. State school improvement programs provide fiscal incentives for schools to participate. Figure 5 lists the funding levels for schools in each phase of each state program. Schools that are in multiple programs receive planning and implementation funds from each program. Schools placed under watch can receive an additional year of implementation funding if participating in HPSGP. State–monitored schools all receive the same level of funding for sanctions.
Figure 5
Funding for State School Improvement Programs |
|
II/USP |
HPSGP |
QEIA |
Phase of Program: |
|
|
First-year
planning/start-up |
$50,000 |
$50,000 |
Two-thirds of per pupil implementation rates (below) |
Implementation |
$200 per pupil
for three years |
$400 per pupil
for three years |
$500 (K-3), $900 (4‑8), $1,000 (9‑12) per pupil for six years |
Under watch |
— |
One additional year
of funding |
Unspecified |
State monitoring |
$75,000 to $100,000
for SAIT, $150 per pupil for three years |
Same as II/USP |
Same as II/USP |
|
II/USP = Immediate Intervention for Underperforming Schools Program, HPSGP = High Priority Schools Grant Program, QEIA = Quality Education Investment Act, SAIT = School Assistance and Intervention Teams. |
Funding Allocations for Federal Programs. The NCLB requires states to set aside 4 percent of their Title I grants to support school improvement efforts. Currently, the state provides Title I set–aside funding to PI districts but not directly to PI schools. Specifically, the state provides PI districts with grants of $50,000 plus $10,000 per Title I school. These funds are for districts to develop a reform plan. The state does not provide PI districts with implementation funding. In contrast to PI districts, PI schools must implement program requirements and sanctions using base Title I funding.
State Investment in Interventions. Since 1999–00, California has spent almost $2 billion for state school improvement programs (see Figure 6). The sharp increases in state funding in 2002–03 and 2007–08 are explained by the introduction of HPSGP and QEIA, respectively. For 2008–09, the Governor proposes spending more than $500 million for school improvement—$107 million for HPSGP and $402 million for QEIA.
Federal Investment in Program Improvement. Since 1999–00, the state has spent more than $500 million in federal funds to support school improvement efforts (see Figure 6). In the last few years, however, the state has been unable to spend all its allotted funds. Thus, $18 million in carryover funds will revert to the federal government if unspent by September 2008 and approximately $29 million is in danger of reverting if unspent by September 2009.
Figure 6
State and Federal Investment in School Improvement Programs |
(In Millions) |
|
Expenditures |
|
State |
Federal |
1999‑00 |
$21a |
$14 |
2000‑01 |
57 |
14 |
2001‑02 |
167 |
23 |
2002‑03 |
325 |
115 |
2003‑04 |
319 |
122 |
2004‑05 |
249 |
148 |
2005‑06 |
197 |
80 |
2006‑07 |
219 |
40 |
2007‑08 |
413a |
33a |
Totals |
$1,967 |
$589 |
|
a Reflects estimated rather than actual expenditures. |
Participation in School Improvement Programs
Participation in State Programs. Figure 7 shows participation in each state school improvement program. The state has funded roughly 2,900 school improvement efforts since 1999. Given many schools participate in more than one school improvement program, somewhat fewer school sites have been funded (2,300). This means one in four schools have received funding from two school improvement programs. Approximately 1,000 schools currently participate in a state school improvement program.
Figure 7
Participation in State School
Improvement Programs |
Number of Schools as of 2007-08 |
|
II/USP |
HPSGP |
QEIA |
Phase of Program: |
|
|
|
Implementing |
— |
495 |
488 |
Under watch |
6 |
53 |
— |
State monitored |
50 |
61 |
— |
Exited |
1,232 |
549 |
— |
Total Schoolsa |
1,288 |
1,158b |
488 |
|
a Reflects every school funded under each program (represents duplicated count). |
b Includes 290 II/USP schools that also received funding from HPSGP but were not subject to HPSGP requirements. |
II/USP = Immediate Intervention for Underperforming Schools Program, HPSGP = High Priority Schools Grant Program,
QEIA = Quality Education Investment Act. |
Participation in Federal Programs. Since 2002, a total of 2,922 schools and 189 districts have participated in the federal PI program. Currently approximately 2,200 schools and 187 districts are in PI (see Figure 8). Of these PI participants, 1,300 schools and 97 school districts (including one COE) face corrective actions for failing to meet performance targets over several years. The number of schools and districts in PI is expected to grow every year as AYP proficiency targets increase and become more difficult to reach. In 2008–09, an additional 551 schools and 106 districts are at risk of entering PI. The California Department of Education (CDE) estimates that virtually all districts will be in PI by 2013–14.
Figure 8
Participation in
Federal Program Improvement (PI) |
As of 2007-08 |
|
PI Schools |
PI Districtsa |
Year 1 |
428 |
38 |
Year 2 |
471 |
52 |
Year 3 |
281 |
97 |
Year 4 |
417 |
— |
Year 5+ |
592 |
— |
Totals |
2,189 |
187 |
|
a Includes county offices of education (six in year 1, four in year 2,
and one in year 3). |
Large Overlap in Participation. Much overlap exists among state and federal program participants. Currently, about two–thirds of HPSGP schools and the vast majority of QEIA schools (86 percent) also participate in federal PI. Approximately one in three PI schools also participate in a state school improvement program. In addition, many schools currently participating in a school improvement program have previously participated in another program. For example, of the schools currently in QEIA, 95 percent have previously participated or are participating in another school improvement program.
Dual System Riddled with Problems
In this section, we discuss several shortcomings with California’s current approach to intervention. As listed in Figure 9, we think California’s dual system suffers from eight major problems.
Figure 9
Eight Major Shortcomings of
Dual School Improvement System |
|
✔ Having two sets of performance measures and expectations sends mixed messages to schools. |
✔ State decile rankings mask large differences in school performance. |
✔ Federal indicators of progress mask large differences in school performance. |
✔ School-based approach to reform shown to be ineffective. |
✔ School-based approach ignores critical role of districts. |
✔ School-based approach is unsustainable. |
✔ Having multiple interventions is confusing and can be counterproductive. |
✔ Neither state nor federal funds tightly linked to reform. |
Having Two Sets of Performance Measures and Expectations Sends Mixed Messages. As a result of California’s dual system, schools have their performance measured using both API and AYP scores. Moreover, these two measures are linked to different sets of expectations. For state purposes, California expects schools and subgroups to reach an API score of 800 and sets annual benchmarks that vary depending on current achievement levels. By contrast, for federal purposes, California expects schools to get students to reach a score of 875 and has set annual benchmarks for the percentage of students required to reach that score regardless of current achievement levels. In 2007, 40 percent of schools met accountability targets under one system but not the other—meaning a considerable percentage of schools demonstrate adequate performance under one system but are deemed failing under the other system.
Decile Rank Masks Large Differences in Performance. The use of decile rank for determining eligibility for state school improvement programs assumes that all low–decile schools are failing to progress quickly enough and need to change their reform approach. Schools with a low–decile rank, however, have highly variable growth patterns. For example, one in ten schools that were ranked in deciles 1 and 2 in 2004, made average annual gains over the subsequent three years of 38 or more API points. In contrast, one in ten schools made virtually no progress over the same period. The use of decile rank alone to determine eligibility for state interventions, therefore, fails to distinguish between those schools that are making significant gains in achievement and those that have demonstrated little or no progress.
AYP Masks Large Differences in Performance. Even more crude than decile rank, the federal performance measure also fails to make important distinctions among schools. By labeling schools as failing if they miss only one performance indicator or all 46 indicators, AYP masks the large variance in student achievement among PI schools. For example, some schools have been identified for PI because they failed to test at least 95 percent of their special education students, whereas others have been chronically failing most of their subgroups on ELA, math, and graduation indicators. The API scores for schools in PI also vary significantly—ranging from 572, well below the states performance expectation, to 820, solidly above the state’s target. In short, AYP does not distinguish between schools that are performing dismally on virtually every count and those that are among the state’s top performers.
School–Based Approach Found Not to Work. Independent evaluations of state school improvement programs show that participating schools generally do not perform better than nonparticipating schools. In the final evaluation of HPSGP (conducted by the American Institutes for Research [AIR] and released in 2007), researchers found no substantial difference in student performance between HPSGP schools and similar non–participating schools. Researchers reached similar conclusions in the final evaluation of II/USP.
School–Based Approach Ignores Critical Role of Districts. One major finding in the evaluations of HPSGP and II/USP was the limited role districts play in state school improvement programs. All of the state’s school improvement programs (II/USP, HPSGP, and QEIA) hold participating schools directly accountable to the state for improving student achievement. However, district leaders make important funding and management decisions that can help or hinder the ability of schools to improve student achievement. For example, districts hire and assign school administrators and teaching staff, negotiate the terms of collective bargaining agreements, and determine how to distribute discretionary resources. Districts also provide critical support, such as selecting curriculum and instructional materials, building/maintaining student assessment systems, and offering professional development. In short, districts control many critical decisions that can affect school improvement efforts.
School–Based Approach Unsustainable. A more practical concern about a school–based approach to intervention is the shear number of schools likely to be targeted for improvement in the near future. Currently, more than 1,000 schools are in some stage of a state school improvement program. In addition, approximately 2,200 schools are in some stage of federal PI, with the number projected to increase significantly over the next several years. The large number of schools being identified for improvement calls into question the state’s capacity to respond directly and provide adequate oversight of school–site improvement activities.
Having Multiple Interventions Is Confusing and Can Be Counterproductive. Another problem with California’s dual system is that it results in multiple types of school improvement efforts that must be implemented simultaneously. As mentioned above, substantial overlap exists among programs, with approximately 70 percent of HPSGP schools, 90 percent of QEIA schools, and one–third of PI schools participating in more than one intervention program. Although all programs have the goal of helping schools improve, each uses different strategies. Thus, schools in multiple programs must comply with multiple sets of rules. These multiple planning requirements, interventions, and exit requirements create a patchwork of conflicting messages for schools. For example, a school could be required simultaneously to implement an HPSGP school reform plan, class–size reduction under QEIA, and a PI restructuring plan. Schools also can exit from one set of interventions only to find themselves entering a new set of interventions under a different program.
Neither State Nor Federal Funds Tightly Linked to Reform. Providing short–term dollars to low–performing schools implies the need for strategic investments in short–term activities likely to have a long–term payoff. For example, funds could be used for activities that help cultivate a reform culture that fosters continual feedback and improvement. The evidence from AIR’s case studies suggests that this kind of strategic approach to reform is not broadly reflected in actual school improvement spending. For example, AIR found that personnel–related expenditures (such as instructional coaches, tutors, and collaborative teacher time) were the most common use of HPSGP funds, followed by textbooks and supplies. Similarly, QEIA’s required improvement strategies are largely personnel related. Compared to short–term targeted reform investments, these types of expenditures are much more reflective of routine ongoing school operations.
The Administration’s Plan for 2008–09
Given the shortcomings of the existing dual system, many in the administration, Legislature, and education community have acknowledged the need for a new system. Intended to move toward an improved system, the administration’s 2008–09 budget plan, presented in January, contains some changes to the state’s existing approach to federal program improvement. Although the plan contains some promising components, it leaves intact many of the fundamental problems of the existing system. Below, we describe the Governor’s 2008–09 plan, pulling together all his state–funded and federally funded school improvement and sanction proposals. At the end of this section, we discuss our concerns with his plan.
Administration Proposes Substantial Increase in Spending
As shown in Figure 10, the administration proposes to spend almost $700 million for school improvement programs in 2008–09. This represents a year–to–year increase of $258 million. Of the state programs, the administration proposes reducing funding for HPSGP while increasing funding for QEIA. In addition, the administration’s proposal contains a major expansion of federal funding for school improvement and sanctions.
Figure 10
Components of Administration’s
School Improvement Expenditure Plana |
(Dollars in Millions) |
|
2007-08
Estimated |
2008-09
Proposed |
Change |
Amount |
Percent |
State Programs: |
|
|
|
|
QEIA |
$268.0 |
$402.0 |
$134.0 |
50% |
HPSGP |
145.2 |
107.0 |
-38.2 |
-26 |
Subtotals |
($413.2) |
($509.0) |
($95.8) |
(23%) |
Federal Programs: |
|
|
|
|
Program Improvement |
$26.0 |
$110.0b |
$84.0 |
323% |
School Improvement Fund Grant |
— |
78.1c |
78.1 |
100 |
Subtotals |
($26.0) |
($188.1) |
($162.1) |
(623%) |
Totals |
$439.2 |
$697.1 |
$257.9 |
59% |
|
a Reflects funding for local assistance. |
b Of this amount, $45 million is one-time carryover. |
c Of this amount, $16.6 million is one-time carryover. |
QEIA = Quality Education Investment Act, HPSGP = High Priority Schools Grant Program. |
Reduced State Funding for HPSGP. The Governor’s 2008–09 budget includes $107 million (Proposition 98) for HPSGP. This represents a decrease of $38 million, or 26 percent, from the current year. Part of the reduction ($26 million) is due to schools expected to exit HPSGP. The remainder of the reduction ($12 million) is due to the Governor’s proposal to discontinue funding for schools in state monitoring. Given that nearly three–fourths of schools in state monitoring are also in PI, the Governor proposes to eliminate the duplication and serve these schools only through the federal PI program. Thus, funding for HPSGP in 2008–09 would support only the implementation phase of the program.
Increased State Funding for QEIA. The Governor’s budget also includes $402 million (General Fund) to support the K–12 portion of QEIA. The 2008–09 funding level represents a major program expansion—$134 million or 50 percent—at a time when the Governor is proposing across–the–board reductions to virtually all other K–12 programs.
Expansion of Federally Funded Activities. California also is to have $188 million in federal Title I and SIG funding available for school improvement efforts in 2008–09. Of this amount, $127 million is ongoing and $62 million is one–time. Figure 11 shows the administration’s expenditure plan for federal funds. The administration continues funding for a regional network to support school improvement efforts ($10 million) and planning for districts entering PI ($17 million). Consistent with his HPSGP proposal, the Governor also eliminates federal funding for Title I, II/USP schools in state monitoring. In addition, the administration has two new proposals to support program improvement efforts, discussed below.
|
Figure 11
Administration’s Expenditure Plan for Schools and Districts
in PIa |
|
(In Millions) |
|
|
2007‑08
Estimated |
2008‑09 |
|
|
Proposed |
Description |
|
Ongoing
Funding: |
|
|
|
|
Districts with PI schools in restructuring |
— |
$61.5 |
Competitive grants for districts with PI schools in
restructuring (104 districts with 304 PI schools are
eligible). Funding rates unspecified. |
|
PI districts in corrective action |
— |
38.2 |
Provides funding to 50 districts expected to enter
corrective action in 2008‑09. Funding rates unspecified. |
|
Districts entering PI |
$10.5 |
17.0 |
Provides districts
entering PI with $50,000 base grant plus $10,000 per Title I
school to revise and implement district plan. |
|
Statewide system of school support |
10.0 |
10.0 |
Funds 11 COEs that provide technical assistance to PI
districts and non-PI districts with PI schools. |
|
Schools in corrective action |
6.0 |
— |
Eliminates funding for
Title I, II/USP schools in state monitoring. |
|
Subtotals |
($26.5) |
($126.7) |
|
|
One-Time Funding: |
|
|
|
|
PI districts in corrective action |
— |
$45.0 |
Provides 97 districts entering corrective action in 2007‑08
with $20.99 per pupil (minimum grant of $50,000 for small
districts). Provides 44 districts (those with larger
performance problems) an additional $250,000 for District
Assistance and Intervention Teams. |
|
Districts with PI schools in restructuring |
— |
16.6 |
Competitive grants for districts described above. |
|
Subtotals |
(—) |
($61.6) |
|
|
Totals |
$26.5 |
$188.3 |
|
|
|
|
a Reflects
funding for local assistance. All funding comes from the
Title I set-aside, except funding for districts with PI
schools in restructuring, which comes from the new School
Improvement Grant. |
|
PI = Program Improvement, COE = County
Office of Education, II/USP = Immediate Intervention for
Underperforming Schools Program. |
New–Tiered Intervention Model. The administration plans to use a total of $83 million ($38 million ongoing and $45 million one–time) to implement a new program for PI districts facing corrective action. Under the new program, the state would place districts in one of four possible intervention tiers based on these district’s relative performance problems (see Figure 12). In the tier with the lightest intervention, a district would internally address specific performance problems. By comparison, in the tier with the most intensive intervention, a district would be required to work with a state–assigned external reform team tasked with a comprehensive review of district practices. Under the Governor’s budget plan, all 97 PI districts that entered corrective action in 2007–08, regardless of tier, would receive $20.99 per pupil for unspecified implementation activities. In addition, the 44 districts in moderate or intensive intervention would receive $250,000 for an external reform team (known under the administration’s plan as a District Assistance and Intervention Team). In 2008–09, an additional 50 PI districts are expected to enter corrective action. The Governor’s budget plan does not specify funding levels for these districts. (In addition to being placed in an intervention tier, the plan is based on SBE’s decision to impose the same sanction—fully implementing a standards–based curriculum—on all PI districts now in corrective action. One district, Coachella Valley Unified, will receive an additional sanction—a state trustee.)
Figure 12
Administration’s Proposal for 97 Districts Now in Corrective Action |
(Dollars in Millions) |
Intervention Tier |
Sanction |
Funding |
Districts |
Very lighta |
Amend district plan. |
$20.99 per pupilb for one year |
8 |
|
Fully implement a standards-based curriculum. |
|
|
Internally address specific performance problems. |
|
Light |
Amend district plan. |
$20.99 per pupilb for one year |
45c |
|
Fully implement a standards-based curriculum. |
|
|
Contract with a state-approved technical assistance provider. |
|
Moderate |
Amend district plan. |
$250,000 plus $20.99 per pupilb for one year |
37 |
|
Fully implement a standards-based curriculum. |
|
|
Select state-approved District Assistance and Intervention Team (DAIT) in consultation with
county office of education. |
|
Intensive |
Amend district plan. |
$250,000 plus $20.99 per pupilb for one year |
7d |
|
Fully implement a standards-based curriculum. |
|
|
Use state-assigned DAIT. |
|
|
Adhere to additional monitoring and reporting requirements. |
|
|
Possible additional corrective action as determined by California Department of Education and State Board of Education. |
|
|
a “Other” intervention under administration’s plan. |
b Minimum funding level of $50,000 provided to small districts. |
c Two of these districts will merge as a result of a local unification measure. |
d A state trustee will be appointed to Coachella Unified School District. |
New Federal School Improvement Grant Activities. California also received a new federal grant, SIG, in 2007–08 ($16.6 million), of which none has been budgeted to date. It will receive another large SIG for 2008–09 ($61.5 million). The administration is proposing to provide SIG funds to districts with PI schools using a competitive application process. The CDE estimates that 104 districts with 304 PI schools in restructuring (14 percent of all PI schools) will be eligible to apply under its proposal. Of eligible districts, two–thirds are in PI, and one–half also will be in corrective action. Further information on how funds would be allocated to districts is unavailable.
Shortcomings of Administration’s Plan
The Governor’s plan moves in the right direction by calling for a differentiated approach to district intervention—using specific criteria to determine the intensity of support a district should receive. His plan, however, does not address some major shortcomings in the state’s current approach to school improvement. Below, we raise four specific concerns with the Governor’s 2008–09 plan.
Continues to Fund State Program Shown to Be Ineffective. The Governor’s plan continues to support the implementation of HPSGP. Not only do evaluations show HPSGP has a negligible impact on student achievement, HPSGP also suffers from numerous structural shortcomings. Most importantly, HPSGP focuses on school–level improvement efforts and ignores the critical role of districts, which evaluations have shown affect the success and sustainability of school level improvement efforts. In addition, HPSGP’s current funding approach is flawed. It allows for schools to use funds for ongoing costs rather than requiring schools to use funds for strategic short–term reforms. Two–thirds of HPSGP schools also participate in other school improvement and sanction programs, meaning the state is largely duplicating school improvement efforts.
Proposals for Using State Funds Work at Cross–Purposes. The Governor’s plan also includes a significant expansion of QEIA (increasing funding by more than $130 million) while at the same time cutting base funding for virtually every other K–12 program. As a result, QEIA schools likely would experience net reductions to their base education program while at the same time being expected to implement a major class–size reduction program. We believe such an approach is not only counterproductive but sets QEIA schools up for failure. Moreover, given the vast majority of QEIA schools also are in PI, considerable federal funding is available to support their school improvement efforts.
Expenditure Plan for Federal Funds Not Coherent. The program improvement and corrective action activities proposed by the administration are not well coordinated or integrated into a coherent overarching plan. Many districts would simultaneously receive funding for similar but disconnected activities. Most importantly, districts entering corrective action would be required to participate in a new system of tiered intervention (using Title I set aside funds) while at the same time running a separate program for schools in restructuring (using SIG funds). As a result, districts could be required to implement one set of reform strategies at the district level and a different set of strategies at specific school sites.
Proposal for Districts in Corrective Action Needs Work. We also have several concerns with the administration’s proposal for districts in corrective action. The administration’s per pupil funding amount is based on available one–time funding rather than on the purpose of the funding. In addition, given CDE expects the majority of districts will be in PI by 2013–14, the proposed per pupil funding rates likely cannot be sustained over time. Lastly, the proposed sanctions are not clearly connected with districts’ performance problems. Under the administration’s proposal, all districts in corrective action must institute a new curriculum even if the reason they entered corrective action has little, if anything, to do with their curriculum. For example, some PI districts have entered corrective action solely because of too few students taking state tests.
Moving Forward—Building a Better System
Despite the shortfalls of both the existing dual school improvement system and the Governor’s 2008–09 plan, the state has gained valuable insights over the last few years that can help it overcome the problems with its school improvement efforts and build a better system of support for low–performing schools. Below, we discuss five principles we think should guide the development of a new system. Regardless of the details, we think a system that adheres to these guidelines would be a significant improvement. In the final section, we offer specific recommendations for restructuring the state’s existing system. Although we recommend a notably different system, it remains within the framework of the state’s existing reform approach—assuming intervention in struggling districts can be both an effective and efficient means of fostering improvement.
Five Guiding Principles of Reform
We think the following five principles should serve as the building blocks of any new system.
Dual System Should Be Replaced by Unified System. Having one integrated school improvement system would overcome many of the shortcomings of the existing dual system. A unified system would eliminate confusion over multiple performance measures and create clearer expectations for districts. It also would prevent the duplication of efforts and integrate all school improvement efforts into a single framework.
System Should Be District Centered. A district–centered approach would align decision–making authority with accountability for results. This would give districts incentives to think strategically about how to allocate resources and support struggling schools. Moreover, it would be more sustainable by focusing on about 1,000 districts, rather than close to 10,000 schools.
System Should Distinguish Among Districts Based on the Magnitude of Their Performance Problems. Currently, districts are identified for PI for many reasons, ranging from persistent low student achievement to not testing enough students. By differentiating among districts based on the magnitude of their performance problems, the state can better target districts most in need of assistance.
Level of Support Should Match Magnitude of Performance Problems. Schools and districts enter school improvement programs for various reasons, yet current improvement programs target participants based on the number of years a school has failed rather than the severity of their performance problems. We think the intensity of support should be proportional to the magnitude of the problem. Targeting district assistance based on need would more efficiently use state resources.
Funding Should Support Focused Reform Efforts. Currently, school improvement funds are short–term in nature but are generally used for teachers, coaches, and other ongoing support purposes. The new system should link funding to targeted reform objectives, such as funding reform experts to diagnose root issues, recommend changes to existing resource allocations, and advice during the transition period. Funding should be provided for a short predetermined period of time (three to five years). The advantages of this approach are twofold. First, it sends the message to districts that the state will not provide extra long–term funding for low performance. Second, it requires districts to rethink their use of existing resources and consider changes designed to use existing resources more efficiently and strategically to support student achievement goals.
LAO–Recommended System
With these principles in mind, we recommend the Legislature establish a new system that has six basic features. Below, we describe these features. Recognizing that it will take time to develop such a system, we also discuss transition issues.
Basic Features of New School Improvement Model
Our recommended model is characterized by the following basic features: (1) a new performance measure tied to one set of expectations, (2) new eligibility criteria that would place struggling districts in an appropriate tier of intervention, (3) a new set of reform tasks, (4) a uniform set of exit criteria, (5) a uniform set of sanctions, and (6) funding linked directly to reform activities. Below, we discuss these features in more detail.
Unifying Performance Measures and Expectations. The new system would rely on a measure that determines both a student’s level of achievement and the increase in a student’s learning from year to year. Under the new system, districts would be expected to increase a student’s learning by at least one grade level each year as measured by revised STAR assessments (see nearby box). Such a measure would be compliant with federal law and allow the state to unify the state (API) and federal (AYP) performance measures. This is because the federal government allows the state to use an annual student growth measure in place of the AYP target for the percentage of students required to meet proficiency in math and ELA. The new measure would build performance expectations off of a student’s current performance level (similar to existing API growth targets). We believe the new performance measure would help the state better identify districts in need of improvement as well as help districts better identify schools and subgroups in need of improvement. Fully developing the new measure likely would take some time, however, the state can move forward with using a simpler growth measure (which measures “relative” growth and still would meet federal requirements) in the meantime.
Unifying Eligibility Criteria. Somewhat similar to the administration’s plans we also recommend using more nuanced eligibility criteria to distinguish among districts based on the extent of their underlying performance problems. Specifically, at the district level, we recommend using multiple indicators—including PI status, the number of AYP indicators failed, the number of Title III indicators failed, the number of schools with low performance, the level of district performance, the growth in student performance in the district, and the size and trend of the district’s achievement gap. Based on these indicators, districts in need of improvement would be placed in one of three tiers (see Figure 13). Given that indicators measuring annual student learning and the achievement gap have not been developed, we believe the administration’s proposed criteria could be used during the transition.
Vertical Integration of State Assessments
To measure student–level academic progress over time, the state likely would have to make a few refinements to its assessment system. Specifically, standardized assessments likely would need to be “vertically aligned” and/or grade–level growth would need to be extrapolated from existing test scores. (Vertical alignment refers to aligning the academic content on tests from one grade level to the next grade level to make scores comparable year to year.) Such revision also might require fine–tuning or narrowing the academic content standards included in state assessments. |
Outside Entities Become Increasingly Involved as Performance Problems Worsen. As shown in Figure 13, the tier a district is placed in determines if/how an external entity is involved in the improvement process. Districts would initially enter a tier in their second year of PI (the year prior to potential sanctions) and be evaluated three years later to redetermine placement. (Non–PI districts receiving Title III funds would enter a tier in their fourth year of failing Title III performance expectations.) In addition, non–PI districts with schools in PI restructuring also could enter a tier. In the light intervention tier, in which districts have the fewest and least severe problems, districts would receive funding for a reform agent or small team to help conduct a self–assessment and develop a district reform plan. In the next tier, districts would be required to contract with an external reform team and undergo an intensive review of district practices that might affect school performance. The reform team is primarily intended as a diagnostic, planning, and capacity–building partner that would provide intensive support for three years. The highest tier would require an external reform team with an expanded scope of inquiry (fiscal, managerial, governance, and academic) as well as expanded powers to ensure that district reform plans are implemented.
Figure 13
Summary of LAO’s School Improvement Model |
Intervention Tier |
Entrance Criteria |
Intervention |
Funding |
Light |
Meets at least half of the following criteria: |
Internal reform leader
or team to help district develop or improve reform plan. |
$50,000 per PI school for first year, $33,000 per school for second year, $17,000 per school for third year. |
|
• District failed less than one-third of AYP requirements. |
|
• Districts failed one Title III indicator for at least four consecutive years. |
|
• Less than one-third of its Title I schools are in PI. |
|
• District API score less than 800. |
|
|
• Districtwide, students and subgroups, on average, are gaining at least one year of learning. |
|
|
|
• Achievement gap is small or narrowing significantly over time. |
|
|
Moderate |
Meets at least half of the following criteria: |
External reform team to review district practices and help develop reform plan. |
$50,000 per PI school for first year, $33,000 per school for second year, $17,000 per school for third year. |
|
• District failed more than one-third of AYP requirements. |
|
• Districts failed two Title III indicators for at least four consecutive years. |
|
• More than one-third of its Title I schools are in PI. |
|
|
• District API score less than 750. |
|
|
|
• Districtwide, students and subgroups, on average, are not gaining at least one year of learning. |
|
|
|
• Achievement gap is large and not narrowing significantly over time. |
|
|
Intensive |
Meets at least half of the following criteria: |
SBE—assigned external reform team with local decision-making power. |
$100,000 per PI school for first year, $67,000 per school for second year, $33,000 per school for third year. |
|
• District failed more than two-thirds of AYP requirements. |
|
• Districts failed all three Title III indicators for at least four consecutive years. |
|
• More than two-thirds of its Title I schools are in PI. |
|
|
• District API score less than 700. |
|
|
|
• Districtwide, students and subgroups, on average, are not gaining at least one year of learning. |
|
|
|
• Achievement gap is large and not narrowing significantly over time. |
|
|
|
AYP = Adequate Yearly Progress, PI = Program Improvement, API = Academic Performance Index, SBE = State Board of Education. |
Unifying Exit Criteria. Under the new system, districts demonstrating consistent improvement over a three–year period would exit the program. More specifically, districtwide, students and subgroups, on average, would have to be gaining at least one year of learning. Additionally, districts would need to meet or be making progress towards meeting the statewide API target (800).
Unifying Sanctions. We think a reasonable framework for district–level sanctions already exists in federal law. Under the federal system, districts that fail to make sufficient progress two years after being identified for PI are subject to a host of possible sanctions (see Figure 4). We recommend using this set of sanctions. We believe the reform team working with a district should recommend to SBE the most appropriate sanction. (Unlike a few of the other features of our recommended system, which would take some time to implement, we believe this change could become effective almost immediately.) After three years of working with a reform team, a district would exit the system or be subject to placement in a higher tier with additional sanctions. After prolonged district failure within the system, we recommend additional consequences for those responsible for local decision making, including requiring new local school board elections and new teacher contracts.
Linking Funding With Reform Activities. As shown in Figure 13, funding would be linked to the size and scope of the reform team needed to assist a district. Our cost estimate of one reform leader reflects the cost of an experienced school administrator. The size of a reform team would depend on the severity and pervasiveness of a district’s performance problems. Districts would receive funding for three years. Recognizing that more intensive work is needed in the first year (diagnosing problems and developing a reform plan) and less intensive follow–up work is needed, funding rates would be reduced in each subsequent year. In contrast to existing state programs, we recommend the Legislature not provide short–term funding for “implementation” or ongoing operations. Instead, reform teams should help districts reallocate existing dollars more efficiently.
Budget Plan to Support New System
In this section, we estimate the annual cost of our recommended improvement system. Given available federal funds exceed the estimated ongoing cost of the new system, we also offer various related recommendations for using remaining federal funds for one–time purposes. Figure 14 lays out the various components of our recommended budget plan for 2008–09. As discussed in more detail below, our plan relies solely on federal funding.
Figure 14
LAO’s 2008‑09 School Improvement
Expenditure Plan |
Federal Fundsa (In Millions) |
|
2008‑09
Funding |
Description |
Ongoing Funding: |
|
|
District Intervention |
$105.0 |
Provides roughly 230 districts with short-term funding linked to specific reform activities. |
Statewide System of School Support |
11.8 |
Funds 11 county offices of education that are to provide technical assistance to PI districts, districts with schools in PI, and Title III districts in need of improvement. |
Set aside for 2009‑10 |
11.7 |
Costs will increase in 2009‑10, with 100 additional districts expected to enter intervention. |
Subtotal |
$128.5 |
|
One-Time Funding: |
|
|
Data Quality Initiative |
$60.0 |
|
Local Data Quality |
(44.0) |
Provides approximately $2.50 per pupil to all districts for start-up data-driven instructional improvement activities, including establishing good data use and management practices. |
Local Assessments |
(8.2) |
Funds start-up costs of implementing local assessments. |
CALPADS Preparation |
(7.9) |
Provides districts support in transitioning to CALPADS system. |
Evaluation |
1.0 |
Funds evaluation of new district intervention model. |
Development of New Performance Measure |
0.5 |
Funds first phase of development of new performance indicator that measures student-level achievement over time. |
Subtotal |
$61.6 |
|
Total |
$190.1 |
|
|
a Reflects federal local assistance funding provided under Title I set-aside ($110.2 million), the School Improvement Grant ($78.1 million), and Title III ($1.8 million). |
PI = Program Improvement, CALPADS = California Longitudinal Pupil Achievement Data System. |
Eliminate Funding for HPSGP. In converting to a district–centered system, we think the Legislature should discontinue funding for HPSGP in 2008–09 (for savings of $149 million from the current–year funding level). Under our recommended system, districts still could use reform teams to provide intensive support to individual school sites, but the state would hold districts accountable for the implementation and success of such interventions. Eliminating HPSGP would result in few schools losing support services. This is because the vast majority of schools currently participating in HPSGP also are being served under federal PI, meaning they would continue to receive support in the new system. The few schools who might not qualify for support under the new system would be excluded because of their relative lack of need based on both state and federal performance indicators. (Given the state’s fiscal situation, we also recommend suspending funding for QEIA in 2008–09. Thus, our recommended budget plan for 2008–09 contains no state funding.)
Support New System Entirely With Federal Funds. Given all but a handful of the districts that would enter intervention under our recommended eligibility criteria already are identified for intervention under federal PI or Title III—and have schools already in PI—the new system could be supported entirely with federal funds. After covering the annual ongoing cost of the new system, any remaining federal funds could be used for improvements to local data assessment and feedback systems.
Annual Ongoing District–Driven Cost (Roughly $100 Million). During the first few years of the new system, we estimate annual ongoing cost of intervening in underperforming districts to be roughly $105 million. When the initial cohort of districts exits the program in 2011–12, we estimate annual costs will drop to about $95 million. These estimates are based on recent performance data. (Given some of our recommended performance indicators do not currently exist, we used more readily available indicators for estimating purposes.) To better illustrate how the system would affect specific districts, Figure 15 shows the 2008–09 level of funding and size of reform team for a small subset of districts.
Figure 15
Illustration of LAO’s School Improvement System—
Impact on Ten Districtsa |
2008-09 |
|
Tier |
Number of
PI Schoolsb |
Per School Rate |
Total
Funding |
Coachella Valley Unified |
Intensive |
19 |
$100,000 |
$1,900,000 |
Ravenswood City Elementary |
Intensive |
6 |
100,000 |
600,000 |
Greenfield Union Elementary |
Intensive |
4 |
100,000 |
400,000 |
Santa Ana Unified |
Moderate |
39 |
50,000 |
1,950,000 |
Bakersfield City Elementary |
Moderate |
21 |
50,000 |
1,050,000 |
South Bay Union High |
Moderate |
9 |
50,000 |
450,000 |
Los Angeles Unified |
Light |
304 |
50,000 |
15,200,000 |
Fresno Unified |
Light |
58 |
50,000 |
2,900,000 |
Oakland Unified |
Light |
57 |
50,000 |
2,850,000 |
Kern Union High |
Light |
5 |
50,000 |
250,000 |
|
a Intended to represent districts of various size from various regions of the state. |
b In the intensive tier, districts would receive funding for a full-time reform leader at each Program Improvement (PI) school. In the moderate and light tiers, districts would receive funding for a half-time reform leader at each PI school. |
Annual Ongoing Cost of Regional Support Network ($12 Million). In addition to supporting district reform teams, our budget plan includes ongoing funding for the state’s regional support network. Currently, both Title I and Title III regional support networks are divided into 11 regions. Although the regions are the same for Title I and Title III purposes, the lead Title I and Title III COE is not the same in every region. Given that many Title I districts in our intervention model will need reform agents with expertise in EL issues, we think Title I and Title III networks should be aligned, with experts on Title I and Title III issues working closely together. To this end, the Legislature could encourage collaboration by combining funding for the Title I and Title III networks and requiring the lead Title I and Title III agencies to be housed within the same county office.
Use One–Time Funds to Strengthen Support for Districts ($62 Million). A major component of our budget plan in 2008–09 entails one–time activities intended to foster knowledge of best practices and bolster expertise in conducting education reform. To such end, we recommend investing resources in building local capacity to spur and sustain academic improvement. Below, we discuss our recommendations for using available one–time federal funding to support district reform efforts.
- Data–Driven Instructional Improvement Activities ($60 Million). We recommend the Legislature fund a three–part data quality initiative. For the largest part of the initiative, we recommend providing $44 million (spread evenly across two years) to help all districts establish good data use and management practices. With the one–time funds, districts could contract with data specialists, upgrade data entry software, institutionalize district data procedures, and train administrators—all aimed at ensuring districts input, correct, and verify their student data. This, in turn, would enable districts to provide the state with accurate, reliable data. We also recommend providing $8.2 million (up to $10,000 per district) for districts that are not yet using local assessments to help focus their improvement efforts. These start–up grants would cover the initial costs of installing equipment and software, subscribing to an assessment service, tailoring assessments to local needs, and training teachers on using assessment results to improve their instruction. Lastly, we recommend providing $7.9 million (approximately $8.50 per pupil) to support districts that are not yet participating in the California Longitudinal Pupil Achievement Data System Best Practices program. This program is designed to prepare districts for the launch of the new student data system by ensuring they know what data to provide the state and are able to report those data using precise standardized file formats.
- Developing More Refined Performance Measure ($500,000). California took a first step towards developing a new performance measure in 2007–08 by contracting with Educational Testing Services (ETS) to conduct a study on the feasibility of measuring student–level academic progress over time. In 2008–09, we recommend proceeding with ETS’s recommended “projection model,” which entails little, if any, additional cost, and would provide some benefit. At the same time, we recommend the Legislature appoint a committee to conduct a review of California’s assessment system and performance standards to facilitate across–grade comparisons. This review also is recommended in the ETS report. We recommend directing $500,000 to fund these activities.
- Increase Knowledge of What Works ($1 Million). Evaluations serve to build the empirical case for what works to increase student achievement. We recommend the Legislature continue to support independent evaluations by funding a multiyear comprehensive evaluation of the new system.
Conclusion
During the past decade, school improvement has been a high priority at both the state and federal level. Unfortunately, the two levels of government created two separate school improvement systems. Taken individually, each system has its own inherent flaws. Taken together, they form a labyrinth of duplicative and disconnected program requirements that sends mixed messages to teachers, parents, schools, and districts.
We recommend dismantling the two existing systems and replacing them with a unified system of support for low–performing schools and districts. Under the new system, districts would receive support services that matched their performance problems. Districts with minor problems affecting few students would receive modest levels of support intended to help them strengthen their own reform plans. In contrast, districts with major problems affecting large numbers of students would receive intensive help from an external reform team tasked with comprehensive review of their governance, management, personnel, finance, and academic practices. In all cases, districts would receive funds for reform team members to serve as school liaisons.
Because of the substantial overlap in participation that now exists among state and federal school improvement programs and the substantial federal funding that California now has available for school improvement efforts, we recommend supporting the new system entirely with federal funds. This would allow California to achieve almost $150 million in state savings in 2008–09 while at the same time offering districts a more coherent, streamlined, and sensible school improvement system.
|
Acknowledgments
This report was prepared by
Jaqui Guzman and reviewed by
Jennifer Kuhn . The Legislative Analyst's Office (LAO) is a nonpartisan
office which provides fiscal and policy information and advice to the Legislature. |
LAO Publications
To request publications call (916) 445-4656. This report and others, as well as
an E-mail subscription service , are
available on the LAO's Internet site at www.lao.ca.gov. The LAO is located at 925
L Street, Suite 1000, Sacramento, CA 95814. |
Return to LAO Home Page