Executive Summary
More than 90 percent of the state General Fund revenues come from just three sources—the personal income tax (PIT), the sales and use tax (SUT), and the corporate tax (CT). In the budget year, the administration proposes that these three taxes would generate $92 billion for the General Fund. This total would be much higher—more than $50 billion higher—except for “tax expenditure” provisions in state law. Tax expenditure programs provide credits, deductions, exemptions, and exclusions as a way to accomplish specific policy goals.
The state’s fiscal crisis results largely from a dramatic plunge in revenues from its major tax programs. This report examines the Governor’s General Fund tax proposals for 2008–09 and 2009–10. In addition, to assist the Legislature in balancing the budget, we identify a number of alternative revenue–raising options for its consideration.
Evaluating the Governor’s Tax Proposals
The 2009–10 Governor’s Budget includes six significant changes to the state’s tax programs that would generate $3.2 billion in 2008–09 and $11 billion in 2009–10. Five of the proposals would increase revenues, including temporarily raising the SUT by 1.5 percent, reducing the PIT dependent credit, and imposing the SUT on selected services. The budget also would increase alcohol excise taxes and create a new oil severance tax.
In general, our review indicates the Governor’s proposals score fairly well when assessed based on traditional tax criteria. We think, however, the Legislature should not approve two of the proposals. First, we recommend against the severance tax because the administration has not adequately explained the rationale for its proposal or showed that the overall tax burden for the oil industry in California is too low. Second, we also recommend the Legislature exclude from its budget considerations the Governor’s proposal to impose the SUT on services. While it may make sense for the state to move towards a broad consumption tax (as opposed to a tax on the final sale of tangible goods), the Legislature needs more time than the budget process affords to consider the array of issues that are raised by the proposal.
We also suggest the Legislature attempt to reduce the size of any temporary increase in the SUT. Increasing the statewide rate by 1.5 percentage points, as proposed by the administration, would give California the highest average statewide SUT in the nation and would increase the incentives for tax avoidance.
LAO Options for Increasing Revenues
To assist the Legislature in resolving the 2009–10 budget gap, we developed a list of proposals that would raise more than $5 billion in each of 2009–10 and 2010–11. Our proposed options include eliminating or modifying 12 tax expenditure programs for a savings of $1.7 billion over the next two years. In general, these recommendations are based on our conclusion that these programs lack a strong rationale or are not sufficiently effective or efficient in achieving their stated goals.
We also identify two targeted rate increases—increasing the vehicle license fee (VLF) to 1 percent and a three–year temporary PIT surcharge—that, combined, would raise $3.4 billion in 2009–10 and $3.5 billion in 2010–11. These options could be considered by the Legislature in lieu of any of the Governor’s revenue–related proposals. We believe these proposals have merit, both for tax policy reasons (for example, the VLF increase would result in all property in California taxed at the same rate) and for reducing the net impact of any rate increases on taxpayers (as both the VLF and PIT are deductible for federal tax purposes).
Background
Revenues represent a key part of the annual budget debate, as the level of resources shapes the options available to the Legislature. Annual revenue collections are affected by various factors. Changes in the economy represent a primary influence on both the fluctuations in revenues in the short run and growth of revenues over time. State tax policies—tax rates and the level of credits, deductions, and exclusions allowed in pursuit of specific policy goals—also play a key role in the level of tax revenues available to the state.
Figure 1 displays the proposed level of General Fund revenues for the prior, current, and budget years. As the figure shows, the administration expects General Fund resources in 2008–09 to fall sharply from 2007–08—declining by $11.5 billion in 2008–09 to $91 billion. In 2009–10, revenues are expected to increase to about $98 billion. The revenue declines in the current and budget years compared to 2007–08 would be even larger, except for the budget’s proposal to increase tax revenues by more than $3 billion in 2008–09 and $7 billion in 2009–10.
Figure 1
General Fund Revenues
2009-10 Governor’s Budget |
(Dollars in Millions) |
|
|
|
|
Change From 2008‑09 |
|
2007‑08 |
2008‑09 |
2009‑10 |
Amount |
Percent |
Taxes |
|
|
|
|
|
Personal Income Tax |
$54,234 |
$46,807 |
$47,942 |
$1,135 |
2.4% |
Retail Sales and Use Tax |
26,613 |
27,778 |
33,793 |
6,015 |
21.7 |
Corporation Tax |
11,849 |
10,197 |
10,445 |
248 |
2.4 |
Insurance Gross Premiums Tax |
2,173 |
1,831 |
1,798 |
-33 |
-1.8 |
Alcoholic Beverages Tax |
327 |
599 |
955 |
356 |
59.5 |
Oil Severance Tax |
— |
358 |
855 |
497 |
138.8 |
Cigarette Tax |
110 |
113 |
111 |
-2 |
-1.8 |
Trailer Coach License Fees |
27 |
27 |
27 |
1 |
2.2 |
Horse Racing |
2 |
2 |
2 |
— |
— |
Estate, Inheritance, and Gift Tax |
6 |
— |
— |
— |
|
Subtotals, Major Revenues |
($95,343) |
($87,712) |
($95,929) |
($8,217) |
(9.4%) |
Other Revenues |
$5,995 |
$2,294 |
$1,647 |
-$647 |
-28.2% |
Transfers and Loans |
$1,237 |
$1,111 |
$131 |
-$980 |
-88.2% |
Total Revenues and Transfers |
$102,574 |
$91,117 |
$97,707 |
$6,590 |
7.2% |
General Fund revenues come from many resources. However, revenues from the state’s three largest tax programs—the PIT, SUT, and CT—account for about 90 percent of General Fund resources each year. A wide variety of other sources—including minor taxes, fees, royalties, interest, penalties, and proceeds from the Economic Recovery Bonds—also support the General Fund. Loans and transfers to or from other funds also affect the General Fund total.
Four Major Revenue Sources Are Most Important
Figure 2 provides a brief overview of the four largest revenue programs that affect the state budget. The PIT is the largest single source of General Fund revenues. As the figure displays, the PIT taxes household income. This includes corporate income that is passed through to individuals from partnerships or certain types of corporations. Figure 1 shows the PIT raised $54 billion in 2007–08. Estimated PIT revenues are expected to fall in the current and budget year due to the economic downturn.
Figure 2
Four Major Sources That Affect the State General Fund Budget |
|
What Is Taxed |
Who Pays the Tax |
Tax Rates |
Policy Issues |
Personal
Income Tax |
Wages, salaries,
interest, dividends, business-related income, and capital gains. Some income specifically
excluded. |
Individuals, families, partnerships, sole proprietors, and trusts. Out-of-state residents pay tax on income earned in California. |
Six tax brackets with rates ranging from 1 percent to 9.3 percent, with an additional 1 percent surcharge on
individuals earning more than $1 million. |
Significant volatility over the economic
cycle; high marginal tax rates compared to other states. |
Sales and Use Tax |
Tangible goods, unless exempted by state law. Services are implicitly taxed when they are incorporated into the cost of a good. |
Primarily consumers. Business also pays the tax unless the good is purchased for resale. |
7.25 percent base statewide rate. Cities and counties may add up to an additional
2 percent with voter approval. |
Out-of-state internet sales can escape
taxation; tax base
declining due to greater spending on services. |
Corporate Tax |
Tax includes the
corporate franchise tax, corporate
income tax, and bank tax. All are based on net income. In addition, limited liability entities pay a fee. |
Corporations,
Subchapter S
corporations, and other business
entities. Multistate and multinational corporations pay taxes on their
California share of total income. |
8.84 percent for
regular corporations, 10.84 percent for
financial corporations, and 1.5 percent for Subchapter S
corporations. |
Complex formula used for determining income; difficult to
effectively administer and enforce. |
Property Taxa |
Covers real and
personal property, including land,
buildings, fixtures, and mineral rights. Many categories
excluded from
taxation. |
Owners of residential, commercial,
industrial, agricultural, timberland,
and other types of land. |
1 percent rate on the assessed value of the property, with “add-on” rate to retire bond indebtedness. |
Locals have no
discretion over this major source of revenue; similar properties may be assessed at very different values. |
|
a Although the property tax is a local tax, local property tax revenues going to school and community college districts are used to fund
Proposition 98. |
The SUT revenues represent the second largest General Fund source of revenues. The SUT levies a tax on the purchase of most goods. Consumers and businesses pay the SUT (except when a firm purchases a good for later resale). Services are not directly taxed in California, although services that are incorporated into the cost of a good are indirectly taxed. As Figure 1 illustrates, the budget anticipates SUT revenues rising in 2008–09 and 2009–10, reaching almost $34 billion in the budget year. These increases, however, result primarily from the Governor’s budget proposals for a temporary 1.5 percent increase in the base SUT rate and an extension of the SUT on selected services. Both proposals would begin in the spring of 2009. Without these new revenues, SUT receipts would be lower in 2008–09 and 2009–10 than in 2007–08.
Corporate income also is taxed. As Figure 2 suggests, the CT program is fairly complex, and includes a franchise, income, and bank tax. Income is taxed at different rates for different types of corporations, and California income for multistate and multinational corporations is apportioned to the state based on a formula involving a firm’s payroll, property, and sales both within and outside of California. After falling $1.7 billion in 2008–09, CT collections are expected to increase modestly in the budget year to $10.4 billion.
The fourth major revenue that affects the state budget is local property tax revenues. Although not a state revenue source, these resources directly affect the General Fund because they are used to support K–12 and community college districts as part of the Proposition 98 formula. Proposition 98 sets a minimum funding guarantee for K–14 education based on growth in the economy and General Fund revenues. Once the guarantee is determined, local property taxes going to schools offset a portion of the state’s obligation under Proposition 98. The General Fund pays for the remaining amount. As a result, increases or decreases in property tax revenues affect the General Fund cost under Proposition 98. In 2007–08, local property taxes contributed $14.5 billion to schools and community colleges. Thus, property taxes represented a larger “revenue source” for the state than corporate taxes.
Tax Expenditures Significantly Reduce Revenues
Individuals and businesses often pay considerably less in taxes than the base tax rates would suggest. This is because state law provides a wide variety of tax expenditure programs (TEPs)—credits, deductions, exemptions, and exclusions—that reduce the effective rates paid by taxpayers. These provisions of law are called tax expenditures because they represent a use of the state’s revenues to accomplish specific policy goals, much like direct expenditure programs. Most TEPs, in fact, could be transformed into regular expenditure programs that would be funded annually through the budget. Thus, economists look at TEPs in a manner similar to regular budgetary expenditure programs. Because TEPs are implemented through the tax system, however, they do not receive the annual budgetary reviews experienced by most regular expenditure programs. It is also worth noting that TEPs can be adopted by a simple majority vote whereas direct expenditure programs require a two–thirds vote to fund. Conversely, eliminating or cutting back a TEP requires a two–thirds vote (because this raises taxes) whereas narrowing a direct expenditure program requires only a majority vote. As a result, TEPs are hard to change or eliminate, even if there is not convincing evidence that they are effective and efficient in achieving their objectives.
Tax expenditure reports from the Board of Equalization (BOE) and Franchise Tax Board (FTB) identify almost $50 billion in annual tax expenditures in the PIT, SUT, and CT programs. The actual cost of TEPs is likely considerably higher than this figure, however, because the agencies were unable to estimate the cost of a significant proportion of the exemptions and exclusions due to lack of data. Figure 3 lists a sample of the largest TEPs authorized in state law.
Figure 3
Major Tax Expenditures in California State Tax Laws |
(In Billions) |
Tax Expenditure |
Tax Program |
Description |
Estimated Costa |
Mortgage interest |
Personal income |
Allows a deduction of interest payments on
personal residences from income |
$5.0 |
Food |
Sales and use |
Exempts sales of food for human consumption (except for food in restaurants and other specific situations) |
5.0 |
Employer contribution to pensions |
Personal income |
Excludes employer payments from employee
income for tax purposes |
4.3 |
Capital gains on inherited property |
Personal income |
Exempts from taxation any appreciation in the value of property that occurred prior to death |
4.0 |
Employer contribution to
accident and health plans |
Personal income |
Excludes employer payments from employee
income for tax purposes |
3.3 |
Gas, electricity, water, and steam |
Sales and use |
Exempts most utilities |
2.3 |
Charitable contributions |
Personal and
corporate income |
Allows a deduction for cash and noncash
contributions from income for tax purposes |
2.1 |
Prescription medicines |
Sales and use |
Exempts medicine if prescribed by a doctor or dispensed by a pharmacist |
1.8 |
|
a Personal income tax estimates by Franchise Tax Board for 2007‑08; sales tax estimates by the Board of Equalization for calendar year 2007. |
As the figure suggests, the largest programs “spend” very large amounts of state funds. Two of these are especially costly. The FTB estimates the mortgage interest deduction, which subsidizes the cost of home loans, reduced PIT tax bills of California residents by $5 billion in 2007–08. Likewise, BOE estimates that the SUT exemption for food reduced state revenues by about $5 billion in 2007. Food represents one of several consumption categories that have been exempted from the SUT under the rationale that they are a “basic necessity.”
As Figure 3 illustrates, five of the eight largest TEPs affect PIT. These five programs—deductions for mortgage interest and charitable contributions, exclusions of employer payments for pensions and health insurers, and the exemption of capital gains on inherited property—reduce state revenues by more than $16 billion and account for about half of all PIT tax expenditures. The three SUT tax expenditures—exemptions for food, most utilities, and prescription medicines—are by far the largest SUT tax expenditures, reducing General Fund revenues by about $9 billion in 2007.
Revenue Volatility Appears to Be Increasing
The state relies on the above tax programs to provide an adequate and stable source of funding for the annual budget. Revenues must be sufficient to provide the desired level of services to citizens. A stable source of revenues avoids sudden changes that, in turn, require the state to make significant spending adjustments to balance the budget.
In the last decade, General Fund revenues have become more volatile than in previous years. Figure 4 displays the annual revenue collections for the three major General Fund revenue sources (PIT, SUT, and CT) and local property taxes. As the figure shows, revenues for all four taxes have increased significantly since the early 1980s. Revenues from PIT and property taxes have grown the most over this period, topping $50 billion each in the past few years. Revenues from SUT and CT have grown more slowly.
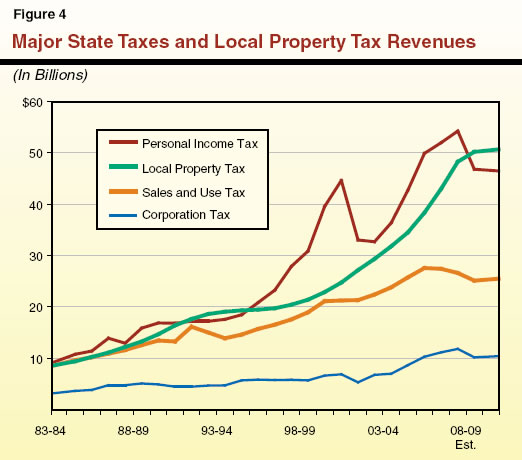
All four of the taxes exhibit some level of volatility. Sales and corporate tax receipts declined somewhat during the recessions of the early 1990s and 2000s. The growth in local property taxes, the most stable of the four tax sources, also slowed significantly during the early 1990s. The growth in property tax receipts, however, has never declined since the enactment of Proposition 13 in 1978. Proposition 13 limits increases in assessed values of properties to 2 percent annually unless they are sold. As a result, property tax revenues increase more slowly than market prices for homes. Because assessed value changes slowly, Proposition 13 also protects the revenue stream from declines in market values.
The PIT, however, has experienced dramatic swings in revenues over the past decade. In 2001–02, PIT revenues declined more than $11 billion, or about 25 percent, from the previous year’s total. The Governor’s estimates for PIT in the current year indicate a reoccurrence of this dramatic decline in base PIT receipts.
The extreme volatility of PIT revenues is a relatively new phenomenon. At the heart of the change is the increased importance of capital gains, stock options, and bonus income as compensation. Net capital gains income, for instance, increased from $21 billion in 1995 to $120 billion in 2000. This five–fold increase in income resulted in about $8 billion in additional General Fund revenues. By 2002, however, capital gains income had fallen to about $33 billion, reducing state revenues by about $6.5 billion compared to 2000.
As noted above, revenue volatility is a problem because it exacerbates the difficulty of crafting budgets during good times and bad. There are two general solutions to this problem. First, the state could maintain large “rainy day” reserves to cushion the reduction in revenues that occurs during recessions. Second, the state could modify PIT rules to reduce size of the revenue swings caused by economic change.
Balancing the 2009–10 Budget
The $40 billion budget gap facing the state results largely from declining revenues due to the sudden downturn in the national economy. In this section we describe and assess the administration’s proposals for increasing General Fund inflows in 2008–09 and 2009–10. We then provide additional revenue options for the Legislature’s consideration.
Governor’s Tax Proposals
As part of the administration’s 2009–10 budget plan, the Governor proposes six significant changes to the state’s tax programs. Of these, five would generate significant new General Fund revenues to support the budget in 2008–09 and 2009–10. The sixth proposal would establish a new income tax credit.
Figure 5 displays the six proposed changes. In total, the changes would generate $3.2 billion in additional revenues in 2008–09 and $11.1 billion in 2009–10. The largest revenue impact would be generated by a temporary 1.5 cent increase in the state sales tax rate. This proposal is expected to yield $2.4 billion in the current year and $7.1 billion in the budget year. The $7.1 billion increase in 2009–10 represents a 28 percent increase. The other proposals raise much smaller dollar amounts, although the alcohol tax proposal represents a substantial increase over the base level.
Figure 5
Governor’s Revenue Proposals |
2008-09 and 2009-10
(Dollars in Millions) |
|
2008-09 |
2009-10 |
2009-10
Amount as a Percent of
Base Revenues |
Temporary sales tax increase |
$2,350 |
$7,114 |
27.9% |
Dependent credit reduction |
— |
1,440 |
3.1 |
Sales taxes on selected services |
272 |
1,154 |
4.5 |
Oil severance tax |
358 |
855 |
—a |
Alcohol tax increase |
244 |
585 |
176.7 |
Film tax increase |
— |
— |
—a |
Totals |
$3,224 |
$11,048 |
12.8% |
|
a There is no "base" revenue for this proposal in the budget year because the tax or credit currently does not exist. |
Three of the six proposals would establish a new tax or credit. The largest of the proposed new taxes is the sales tax on selected services. The current sales tax applies only to tangible goods—services generally are not directly taxed in California. Thus, while the tax on services would be accomplished through the existing sales tax program, we view the services tax as a new program. The oil severance tax and the film tax credit also are not currently part of California’s tax program.
Assessing the Proposals. Later in this section, we discuss each of the Governor’s proposals in detail. First, however, we assess the overall strengths and weaknesses of the proposed package of tax changes. We briefly discuss potential issues raised by the administration’s revenue estimates for the proposals. We also review and evaluate the proposed new taxes and credits against evaluation criteria developed by economists.
Uncertainties in Implementing Proposals
Our review indicates the budget’s estimates of General Fund revenues from the proposals are consistent with the administration’s economic outlook and past taxpayer behavior. Our major concern is with the effective dates of the new taxes.
Behavioral Effects. The estimates recognize that the proposals would affect consumer and business behavior, reducing somewhat the amount of taxes that would be generated by the tax increases. An increase in the sales tax, for instance, raises the total price of most goods. Higher prices, in turn, lower demand for taxed goods, which translates into a reduction in the amount of additional revenues collected by the state. Accordingly, the administration’s estimates of the increase in revenues from the tax proposals have been reduced based on data from research into the price sensitivity (or “elasticity”) of goods. Although accurately estimating the behavioral effects of tax changes can be very difficult (due to data limitations and other factors), we believe the administration has made a reasonable attempt to do so.
Other Revenue–Estimating Uncertainties. The revenue estimates are subject to other uncertainties that could affect the budget—especially the new taxes. Revenues from the oil severance tax, for example, would be directly affected by the price of oil, which has been very volatile of late. The budget assumes oil will cost roughly $50 per barrel during 2009 and 2010. (The federal Energy Information Administration projects the price of oil will average about $51 per barrel in 2009. Thus, the administration’s estimates appear in line with other sources.) At the time this analysis was written, however, the price of oil was about $40 per barrel. If oil stayed at this lower price over the next two years, revenues from the severance tax would be between $200 million and $300 million lower than estimated in the Governor’s budget.
The administration’s other tax proposals also have their own uncertainties. All of the estimates, for instance, contain assumptions about the base level of economic activity that will occur over the next 18 months. The extent of the housing and finance difficulties the economy currently is experiencing introduces major new variables into the forecast, rendering the budget’s assumptions subject to greater–than–usual error.
Implementation. Our largest concern over the revenue estimates, however, stems from the budget’s assumption of a very rapid approval and implementation of the tax proposals. As Figure 5 shows, four of the six tax proposals would take effect during 2008–09. The temporary 1.5 cent sales tax increase and the new tax on services are proposed to take effect in March 2009. The oil severance and alcohol taxes would take effect in February 2009. While it may be possible for BOE to implement the temporary sales tax by March 1, the other timelines are simply not realistic. Failure to meet these budget’s proposed time frames would reduce the amount of revenues generated by these proposals in 2008–09 and, depending on the delay, 2009–10.
Evaluating the Governor’s Tax Proposals
Figure 6 lists the basic questions that should be addressed in assessing the impact of proposed tax changes on the economy, taxpayers, government revenues, and the implementing tax agencies. Below, we discuss these issues in greater detail.
Figure 6
Evaluating Proposed Changes to the Tax System |
|
|
The Economy |
Will the change encourage or discourage
business activity from occurring in the state? |
|
Is the change permanent or temporary? |
|
Does the change address costs or benefits
created by an industry or product? |
Taxpayers |
Will the change distort consumer or business
behavior? |
|
Will the change affect the distribution of the tax burden among taxpayers? |
State Revenues |
Will the change affect government’s ability to
support the desired level of services to citizens? |
|
Do tax deductions or credits that reduce revenues represent an efficient use of scarce resources to accomplish state objectives? |
|
Will the change help produce a more reliable revenue stream over time? |
State Administration |
Does the change present significant implementation, compliance, or enforcement issues? |
The Economy. While all tax changes affect the state’s economy, the specific impact of a given proposal is a critical issue. The state, for instance, wants to prevent its tax policies from discouraging business activity from occurring in the state. This can occur when firms choose to leave or cut back their production in the state or decide not to move to or expand their production in the state. Research has shown that tax policies are only one factor of many that affect business location decisions. Some businesses, however, such as firms operating in low profit–margin markets or companies that can easily relocate, may be more sensitive than others to tax policies. How a new tax affects the business climate and overall economy, therefore, is a major evaluation criterion.
A new tax or tax expenditure (like a credit or deduction), however, may be appropriate if the change accounts for “external” costs or benefits that affect those other than the producing firm or the purchaser of the good or service (economists typically call such side effects “externalities”). The state, for instance, provides a tax credit to reduce the costs associated with business research and development. The rationale for the credit is that these activities generate new products and business that benefits the state economy in the future. In the case of the 2009–10 Governor’s proposals, for example, the higher tax on alcohol may more accurately reflect the societal costs that result from drinking (for example, health and drunk driving–related expenses) and are not “captured” in the price of alcoholic beverages.
The duration of any change to the tax system also is an important criterion. A temporary tax increase, for instance, would have much less long–term effect on the state’s economy compared to a permanent change.
Taxpayers. The issues of how tax changes affect the economy are closely aligned to the question of how the changes affect taxpayers. The impact of a given change will depend on how taxpayers respond to the new policy. Sometimes, however, policies can distort business and consumer choices. The sales tax, for instance, makes goods relatively more expensive than services (which are not taxed). This policy, therefore, unintentionally encourages the consumption of services.
Changes to the tax system also can affect the distribution of the tax burden among the various groups of taxpayers. In general, most economists believe that it is both fair and efficient to tax similarly situated taxpayers in a roughly equal manner (this is known as “horizontal” equity). Most economists and policy–makers also believe that higher–income taxpayers should pay more in taxes than lower income taxpayers (referred to as the “ability–to–pay” principle or “vertical” equity). While economists generally agree that changes to tax policies should promote these equity objectives, significant controversy remains over what constitutes the appropriate distribution of tax burdens.
Revenues. The purpose of taxes is to generate a funding base to support government programs. The impact of changes to the tax system on state revenues and their adequacy to fund needed public services, therefore, is a key issue.
Another criterion that also is important is the efficiency of a particular tax policy. This term refers to how effective and costly a tax provision is in accomplishing its objectives. Tax expenditures, such as deductions or credits, create incentives for specific policy goals. The cost of these incentives, however, may be very high. The state’s mortgage interest deduction, for instance, has a high cost relative to the benefits it generates. This is because the deduction goes to all homeowners who have mortgages, not simply those first–time home–buyers who most need the financial assistance. In addition, the deduction encourages many taxpayers to over–consume housing since the tax advantage makes the cost of housing less expensive. As a result, the mortgage interest deduction, in our view, represents a highly inefficient use of state resources.
Changes also can affect the stability of the tax system’s revenues over time. Revenues reflect economic activity, and thus are affected by business cycles and other economic changes. Some taxes, however, are more sensitive to changes in the economy than others. The PIT has become much more volatile in recent years, for example, as capital gains and stock option income have become major sources of income. This volatility means that state revenues grow more quickly in good times and fall more quickly in bad times—increasing the challenge created by economic slowdowns, as the rapid deterioration in revenues means the Legislature has a larger budget problem to solve. Changes to the tax system, therefore, that promote a more stable revenue stream help reduce this problem.
Administration. The design of the tax system directly affects the ability of the state’s tax agencies (and taxpayers) to implement the state’s tax policies. Simplicity in the tax system is a desired criterion, as it helps to improve compliance and minimize enforcement costs. Ease of implementation also is an important feature. As discussed above, the very rapid implementation of the proposed tax increases would pose a challenge to the state’s tax agencies.
Proposals Rate Well on Traditional Tax Criteria
The revenue increases proposed in the 2009–10 Governor’s Budget fare relatively well using the above criteria.
Business Location Decisions. The taxes proposed by the administration are unlikely to discourage business activity, such as by encouraging businesses to locate outside the state. Research suggests that, in general, the higher dependent credit, oil severance tax, and alcohol tax increase have relatively small impacts on business production decisions. While a sales tax on services could, in many cases, have an adverse impact on location decisions, the repair and entertainment services proposed for taxation by the administration cannot easily be moved out of state once located here.
Externalities. The proposed revenue increases generally get positive ratings for causing relatively few distortions for consumer choices. A smaller dependent credit or new oil severance tax would generally have a minimal effect on a couple’s decision to have children or a company’s decision to produce oil at a given location (at least given current oil prices). A sales tax on all services would actually reduce distortions caused by the current sales tax on tangible goods by establishing uniform taxes for consumption items no matter whether they are goods or services. However, the limited number of services that would be taxed under the Governor’s proposal would probably increase such distortions, for example, by taxing some entertainment services and not others. Finally, the temporary sales tax hike probably increases the distortions created by the existing sales tax, given that it primarily affects tangible goods, but its limited–term nature makes this a modest concern.
Tax Burden. The impact of the proposals on the tax burden is spread across different income groups. The temporary sales tax would fall disproportionately (when measured as a share of income) on lower–income taxpayers, while the film tax credit and the oil severance tax would primarily affect high–income earners. The lower dependent credit and the sales tax on services would affect taxpayers across the income spectrum, with much of the impact felt by middle–income families. The impact of the alcohol tax increase on the tax burden is unknown. As a tax on consumption, it is likely that the tax on services and alcohol would be somewhat “regressive”—but without better data on the alcohol purchasing habits of consumers, we cannot make any definitive conclusions.
Adequacy and Stability. The proposed increases generally promote an adequate and stable revenue stream. For example, all of the permanent taxes would increase and/or diversify the state’s tax base, and therefore, help promote an adequate level of revenues. Also, it should be noted that alcohol taxes have not kept up with the growth in the economy over the past decade, which suggests that revenues from this proposal would not increase along with the growth in population and inflation over time. In addition, the proposals generally would result in a more stable tax base, with the main exception being the oil severance tax. Given the recent swings in the price of oil (which are at least somewhat related to economic activity), the severance tax could make volatility worse.
Administration. The higher sales and alcohol taxes and the dependent credit change would be simple and straightforward to implement. The sales tax on services would involve some new implementation issues, although the administration has selected services (such as golfing) where the state already has a presence (such as taxing goods sold in pro shops). The oil severance tax and the film credit, on the other hand, raise a number of significant implementation problems, which we discuss further below.
Analysis of the Governor’s Tax Proposal
As discussed above, the Governor’s package of tax changes represents a reasonable approach to increasing revenues as part of the administration’s overall budget plan. The specifics of each proposal, however, must be evaluated to determine whether the tax change should be approved. This section contains our assessment of the strengths and weaknesses of the Governor’s proposals.
Temporary Sales Tax Increase
The SUT is levied on the sale of tangible goods. The current rate levied on a statewide basis is 7.25 percent. State and local governments share the revenue derived from the SUT. The largest piece of the SUT, 5 percent, goes to the state General Fund. In 2007–08, the state collected about $26.6 billion in General Fund revenue from the SUT. Two percent of the statewide rate goes to support local governments and one–quarter of 1 percent of the SUT is dedicated to paying off the economic recovery bonds issued by the state in 2004.
The average SUT rate in California is 7.96 percent. This is higher than the statewide rate because of discretionary local increases in the SUT. State law allows up to 2 percent in voter–approved supplements to the local tax rate. As a result, the total SUT rate can vary between 7.25 percent and 9.25 percent. Most cities and counties fall between 7.25 percent and 7.75 percent with relatively few above 8 percent. Figure 7 illustrates the variation in SUT rates across counties.
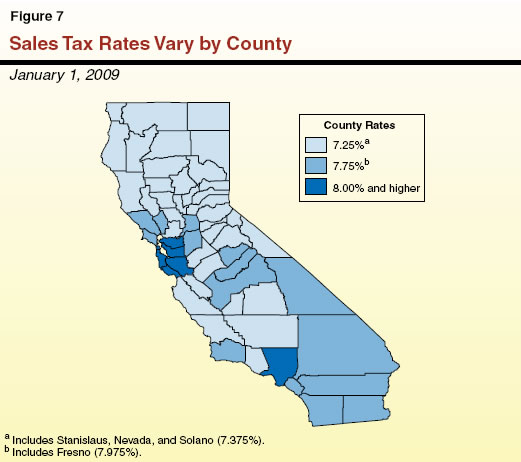
The Governor’s proposal would raise the General Fund portion of the SUT from 5 percent to 6.5 percent for almost three years starting March 1, 2009. This temporary 1.5 percent increase would expire December 31, 2011. Under this proposal, the statewide SUT rate in California would increase to 8.75 percent. In areas with high local add–ons, such as Alameda County (where the current rate is 8.75 percent), the proposed increase would bring the total SUT rate to over 10 percent. The Department of Finance (DOF) estimates the temporary tax would bring in $2.4 billion to the General Fund in 2008–09 (a four–month effect) and $7.1 billion in 2009–10.
Temporary Nature an Important Factor. The temporary SUT hike has strengths and weaknesses from a policy perspective. If this proposal were enacted, the average SUT rate in California would reach 9.46 percent. As shown in Figure 8, this would give California the highest average sales tax rate in the nation. As the figure indicates, California’s rate would be slightly higher than Tennessee’s 9.35 percent average rate. Sales tax rates in Louisiana, Washington, and New York would be somewhat lower. The Governor’s proposal would result in California’s average sales tax rate that is higher than the adjacent states. Oregon, our neighbor to the north, has no sales taxes. Nevada’s and Arizona’s average sales tax rates rate are similar to California’s current average rate.
Figure 8
States With Highest Average
Sales Tax Ratesa |
State |
Rate |
Californiab |
9.46% |
Tennessee |
9.35 |
Louisiana |
8.70 |
Washington |
8.45 |
New York |
8.25 |
|
a Rates include state and local sales tax. |
b Average rate if Governor's proposal is enacted. |
Increasing the sales tax would adversely affect the economy by increasing the total price of products purchased by consumers. For most goods, higher prices would decrease total consumption—ordinarily something to be avoided if possible, particularly in poor economic environments. High SUT rates also create incentives for tax avoidance behaviors, such as cross–border shopping and making purchases over the internet. Since California has no major cities near its neighboring states, it seems unlikely that shopping in other states represents a major issue. Recent research, however, suggests that continued growth of internet shopping makes higher SUT rates in California a concern.
In addition, a SUT rate approaching 10 percent could send a negative signal to businesses considering locating or expanding in California. For instance, businesses pay sales taxes on machinery used to make products (most states do not levy the tax on these business inputs). As a result, the higher rate could further discourage new investment in the state. Although the proposal would have impacts on business, the temporary nature of this increase makes it difficult to assess its long–term effect on the business climate.
Who Would Bear the Greatest Burden? The proposed increase also presents trade–offs when considering the impact on taxpayers. The SUT is broad–based, ensuring that most consumers and businesses would pay the new tax and contribute to resolving the state’s fiscal problems. On the other hand, lower–income individuals spend a larger percent of their income on sales taxes than higher income individuals do. From this view, the burden of a sales tax increase would disproportionately affect lower–income individuals.
Minimize Rate Increases. In general, we think the Legislature should raise revenues by reducing or eliminating inefficient tax expenditures. Given the magnitude of the states’ fiscal problems, however, we recognize that raising rates on selected taxes may be unavoidable. The problems with this specific proposal are clear: the temporary SUT increase would give California the highest average rate in the country and increase the incentive for tax avoidance. In order to minimize the amount of any rate increase, we would recommend that the Legislature exhaust revenue–increasing modifications that would also improve the tax system. Later in this report, we identify ways the Legislature could increase revenues by eliminating TEPs that have not proven to be efficient or lack economic rationale. In addition, we discuss rate hikes for other tax programs (such as the VLF), which if adopted could increase revenues while avoiding such a large increase in the SUT rate.
Dependent Exemption Credit
Current law provides taxpayers with a nonrefundable PIT credit for each dependent. For tax year 2008, the amount of this credit is $309. (The inflation adjustment for tax year 2009 has not been determined yet, but is likely to be close to zero.) This compares to a personal exemption credit of $99 for single taxpayers and $198 for couples. Prior to 1987, the dependent credit was much lower than the personal credit. In 1987, the dependent credit amount was increased to be equal to the personal credit. In 1997, the Legislature tripled the dependent credit.
The 2009–10 Governor’s Budget proposes to permanently reduce the size of the dependent credit to the personal credit starting in tax year 2009. The budget reflects $1.44 billion in new revenue in 2009–10 from this change. Of this amount, $1.28 billion is permanent new revenue and $159 million results from the assumption that taxpayers will not adjust estimated payments or withholding until the last half of 2009.
Little Justification for the Higher Dependent Credit. We included this proposal in the revenue options outlined in our report, The 2008–09 Budget: Perspectives and Issues (P&I). Exemption credits are usually justified on the grounds that people who raise children or care for others incur extra expenses and therefore have less disposable income from which to pay taxes. There is, however, no consensus as to the “right” amount of such a credit. As noted above, prior to 1998, the state’s exemption credit was set at the same level as the personal credit. The Governor’s proposal would reinstate that linkage. We recommend the Legislature approve the proposed reduction in the dependent credit.
Sales Taxes on Services
The current SUT system was established in the 1930s, and was levied on the sale of tangible goods at that time. It was not designed to tax services provided to households (such as home repairs or gardening services). Since that time, services have become a much larger proportion of the economy. State tax data show that spending on taxable goods represents about 40 percent of personal income. This means that consumers spend the majority of income on services.
The Governor proposes to permanently impose a sales tax on a limited set of consumer services beginning in 2008–09. Specifically, the budget would tax vehicle repair, appliance and furniture repair, golf, and veterinarian services, beginning March 1, 2009. The tax on amusement parks and sporting events would begin April 1, 2009. According to DOF, the staggered dates reflect the ability of BOE to implement the expansion to services. The DOF estimates the proposal would result in about $270 million in new revenues in the current year and $1.2 billion in the budget year.
Other States Tax More Services. California taxes very few services. Under current law, a small number of services are taxed in California, but only because of their association with tangible products, such as the cost of alterations if they are done as part of the original purchase of clothing. Forty–one states tax more services than California. Hawaii and New Mexico impose sales tax on virtually all services. Of the states that do tax some services, it is common to tax admissions and repair services, as proposed by the Governor.
Taxing services is not without pitfalls, however. Attempts in Massachusetts, Michigan, and Florida, for instance, to tax a broad range of services resulted in confusion and controversy over the types of services to tax. Ultimately, business opposition convinced these states to repeal their taxes on services entirely. This experience highlights the complex policy issues raised by taxing services.
New Taxes Need Thorough Review. We identify the following concerns with the Governor’s proposal to tax services:
- Potential New Distortions. The proposal would create inequities in the tax structure by taxing some services while leaving other similar services untaxed. For instance, the proposal would tax many services in the entertainment field (amusement parks, sporting events, and golf) but not others (movies, bowling, and arcades). Services that are not taxed would become relatively cheaper compared to those that are taxed, placing the latter firms at a disadvantage.
- Impact on the Economy Is Unknown. Since services are not now subject to the SUT, the proposal would increase the price of the selected services by almost 10 percent (assuming the Legislature approves the Governor’s 1.5 cent increase in the SUT). A price jump of this size could have a large impact on the demand for these services. Unfortunately, little is known about how an increase of this magnitude would affect these industries and the state economy.
- Short Timelines Are Risky. The very tight implementation schedule offers the potential for creating confusion among businesses and the public. The BOE must develop policies to implement the tax. In addition, expanding the SUT would require BOE to train many businesses that currently do not collect SUT to register with BOE and remit tax forms. These tasks require time. If this proposal is rushed, administrative confusion may result.
Despite these concerns, however, the idea of extending sales taxes to services also has positive features. Taxing services could allow the state to reduce the statewide SUT rate, which would lessen the economic distortions created by the tax. Expanding the base of the SUT could improve the overall fairness of the tax structure. Since services are currently not directly taxed, they are relatively less expensive than tangible products. A comprehensive plan to tax services could put services and goods on an equal footing. Additionally, the sales tax base has been eroding over time due to internet purchases and shifts in consumer spending patterns. Taxing services would help ensure SUT revenues grow along with the California economy.
Take Time to Consider Issues Fully. We believe extending the SUT to services makes sense as part of an effort to broaden the tax base and reduce sales tax rates. Establishing this complex new change as part of a budget–balancing package, however, carries too many risks. The need to establish clear and consistent tax policies that minimize the impact of the new tax on the service industry indicates to us that this proposal warrants a more deliberative long–term approach. For this reason, we recommend the Legislature exclude a tax on services from its budget plan.
Proposed New Oil Severance Tax
A severance tax is levied on natural resources as they are extracted or “severed” from the ground, and is typically a flat percentage of the resource’s market value. California is the only one of the top ten oil–producing states that does not levy a severance tax on oil.
The Governor’s budget proposes a new 9.9 percent oil severance tax on most oil produced in California. Under the proposal, “stripper” wells (those which produce less than ten barrels a day) would be exempt from the tax if the price of oil falls below $30 per barrel. The administration estimates that this tax would generate $348 million over the last five months of 2008–09 and $836 million in 2009–10.
Why a Severance Tax? There are several policy rationales that can be made for a severance tax: First and most frequently cited is the idea that the current generation should compensate future generations for the irretrievable loss of a nonrenewable natural resource. Second, a severance tax falls on an immobile factor of production. Since oil fields cannot relocate to another state, taxes have less of an effect on business production decisions as long as owners can earn a reasonable rate of return on their investments. Research suggests that while a severance tax discourages new exploration to some extent, it tends to affect production less than other business taxes do, especially over the first ten years or so that it is in effect. The other rationales are that oil production should, like other economic activities, share in the funding of public goods, and that oil production creates certain negative side–effects (like environmental problems) that should be paid for by producers.
Proposal Not Supported by Rationales. We have several concerns with this proposal. First, the intergenerational fairness rationale only works, for example, if the state were to deposit the revenue from the severance tax into a permanent fund and spend only the interest on this fund every year. In this way, the resource would continue to generate income for future generations, cushioning the blow to the state from the loss of associated income, property, and sales tax revenue long after the oil is used up. A true severance tax also would apply to nonrenewable resources other than oil, such as natural gas and nonfuel minerals. The budget proposal, however, applies only to oil.
In contrast, using revenue from a severance tax to pay for current expenses increases the volatility of the revenue system. Both the severance tax and the other revenues stemming from the oil industry disappear after the oil is gone, and there is no remaining revenue stream to compensate future generations for the loss of the oil.
Second, the administration has not demonstrated that California’s overall tax burden on the oil industry is especially low. While California has no severance tax, it is also one of a few states that taxes oil reserves as property. The proposed 9.9 percent rate also would give California the second highest severance tax in the nation, second only to Louisiana. Given these factors, it is not clear how the proposed tax would affect the industry’s overall tax burden. There is dispute over this issue, and the Legislature may want to request that the administration provide data on this issue.
Third, a 9.9 percent tax rate may more significantly discourage production when prices are low. As this analysis was written, oil prices were about $40 per barrel. Unfortunately, data on producer costs are not available. An example, however, can demonstrate our concern about the interaction between the tax and prices. If the price of oil were $70 per barrel and costs were $30, the severance tax would reduce profits from $40 ($70 in revenues minus $30 in costs) to about $33 ($40 minus a tax of $7). If, instead, oil was $35 per barrel, the tax could soak up most of the producer’s profit, reducing the pre–tax profit of $5 ($35 in revenue minus $30 in costs) to $1.50 per barrel ($5 minus a tax of $3.50). More generally, any oil from a non–stripper well with a current after–tax margin below 10 percent would have an incentive to shut down if a 9.9 percent tax were adopted.
Lastly, the administration has not offered any argument or evidence that the proposed tax is needed to offset environmental costs associated with oil production.
Case for the Severance Tax Is Too Weak. In conclusion, we recommend that the Legislature reject the proposed oil severance tax. The administration has not made a strong case to justify the new tax or demonstrate that the effective rate of taxation of the oil industry in California is lower than in other states. In addition, the proposed tax singles out one class of nonrenewable resources and would likely make the overall revenue system more volatile, not more stable.
Alcohol Tax Increases
State law establishes the alcoholic beverage tax as a per–gallon excise tax collected on the sale, distribution, or importation of alcoholic beverages in California. Established in 1933, rates for this tax were last increased in 1991. Rates differ by type of alcohol. Currently, state law levies a tax of $20 on each gallon of beer and most types of wine and $3.30 for a gallon for most types of distilled spirits. In 2007–08, the alcohol excise tax contributed $354 million to the General Fund.
Taxation as a Way to Address Social Costs. From a policy standpoint, alcohol generates negative social costs (or externalities). Alcohol results in higher long–term health care costs. Alcohol also can be addictive, resulting in rehabilitation costs for those who cannot stop drinking on their own. Alcohol also is responsible for a significant proportion of driving–related injuries and death. The excise tax represents a way for government to address these externalities.
The tax has two types of benefits. First, it makes drinkers compensate society for the alcohol–related health and social services costs borne by government. A federal report from the mid–1990s, if extrapolated to California in today’s dollars, suggests the governmental health and criminal justice costs in California are about $6 billion. Based on data provided in the federal study, state and local governments pay about 40 percent of these costs, or between $2.4 billion and $3.4 billion. The study suggests costs to government that result from drinking probably are far greater than the revenues currently raised by the state excise tax.
Second, the excise tax raises the price of alcohol, discouraging drinking and reducing related societal costs. Research indicates that alcohol price increases reduce drinking and the related externalities. Studies from the United States and other countries indicate that increases in the price of alcohol lower the frequency of disease, injury, and death and reduce alcohol–related crime and violence.
Currently, California generally taxes alcohol at or below the national median rate, although this varies by alcohol type. California’s 20–cent per gallon tax on beer is slightly above the national median of 18 cents. California $3.30 per gallon tax on distilled spirits is slightly below the $3.75 median nationally (18 states directly set the price of distilled spirits, which allows them to “tax” alcohol indirectly). In contrast, California’s 20–cent per gallon wine excise tax is far below the national median of 69 cents. Only two states (New York and Louisiana) impose a wine excise tax lower than California’s.
Governor’s Proposal Would Partially Standardize Rates. The budget proposes to raise the excise tax of each type of alcohol by a “nickel a drink” starting February 1, 2009. The DOF projects that the increase would generate $240 million in 2008–09 and $585 million in 2009–10. The budget also proposes to transfer these revenues to a new Drug and Alcohol Prevention and Treatment Fund. This new fund would pay for substance abuse programs that are currently supported by the General Fund.
The nickel a drink label is a shorthand way of describing the way the administration determined the amount of the proposed increase for beer, wine, and distilled spirits. Specifically, the administration translated the 5 cent per drink increase into a per–gallon rate based on the typical serving size for each type of alcohol. Adding this increase to the existing rate, as shown in Figure 9, yields the budget’s proposed per–gallon tax. For example, the typical serving size of beer is 12 ounces. At 128 ounces in a gallon, there are between 10 and 11 “drinks” of beer in a gallon. The proposed nickel–a–drink increase, therefore, equals 53 cents per gallon. Thus, for beer, the budget proposal would result in a total excise tax of 73 cents per gallon.
Figure 9
Governor's Proposal for Alcohol Excise Tax Rates |
|
|
Tax per Gallon |
|
Serving Size (In Ounces) |
Existing |
Proposed |
Increase |
Percent
Change |
Beer |
12.0 |
$0.20 |
$0.73 |
$0.53 |
265% |
Wine |
5.0 |
0.20 |
1.48 |
1.28 |
640 |
Distilled Spirits |
1.5 |
3.30 |
7.57 |
4.27 |
129 |
Figure 9 illustrates the large percentage increases that are proposed by the administration. The wine excise tax, for instance, would increase 640 percent under the budget proposal. In part, however, this increase is very large because the current excise tax on wine is very low. The percentage change in the tax on beer and distilled spirits are smaller only because they are currently taxed at a higher rate than wine.
Raising Tax Rates Makes Sense… The proposed tax would give California some of the highest excise tax rates on alcohol in the nation—among the top five highest for beer and distilled spirits and the top 10 for wine. Nevertheless, we think the proposal to raise alcohol taxes makes sense. Despite the relatively large increases for all three types of alcohol, the estimated costs to state and local governments of drinking in California would still far outstrip revenues generated by the excise tax. Finally, the apparent increase to consumers of the higher tax would be relatively modest—25 cents for a bottle of wine, 30 cents for a six–pack of beer, and about $1 for a bottle of distilled spirits. For these reasons, we think the Governor’s proposed increase is reasonable.
Our primary concern with the specific proposal is that it fails to correct inconsistencies in the current alcohol tax rates. On a per–drink basis, current law taxes wines the least and distilled spirits the most. The Governor’s nickel–a–drink proposal does not propose to equalize final tax rates. As a result, the excise tax on wine would remain lower than the tax on beer and distilled spirits. The tax on wine would be 5.7 cents a glass while the tax on distilled spirits would be 8.8 cents.
…But Make Excise Taxes Consistent. In our view, the proposed per–drink tax rates have no analytical foundation. As discussed previously, tax programs should treat similar items consistently. To do otherwise creates economic distortions that, in this case, favor one type of alcohol (and one part of the industry) over the others. Without a clear justification for these differences, this disparate treatment is unwarranted.
For this reason, we recommend the Legislature adopt the Governor’s per–drink approach to tax alcohol in a more consistent manner. Figure 10 displays our recommended alternative. As the figure shows, our proposal maintains the budget’s proposed 5.7 cent final tax rate on wine and extends that rate to beer and distilled spirits. Our suggested final rates are 61 cents per gallon for beer and $4.92 per gallon for distilled spirits. Because our rates for beer and distilled spirits are lower than the administration’s, our proposal would generate about $63 million less than the amount proposed in the budget. This difference could be recovered by increasing the total per–drink rate slightly or by adopting other tax changes that would result in additional revenues.
Figure 10
Alcoholic Beverage Excise Tax Proposals |
|
2009-10 Budget Proposal |
|
LAO Alternative |
|
Per Gallon |
Per Drink |
|
Per Gallon |
Per Drink |
Beer |
$0.73 |
6.8¢ |
|
$0.61 |
5.7¢ |
Wine |
1.48 |
5.7 |
|
1.48 |
5.7 |
Distilled Spirits |
7.57 |
8.8 |
|
4.92 |
5.7 |
Film Production Credit
The film industry has always been centered in California. In recent years, however, concerns have been raised that high production costs are driving film production out of the state. In addition, other states and Canada offer subsidies for film production costs. The film industry in California is quite large. In 2007, for instance, employee compensation in the motion picture and sound recording industries totaled $14.6 billion.
The Governor’s budget proposes substantial new personal and corporate income tax credits for the film industry. Specifically, the budget proposes:
- A 20 percent income tax credit for in–state production expenses of films with budgets below $75 million.
- A 25 percent credit in the case of an independent film (defined as a film with a budget of between $1 million and $10 million produced by a firm that is not publicly traded) or a television series returning to California from another state.
For a film to qualify as an in–state production, at least 75 percent of either the budget or the shooting days must be spent in California. Production expenses exclude wages paid to directors, producers, writers or actors (except extras). The total amount of credits available every year would be appropriated through the annual budget, and the state Film Commission would be required to approve qualified firms that apply for the credit on a first–come–first–served basis. The 2009–10 Budget Bill does not include an appropriation for this purpose.
Proposal Has Multiple Problems. The intent of this proposal is to encourage film production to remain in California, or to return to or move to California from another state or country. The administration, however, has not provided a justification for the size of the subsidies being proposed or submitted an analysis of their likely impact on the film industry in California. Given the size of the state’s film industry and the generous proposed subsidies, the new tax credit could prove very expensive. A 20 percent subsidy of the production expenses qualifying under this proposal would probably amount to over $1 billion per year. Since the state would be unlikely to appropriate that much for the program, the commission would have to allocate credits to specific productions. We have several major concerns with this proposal.
- One of the key issues in assessing any targeted business incentive program is: Would the activity have taken place in the absence of the incentive? If the incentive was in fact the deciding factor, the program would at least be accomplishing its stated goal (although there are other issues about whether the subsidies represent the best use of state money). However, if the activity would have taken place even without the incentive, then state subsidies represent a windfall for the firm that receives the incentive. The budget proposes to allocate credits on a first–come–first–serve basis. This would undercut the program’s incentive for production companies to change their location decisions, as it seems likely that the firms who are absolutely committed to producing in California would be among the first to apply for credits—before firms that are considering an out–of–state location. As a result, this proposed credit may be even more likely than most similar programs to create a windfall for committed in–state producers rather than be a deciding factor for otherwise–undecided producers.
- Second, the program would likely create inequities in the way film companies are treated. Because claims would likely be much larger than available funding and the first–come–first–served targeting, some firms would be approved for credits while other equally qualified firms would be denied simply because they did not apply soon enough. This is an example of a “horizontal inequity,” meaning that similarly situated taxpayers would be treated differently.
- Third, it is not clear that the film industry’s situation is unique among industries that produce for a national or international market. If production costs for the film industry are higher here than in some other locations, it is also likely to be true for the electronics, finance, chemicals, and food processing industries. The administration has not made the case that the film industry deserves special treatment because it faces unique challenges that other sectors of the economy do not experience.
For these reasons, we recommend that the Legislature reject the film tax credit proposal. It would arbitrarily favor some film producers over others, and will mostly fund productions that would have been filmed in California in any case. We agree that the state’s business climate is a crucial issue. Rather than singling out individual industries, however, the state should endeavor to create the conditions that permit all businesses to thrive.
LAO Options for Increasing Revenues
Our review of the Governor’s revenue proposals raises a number of issues. To provide the Legislature with additional options for increasing revenues, we developed a list of revenue–raising proposals for 2009–10, summarized in Figure 11. The figure displays our proposals in two groups. The first group summarizes $1.7 billion in existing TEPs that could be modified or eliminated because they lack a strong rationale or are not effective or efficient in achieving their objectives. The second group includes two targeted rate increases—increasing the VLF to 1 percent and a three–year temporary PIT surcharge—that combined would raise $3.4 billion in 2009–10 and $3.6 billion in 2010–11. These rate increases could be adopted in place of any of the Governor’s proposals.
Figure 11
Summary of LAO Revenue Options |
(In Millions) |
|
2009‑10 |
2010‑11 |
Eliminate or Reduce Tax Expenditures |
|
|
Personal Income Tax (PIT) |
|
|
Senior credit |
$190 |
$170 |
Employer contribution for life insurance |
100 |
105 |
Employer-provided parking |
100 |
100 |
Small business stock exclusion |
20 |
20 |
Subtotals |
($410) |
($395) |
Personal Income and Corporation Tax |
|
|
Exclusion for "like kind" property exchanges |
$350 |
$360 |
Enterprise zone subsidies |
100 |
120 |
Subtotals |
($450) |
($480) |
Sales and Use |
|
|
Animal life, feed, seeds, and plants |
$465 |
$475 |
Industry-specific equipment |
145 |
145 |
Specific doctor and veterinarian sales |
80 |
80 |
Diesel fuel exemptions |
75 |
75 |
Custom computer programs |
45 |
40 |
Leasing of films and tapes |
20 |
20 |
Subtotals |
($830) |
($835) |
Totals, Tax Expenditure Programs |
$1,690 |
$1,710 |
Targeted Tax Rate Increases |
|
|
Increase the vehicle license fee to 1 percent |
$1,145 |
$1,170 |
Temporary 5 percent surcharge on PIT |
2,300 |
2,400 |
Totals, Targeted Rate Increases |
$3,445 |
$3,570 |
Totals, All Proposals |
$5,135 |
$5,280 |
As with the administration’s proposals, the implementation timeframe of our 14 recommendations itemized in Figure 11 represents an important feature. All of our proposals are designed to begin at the start of the budget year. This would give the state’s tax agencies sufficient time to implement those of our recommendations that require immediate action so they could go into effect in July 2009—primarily the SUT tax expenditures. As a result, it would be important for the Legislature to act relatively soon on such proposals so that the full amount of our estimated budget–year revenues could be realized.
Tax Expenditure Programs
Our list of 12 tax expenditure proposals includes programs from the PIT, CT, and SUT. Our proposals are outlined briefly below. In several cases, we included proposals in Figure 11 that were in our 2008–09 P&I review of potential revenue raising options. Rather than reproduce these write–ups in their entirety here, we simply provide a summary of our previously discussed rationale. Please see our 2008–09 P&I, page 109, for the complete analyses.
Senior Credit
Background. California grants a yearly nonrefundable PIT credit of $198 to persons age 65 or over. This is double the personal exemption credit provided to other adults.
Proposal. Eliminate the senior credit. Revenue gain of $190 million in 2009–10 and $170 million in 2010–11.
Rationale. Similar to our discussion of the dependent credit, we see no rationale why seniors in general should receive a larger reduction in taxes than other adults. In addition, this TEP adds to other favorable tax provisions of state law for seniors—primarily exempting social security from state taxation. (Please see the 2008–09 P&I for more discussion.)
Employer Contributions for Life Insurance
Background. Employer contributions for up to $50,000 in employee life insurance policies are excluded from the employee’s income for tax purposes. There is a similar deduction available at the federal level.
Proposal. Eliminate this exclusion for state income tax purposes. Revenue gain of about $100 million in 2009–10 and $105 million in 2010–11.
Rationale. This exclusion is intended to encourage firms to offer life insurance to employees. It is not clear, however, why employer–provided life insurance should be favored over other forms of compensation. There is no corresponding exclusion available for self–employed people, so the provision distorts the market by extending benefits to one group but not a similarly situated group. In any case, eliminating the state TEP would still leave the much–more–valuable federal exclusion in place.
Employer–Provided Parking
Background. Employees are not taxed on the value of employer–provided parking spaces. Parking privileges of up to $230 a month are exempt from taxation if the parking space is on or near the employer’s business premises. A similar exemption exists at the federal level.
Proposal. Tax these benefits at the state level. Revenue gain of about $100 million in each of 2009–10 and 2010–11.
Rationale. The current tax code favors employer–provided parking over other forms of compensation. We see no rationale for this benefit. In fact, state subsidies for parking appear contrary to other efforts by the state to discourage solo car commuting and promote less polluting forms of transportation such as carpooling, transit, or bicycling.
Partial Small Business Stock Exclusion
Background. State law excludes one–half of the capital gains earned on the sale of small business stock. To qualify for this benefit, stock must be for corporations that operate in California and must be held at least five years by the taxpayer.
Proposal. Eliminate the exclusion of gains on small business stock. Revenue gain of about $20 million in each of 2009–10 and 2010–11.
Rationale. While this program is intended to reduce the cost of financial capital for small business, it is unknown whether it has any impact on small businesses’ ability to access capital. (Please see our 2008–09 P&I for more discussion. We also discuss this TEP at length in our March 1999 report, The Partial Capital Gains Exclusion for Qualifying Small Business Stock.)
Exclusion for “Like–Kind” Property Exchange
Background. State and federal law allow investors to trade similar (or like–kind) properties without paying PIT taxes on the capital gains that have accrued. Investors who make repeated exchanges over time accumulate these capital gains, and taxes are to be paid when the investor eventually sells the property.
Proposal. Eliminate the exclusion of capital gains for like–kind exchanges. Revenue gain of $350 million in 2009–10 and $360 million in 2010–11.
Rationale. Capital gains on real property transactions represent income earned from such activities and should be taxed like other types of income. In our 2008–09 P&I, we recommended eliminating the exclusion for trades involving out–of–state property on the basis that there is no rationale for allowing these gains to escape taxation permanently. A particular problem involving such out–of–state exchanges is that it is difficult to maintain records and enforce tax payments. Our subsequent research on this recommendation, however, revealed that investors often use this TEP as a way of permanently avoiding taxation for both in–state and out–of–state exchanges. This is accomplished by never actually selling the property (which would trigger the realization of capital gains). Instead, investors trade properties—perhaps several times—using this TEP simply to avoid taxation. When the investor dies, the property is transferred to the heirs at the current–market price (because of the “stepped–up basis” TEP provision for inherited property). In this way, the state never taxes gains made on any of the properties that were traded by the original investor. For this reason, we have broadened our previous recommendation to eliminate completely the tax break for like–kind exchanges.
Enterprise Zone Subsidies
Background. State law provides targeted hiring credits, wage credits, credits for sales taxes paid on certain machinery, and other tax benefits to businesses operating in designated “enterprise zones.” Currently, 42 zones are authorized by state law to promote economic growth in depressed areas of the state. Some zones have been in existence for more than 20 years.
Proposal. Cancel zones authorized by the state in 2006 and eliminate the remaining zones as their current designations expire. Revenue gain of about $100 million in 2009–10 and $120 million in 2010–11.
Rationale. Most studies conclude that enterprise zones typically have little impact overall on new investment and do relatively little to improve the job prospects of the residents of these zones. Additionally, it is not evident what additional benefits would be gained by extending the same benefits in zones that have been in place for two decades. (Please see our 2008–09 P&I and our 2003 report An Overview of California’s Enterprise Zone Hiring Credit for more on this issue.)
Animal Life, Feed, Seeds, and Plants
Background. California currently exempts certain products from the SUT that are used to produce food for human consumption. These products include animal life, feed for animal life, seeds, plants and fertilizer, drugs and medicine administered to animals, and medicated feed and drinking water.
Proposal. Eliminate these SUT exemptions. Revenue gain of $465 million in 2009–10 and $475 million in 2010–11.
Rationale. All of the SUT exemptions we discuss in this section provide benefits to businesses. While the SUT is sometimes considered a tax on consumption, it is not. Businesses pay SUT when they are the “final user” of a good (for example, a furniture maker would pay the tax on a table saw, as they would be the final user of the saw). This argument applies to all of the SUT exemptions discussed below.
One rationale offered for these food–related exemptions is that they lower the price of food in California. In today’s markets, however, food prices are usually determined by national or world markets. As a result, exempting from state taxation the price of inputs would not significantly change the price of food to the consumer. Instead, the exclusion primarily benefits food producers.
As a general tax policy, we believe all industries should be treated similarly. In this case, ranchers and farmers are the final users of the exempted items, and we see no clear reason why the food industry is more deserving of special treatment than other industries in the state.
Industry–Specific Equipment
Background. California currently exempts from the state portion of the SUT equipment in timber harvesting, farming, and post–production for television and films.
Proposal. Eliminate these partial exemptions. Revenue gain of $145 million in each of 2009–10 and 2010–11.
Rationale. One rationale given for these TEPs is to help California businesses compete with out–of–state firms. As a general tax policy, however, we believe that all industries should be treated similarly, and it is not clear that these particular industries are more deserving of tax exemptions than a variety of other industries in the state. (Please see our discussion of this tax expenditure in our 2008–09 P&I.)
Products Sold by Healthcare Professionals and Veterinarians
Background. Under current law, veterinarians and some healthcare professionals are not required to collect sales taxes when they sell certain products related to their professional service. They do, however, pay sales taxes when they purchase the products. As a result, the state does not receive sales taxes on the “mark–up” charged to patients. This arrangement, therefore, provides a partial SUT exemption to these products. Figure 12 displays the products that are exempt under this program.
Figure 12
Mark-Up Exemption for Healthcare Professionals |
|
Product |
Chiropractor |
Vitamins, minerals, dietary supplements,
and orthotic devices |
Optometrist and dispensing optician |
Eyeglasses, frames, and lenses |
Podiatrist |
Prosthetic materials and inlays |
Licensed hearing aid specialist |
Hearing aids |
Producers of X-ray films or photographs |
Materials and supplies |
Licensed pharmacists |
Replacement contact lenses |
Veterinarian |
Drugs and medicines |
Proposal. Eliminate this partial SUT exemption. Revenue gain of approximately $80 million in each of 2009–10 and 2010–11.
Rationale. One justification offered for this partial exclusion is that the products are incidental to services that are provided by a healthcare professional or veterinarian and, therefore, should not be taxed. This exemption may also simplify tax administration if the professional does not sell other tangible goods (and, therefore, is not required to register with BOE to remit taxes). The exempted products, however, can be quite expensive—more costly than the service provided by the professional. We see no policy rationale for special treatment of these purchases.
A second rationale offered for this TEP is that it is an extension of the sales tax exemption for prescription medicines—that these products are a “necessity of life.” These products, however, are already subject to the SUT—they are partially taxed if provided through a medical professional or veterinarian and fully taxable otherwise. As such, it is unclear how the necessity of life argument applies.
Other SUT Exemptions
Our 2008–09 P&I included three additional sales tax TEPs for elimination. In total, deleting the three exemptions from state law would generate revenues of $140 million in 2009–10 and $145 million in 2010–11. These exemptions are as follows:
- Specified Diesel Fuel Exemptions. Sales taxes are levied on the retail price of gasoline, which includes the state and federal excise taxes on gasoline. Current law, however, exempts diesel fuel from the SUT if it is used for farming activities. Additionally, the excise tax on diesel fuel is not subject to sales taxes. We see no reason why diesel fuel should be taxed differently than gasoline. Eliminating this TEP would result in a revenue gain of $75 million in each of 2009–10 and 2010–11.
- Custom Computer Programs. Current law exempts custom computer programs from sales tax on the basis that the cost of the programs reflects mostly programming–related services. A large number of products, however, are composed primarily of services, including books, musical recordings, and mass–produced computer programs. As noted above, we generally do not recommend tax breaks for specific industries. Eliminating this TEP would result in revenue gains of $45 million in 2009–10 and $40 million in 2010–11.
- Leasing of Films and Tapes. Current law makes leases subject to sales taxes under certain conditions. State law, however, exempts all leases on motion picture and television films and tapes. This represents another TEP designed to make the state more attractive to this industry. As we discuss in our review of the Governor’s proposed film tax credit, neither the effectiveness of these types of credits nor the need of this particular industry to be subsidized has been demonstrated. In our 2008–09 P&I, we estimated the revenue loss of this TEP at about $65 million annually. Since that time, BOE has advised that the loss probably is much smaller. For this reason, we have reduced our estimate of revenues from eliminating this TEP to $20 million in each of 2009–10 and 2010–11.
Targeted Tax Rate Options
In our analysis of the Governor’s temporary sales tax increase, we encourage the Legislature to look to other avenues, such as eliminating or modifying ineffective and inefficient TEPs, for raising as much revenues as makes sense before raising basic tax rates. Given the scope of the current budget problem, however, we recognize that some rate increases probably will be needed. In fact, for this reason, we do not specifically recommend against the temporary SUT. We do, however, encourage the Legislature to minimize the size of the rate increase.
This section discusses two additional rate increases for the Legislature’s consideration—an increase in the VLF to 1 percent and a 5 percent PIT surcharge. Like any tax, these two have unique strengths and weaknesses. We think they are worthy of being in the mix of any tax package considered by the Legislature.
The Vehicle License Fee
Background. Current law assesses what is called a VLF on the current value of registered vehicles in California. This levy is essentially a personal property tax on cars and trucks. Along with real property, most other types of personal property (airplanes, business machinery, and office equipment) are subject to the local property tax. Personal property is taxed based on its estimated current value. Tax administrators generally calculate the assessed value of personal property (whether the VLF or others) by depreciating the property’s purchase price at a fixed rate over the life of the asset.
Base rates for the two taxes, however, are different. The VLF taxes cars and trucks at 0.65 percent of its depreciated value, while the local property tax applies a one percent rate. Historically, VLF was set at a 2 percent uniform statewide rate. Local property tax rates were set at the local level, and averaged over 2 percent until the late 1970s. Proposition 13 in 1978, set the base property tax rate at 1 percent. The VLF rate stayed at 2 percent until the late 1990s and early 2000s, when the state reduced the rate to its present level.
Proposal. Increase the VLF rate from 0.65 percent to 1 percent. Revenue gain of $1.1 billion in 2009–10 and $1.2 billion in 2010–11.
Rationale. The VLF and the property tax are two components of the system of taxing property. We see no policy rationale for the difference in rates for the two taxes. Setting the VLF rate at the same rate as other property would improve the tax system by treating all property consistently.
Raising VLF rates would also require the Legislature to determine how to use the new revenues to address the state’s budget problem. As the equivalent of the local property tax for cars and trucks, the VLF has always been a local revenue. While the Legislature could simply deposit any new VLF collections into the General Fund, we recommend using the increase to “realign” several state programs into county–administered responsibilities. Realignment involves the state transferring to counties existing state responsibilities for specific programs along with new funding to support them. In this case, we propose using the increased VLF revenues to support realignment of several criminal justice programs. For details of our proposal, please see our report, 2009–10 Budget Analysis Series: Criminal Justice Realignment.
Personal Income Tax Surcharge
Background. The PIT represents the largest source of General Fund resources, taxing both in–state and out–of–state taxpayers based on the amount of their income earned in a given year. The strength of the PIT as a source of additional revenue is its broad base of income and ability to grow with the economy.
The weakness of California’s PIT is its high current marginal rates and volatility. The high tax rates can cause adverse behavioral effects, and the volatility makes revenue estimating difficult and can contribute to budget problems. In the recession of the early 1990s, the state temporarily increased the PIT rate for high–income taxpayers to help address its fiscal problems. While evidence suggests this policy had little long–term impact on taxpayers, its potential adverse effects today on taxpayer behavior are hard to predict, especially given that California’s highest income taxpayers now pay an additional 1 percent rate compared to previously. Accurately forecasting the revenues from increasing the rates for high–income brackets also can be difficult because such incomes are themselves very hard to predict, given the concentration of volatile capital gains with this group.
Proposal. Implement a temporary 5 percent PIT surcharge for three years beginning in tax year 2009. Taxpayers would calculate the surcharge by increasing their “final” post–credit tax liability by 5 percent. Revenue gain of $2.3 billion in 2009–10 and $2.4 billion in 2010–11.
Rationale. A surcharge would distribute the higher tax burden to all PIT taxpayers in proportion to their current relative burdens. The surcharge would also be easy for taxpayers to understand and comply with. The surcharge requires taxpayers to make one additional calculation. In addition, since most taxpayers overpay their taxes each year through withholding, the surcharge would reduce taxpayer refunds (rather than require a larger final tax payment) in April, when final tax returns are due.
Finally, the PIT surcharge (as well as a VLF increase) has the advantage of being deductible on federal income tax returns. An increase in the state PIT would allow Californian’s to pay fewer federal income taxes (as compared to a sales tax increase, which generally would not reduce federal taxes). This means that the net cost of the increased taxes to Californians under our proposal would be less.