EdBudget Tables
At key times during the state's budget cycle, we post tables containing important information about the education parts of the budget. This initial January posting reflects the 2017-18 Governor's Budget proposals. The tables cover Proposition 98, K-12 education, child care and preschool, higher education, and student financial aid. We will publish additional tables as we have them available.

 Report in PDF
Other
January 13, 2017EdBudget Tables
Proposition 98 Overview- Tracking Changes in the Proposition 98 Minimum Guarantee
- Proposition 98 Funding by Segment and Source
- 2015-16 Proposition 98 Changes
- 2016-17 Proposition 98 Changes
- 2017-18 Proposition 98 Changes
- Proposition 98 Key Inputs and Outcomes Under Governor's Budget
- Estimates of Outstanding K-12 and CCC Mandates Backlogs
- Distribution of Outstanding Mandate Claims
- K-14 Pension Contribution Rates and Amounts
- K-12 Proposition 39 Funding and Payments
- California Community Colleges Proposition 39 Funding and Payments
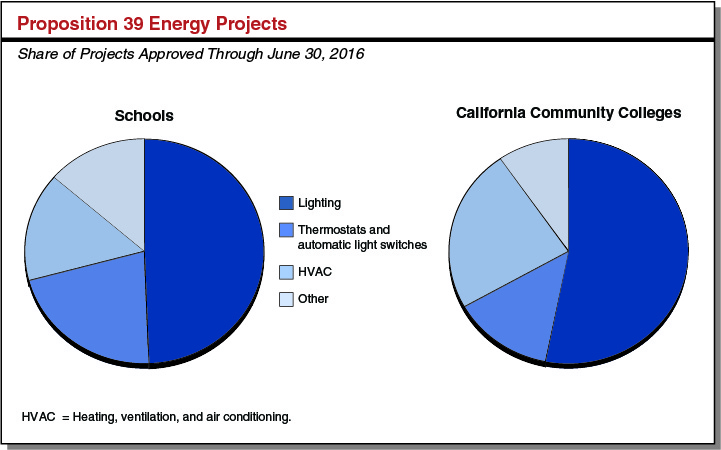
- Proposition 39 Energy Projects
- K-12 Funding by Source
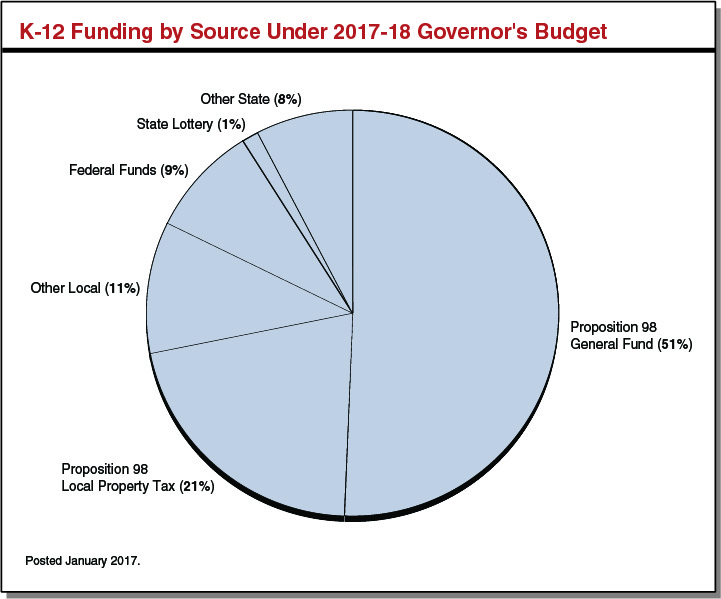
- K-12 Funding by Source Under 2017-18 Governor's Budget
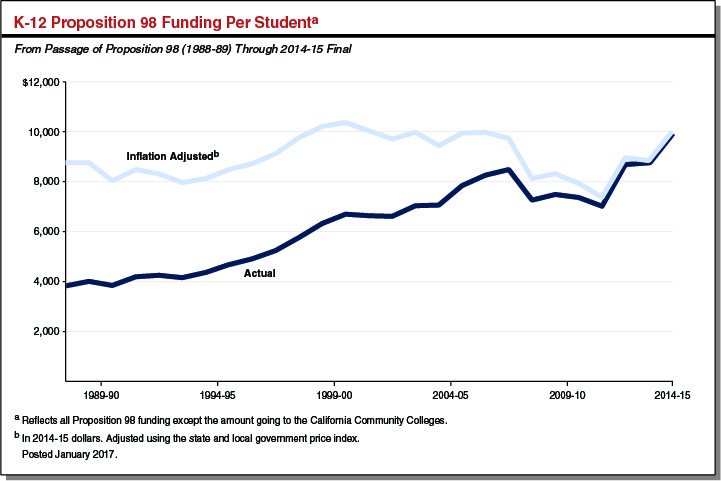
- K-12 Proposition 98 Funding Per Student
- K-12 Education Programs Funded by Proposition 98
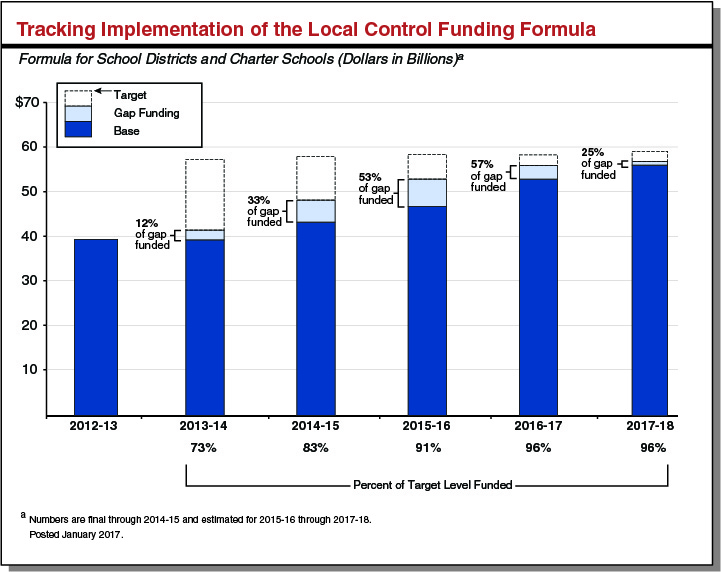
- Tracking Implementation of the Local Control Funding Formula
- Breakdown of Local Control Funding Formula
- Local Control Funding Formula Per-Student Rates
- Additional Workload and Funding for the California Department of Education (CDE)
- Child Care and Preschool Budget
- 2017-18 Child Care and Preschool Changes
- Child Care and Preschool Subsidized Slots
- Child Care and Preschool Funding Rates by Rate System, Setting, and Age
- 2015-16 California Community Colleges Proposition 98 Changes
- 2016-17 California Community Colleges Proposition 98 Changes
- 2017-18 California Community Colleges Proposition 98 Changes
- California Community Colleges Funding by Source
- California Community Colleges Proposition 98 Funding by Program
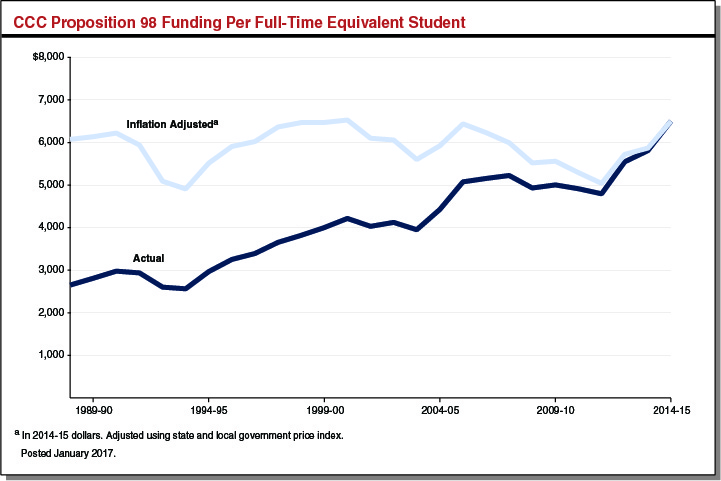
- California Community Colleges Proposition 98 Funding Per Full-Time Equivalent Student
- University of California Funding by Source
- 2017-18 UC General Fund Changes
- California State University Funding by Source
- 2017-18 California State University General Fund Changes
- Annual Tuition and Fees by Higher Education Segment
- Enrollment by Higher Education Segment
- Proposed Funding for Workforce Education and Training Programs in California
- California Student Aid Commission Budget
- Cal Grant Spending
- Cal Grant Recipients
- Middle Class Scholarship Program
- California State Library Budget
- California Institute for Regenerative Medicine Research Grant Awards and Funding
Tracking Changes in the Proposition 98 Minimum Guarantee
(In Millions)
|
2015-16 |
2016-17 |
||||||
|
June 2016 |
January 2017 |
Change |
June 2016 |
January 2017 |
Change |
||
|
Minimum Guarantee |
|||||||
|
General Fund |
$49,722 |
$48,989 |
-$733 |
$51,050 |
$50,330 |
-$720 |
|
|
Local property tax |
19,328 |
19,681 |
353 |
20,824 |
21,038 |
215 |
|
|
Totals |
$69,050 |
$68,671 |
-$379 |
$71,874 |
$71,368 |
-$506 |
|
|
Posted January 2017. |
|||||||
Proposition 98 Funding by Segment and Source
(Dollars in Millions)
|
2015-16 |
2016-17 |
2017-18 |
Change From 2016-17 |
||
|
Amount |
Percent |
||||
|
Preschoola |
$885 |
$975 |
$995 |
$20 |
2.0% |
|
K-12 Education |
|||||
|
General Fund |
$42,719 |
$43,829 |
$44,811 |
$982 |
2.2% |
|
Local property tax |
17,052 |
18,236 |
19,200 |
965 |
5.3 |
|
Subtotals |
($59,770) |
($62,064) |
($64,012) |
($1,947) |
(3.1%) |
|
California Community Colleges |
|||||
|
General Fund |
$5,304 |
$5,443 |
$5,465 |
$22 |
0.4% |
|
Local property tax |
2,630 |
2,803 |
2,959 |
156 |
5.6 |
|
Subtotals |
($7,933) |
($8,246) |
($8,424) |
($179) |
(2.2%) |
|
Other Agenciesa |
$82 |
$83 |
$80 |
-$3 |
-3.3% |
|
Totals |
$68,671 |
$71,368 |
$73,511 |
$2,143 |
3.0% |
|
General Fund |
$48,989 |
$50,330 |
$51,351 |
$1,021 |
2.0% |
|
Local property tax |
19,681 |
21,038 |
22,160 |
1,121 |
5.3 |
|
aConsists entirely of General Fund. Posted January 2017. |
|||||
2015-16 Proposition 98 Changes
(In Millions)
|
2015-16 Proposition 98 Spending as of 2016-17 Budget Act |
$69,050 |
|
Technical Adjustments |
|
|
Make Local Control Funding Formula adjustments |
-$40 |
|
Make various other adjustments |
40 |
|
Subtotal |
(—) |
|
Policy Changes |
|
|
Lower CCC base for unused enrollment growth funding |
-$56 |
|
Shift one-time payments from 2015-16 to 2016-17a |
-324 |
|
Subtotal |
(-$379) |
|
Total Changes |
-$379 |
|
2015-16 Revised Proposition 98 Spending |
$68,671 |
|
aProposal has no programmatic effect on schools, as schools already were expecting to receive the associated cash in 2016-17. Posted January 2017. |
|
2016-17 Proposition 98 Changes
(In Millions)
|
2016-17 Budget Act Proposition 98 Spending |
$71,874 |
|
Technical Adjustments |
|
|
Make Local Control Funding Formula (LCFF) adjustments |
$37 |
|
Make various other adjustments |
42 |
|
Subtotal |
($78) |
|
Policy Changes |
|
|
Shift one-time payments from 2015-16 to 2016-17 |
$324 |
|
Backfill for estimated reduction in CCC student fee revenue |
8 |
|
Lower CCC base for unused enrollment growth funding |
-57 |
|
Defer LCFF payment from June 2017 to July 2017 |
-859 |
|
Subtotal |
(-$584) |
|
Total Changes |
-$506 |
|
2016-17 Revised Proposition 98 Spending |
$71,368 |
|
Posted January 2017. |
2017-18 Proposition 98 Changes
(In Millions)
|
2016-17 Revised Proposition 98 Spending |
$71,368 |
|
Technical Adjustments |
|
|
Make Local Control Funding Formula (LCFF) adjustments |
$65 |
|
Revise estimate of energy efficiency funds |
27 |
|
Annualize funding for previously approved preschool slot increases |
24 |
|
Make various other adjustmentsa |
-30 |
|
Subtotal |
($85) |
|
K-12 Education |
|
|
Retire June-to-July LCFF deferral (one time)b |
$859 |
|
Increase LCFF funding |
744 |
|
Provide 1.48 percent COLA for select categorical programsc |
58 |
|
Add mandated reporter training to Mandates Block Grant |
8 |
|
Subtotal |
($1,670) |
|
California Community Colleges |
|
|
Fund guided pathways initiative (one time) |
$150 |
|
Provide 1.48 percent COLA for apportionments |
94 |
|
Fund 1.34 percent enrollment growth |
79 |
|
Provide unallocated increase |
24 |
|
Fund Innovation Awards (one time) |
20 |
|
Augment Online Education Initiative |
10 |
|
Develop integrated library system (one time) |
6 |
|
Provide 1.48 percent COLA for select categorical programsd |
4 |
|
Subtotal |
($387) |
|
Total Changes |
$2,143 |
|
2017-18 Proposition 98 Spending |
$73,511 |
|
aIncludes the removal of prior-year one-time payments, a special education fund swap (using one-time instead of ongoing funds), a High Speed Network fund swap (using ongoing rather than one-time funds), and various minor adjustments. bUnder the Governor’s proposal, the state would make 11 LCFF payments in 2016-17 (producing savings relative to the 2016-17 Budget Act) and 13 LCFF payments in 2017-18 (12 normal monthly payments plus an additional payment for the prior year). cApplied to special education, child nutrition, services for foster youth, adults in correctional facilities, and American Indian education. dApplied to Extended Opportunity Programs and Services, Disabled Students Programs and Services, CalWORKs student services, and support for certain campus child care centers. COLA = cost-of-living adjustment. Posted January 2017. |
|
Proposition 98 Key Inputs and Outcomes Under Governor’s Budget
(Dollars in Millions)
|
2015-16 |
2016-17 |
2017-18 |
|
|
Minimum Guarantee |
|||
|
General Fund |
$48,989 |
$50,330 |
$51,351 |
|
Local property tax |
19,681 |
21,038 |
22,160 |
|
Totals |
$68,671 |
$71,368 |
$73,511 |
|
Change From Prior Year |
|||
|
General Fund |
-$1,040 |
$1,340 |
$1,021 |
|
Percent change |
-2.1% |
2.7% |
2.0% |
|
Local property tax |
$2,565 |
$1,357 |
$1,121 |
|
Percent change |
15.0% |
6.9% |
5.3% |
|
Total guarantee |
$1,525 |
$2,698 |
$2,143 |
|
Percent change |
2.3% |
3.9% |
3.0% |
|
Operative Test |
3 |
3 |
3 |
|
Maintenance Factor |
|||
|
Amount created (+) or paid (-) |
— |
$838 |
$219 |
|
Total outstandinga |
$500 |
1,364 |
1,628 |
|
Growth Rates |
|||
|
K-12 average daily attendance |
-0.2% |
-0.2% |
-0.0% |
|
Per capita personal income (Test 2) |
3.8 |
5.4 |
3.3 |
|
Per capita General Fund (Test 3)b |
3.7 |
3.6 |
2.6 |
|
K-14 cost-of-living adjustment |
1.0 |
0.0 |
1.5 |
|
aOutstanding maintenance factor is adjusted annually for changes in K-12 attendance and per capita personal income. bAs set forth in the State Constitution, reflects change in per capita General Fund plus 0.5 percent. |
|||
Estimates of Outstanding K-12 and CCC Mandates Backlogs
(In Millions)
|
K-12 Education |
Community Colleges |
Total |
|
|
2016-17 Backloga |
$1,067 |
$266 |
$1,332 |
|
Governor’s Proposalb |
$287 |
— |
$287 |
|
Payment towards backloga |
(102) |
— |
(102) |
|
Remaining fundinga |
(185) |
— |
(185) |
|
2017-18 Backloga |
$964 |
$266 |
$1,230 |
|
aLAO estimates. bFrom settle-up payments. Allocated to all local educational agencies, with and without unpaid claims, on a per-student basis. Posted January 2017. |
|||
Distribution of Outstanding Mandate Claims
Claims Per Studenta
|
Share With Claims |
Minimum Claim |
Median Claim |
Maximum Claim |
|
|
School district |
40% |
$1 |
$353 |
$10,991 |
|
County offices of education |
69 |
51 |
3,247 |
29,143 |
|
Community college districts |
13 |
139 |
1,575 |
4,053 |
|
aReflects estimated claims after applying budgeted mandate backlog payments through 2016-17. Local education agencies with no outstanding balances have been omitted. Posted February 2017. |
||||
K-14 Pension Contribution Rates and Amounts
(Dollars in Millions)
|
2013-14 |
2014-15 |
2015-16 |
2016-17 |
2017-18 |
2018-19 |
2019-20 |
2020-21 |
|
|
Contribution Ratesa |
||||||||
|
CalSTRS |
||||||||
|
K-14 Districts |
8.3% |
8.9% |
10.7% |
12.6% |
14.4% |
16.3% |
18.1% |
19.1% |
|
Stateb |
3.0 |
3.5 |
4.9 |
6.3 |
6.3 |
6.3 |
6.3 |
6.3 |
|
Totals |
11.3% |
12.3% |
15.6% |
18.9% |
20.8% |
22.6% |
24.5% |
25.4% |
|
CalPERS |
||||||||
|
K-14 Districts |
11.4% |
11.8% |
11.8% |
13.9% |
15.8% |
18.7% |
21.6% |
24.9% |
|
Contribution Amounts |
||||||||
|
CalSTRS |
||||||||
|
School Districts |
$2,090 |
$2,280 |
$2,970 |
$3,622 |
$4,403 |
$5,216 |
$6,027 |
$6,587 |
|
Community College Districts |
175 |
191 |
249 |
303 |
369 |
437 |
505 |
552 |
|
Stateb |
779 |
904 |
1,328 |
1,824 |
1,939 |
2,017 |
2,162 |
2,286 |
|
Totals |
$3,044 |
$3,375 |
$4,547 |
$5,749 |
$6,712 |
$7,670 |
$8,694 |
$9,426 |
|
CalPERS |
||||||||
|
School Districts |
$993 |
$1,035 |
$1,132 |
$1,421 |
$1,665 |
$2,101 |
$2,415 |
$2,867 |
|
Community College Districts |
179 |
192 |
206 |
259 |
304 |
383 |
440 |
523 |
|
Totals |
$1,172 |
$1,227 |
$1,338 |
$1,680 |
$1,969 |
$2,485 |
$2,855 |
$3,390 |
|
Total District Contributions |
||||||||
|
School Districts |
$3,083 |
$3,315 |
$4,103 |
$5,043 |
$6,069 |
$7,318 |
$8,442 |
$9,455 |
|
Community College Districts |
354 |
383 |
455 |
563 |
673 |
820 |
945 |
1,075 |
|
Totals |
$3,437 |
$3,698 |
$4,557 |
$5,605 |
$6,741 |
$8,138 |
$9,387 |
$10,530 |
|
aChapter 47 of 2014 (AB 1469, Bonta) phased in annual CalSTRS rate increases for teachers, districts, and the state. District contribution rates for CalSTRS are set in statute through 2020-21. Other contribution rates are actuals through 2016-17 and projections thereafter. Future rates will differ based on investment returns and changes in actuarial assumptions and policies. bDoes not include the portion of the state contribution related to the Supplemental Benefits Maintenance Account. CalSTRS = California State Teachers’ Retirement System and CalPERS = California Public Employees’ Retirement System. Posted January 2017. |
||||||||
K-12 Proposition 39 Funding and Paymentsa
(In Millions)
|
2013-14 |
2014-15 |
2015-16 |
2016-17b |
2017-18c |
Totals |
|
|
School Districts |
||||||
|
Funding |
$296 |
$235 |
$242 |
$332 |
$342 |
$1,446 |
|
Payments |
-256 |
-154 |
-134 |
— |
— |
-544 |
|
Projects |
(-163) |
(-154) |
(-134) |
(—) |
(—) |
(-451) |
|
Planningd |
(-93) |
(—) |
(—) |
(—) |
(—) |
(-93) |
|
Funding Remaining |
$40 |
$80 |
$108 |
$332 |
$342 |
$902 |
|
Charter Schools |
||||||
|
Funding |
$75 |
$40 |
$67 |
$64 |
$76 |
$323 |
|
Payments |
-46 |
-12 |
-19 |
— |
— |
-77 |
|
Projects |
(-15) |
(-12) |
(-19) |
(—) |
(—) |
(-46) |
|
Planningd |
(-31) |
(—)f |
(—)f |
(—) |
(—) |
(-31) |
|
Funding Remaining |
$29 |
$29 |
$48 |
$64 |
$76 |
$246 |
|
County Offices of Education |
||||||
|
Funding |
$6 |
$2 |
$4 |
$3 |
$5 |
$20 |
|
Payments |
-4 |
-1 |
-2 |
— |
— |
-7 |
|
Projects |
(-2) |
(-1) |
(-2) |
(—) |
(—) |
(-5) |
|
Planningd |
(-2) |
(—) |
(—) |
(—) |
(—) |
(-2) |
|
Funding Remaining |
$2 |
$2 |
$2 |
$3 |
$5 |
$13 |
|
Totals |
||||||
|
Funding |
$377 |
$277 |
$313 |
$399 |
$423 |
$1,789 |
|
Payments |
-306 |
-167 |
-155 |
— |
— |
-628 |
|
Projects |
(-180) |
(-167) |
(-155) |
(—) |
(—) |
(-502) |
|
Planningd |
(-126) |
(—)f |
(—)f |
(—) |
(—) |
(-126) |
|
Funding Remaininge |
$71 |
$110 |
$158 |
$399 |
$423 |
$1,161 |
|
aExcludes state special schools and charter schools that have closed since 2013-14. To date, the state has provided $489,000 and $9.4 million, respectively, to these two groups. bPayment data not yet available. cReflects total funding proposed by the Governor and LAO estimate of funding by type of local education agency. dLocal education agencies were eligible for planning funds only in 2013-14, except for charter schools opened after this time. eThe state has committed $261 million of the funding remaining through 2015-16 for energy projects, though it has not yet made the associated payments. Local education agencies have until June 30, 2018 to spend their Proposition 39 funding. fLess than $500,000. Posted January 2017. |
||||||
California Community Colleges Proposition 39 Funding and Payments
(In Millions)
|
2013-14 |
2014-15 |
2015-16 |
2016-17 |
2017-18 |
Totals |
|
|
Funding |
$40 |
$32 |
$33 |
$42 |
$52 |
$198 |
|
Paymentsa |
-40 |
-31 |
-29 |
-19 |
— |
-119 |
|
Funding Remainingb |
— |
$1 |
$4 |
$22 |
$52 |
$79 |
|
aReflects project payments through January 2017. Unlike K-12 schools, community colleges do not receive planning payments. bAvailable until June 30, 2018. Posted January 2017. |
||||||
Proposition 39 Energy Projects
K-12 Funding by Source
(Dollars in Millions)
|
2015-16 |
2016-17 |
2017-18 |
Change From 2016-17 |
||
|
Amount |
Percent |
||||
|
Proposition 98 |
|||||
|
General Fund |
$43,686 |
$44,887 |
$45,886 |
$999 |
2.2% |
|
Local property tax |
17,052 |
18,236 |
19,200 |
965 |
5.3 |
|
Subtotals |
($60,738) |
($63,122) |
($65,087) |
($1,964) |
(3.1%) |
|
Other State |
|||||
|
Other General Funda |
$5,463 |
$6,010 |
$6,752 |
$742 |
12.4% |
|
Lottery |
1,276 |
1,184 |
1,184 |
— |
— |
|
Special funds |
553 |
990b |
615 |
-374 |
-38.0 |
|
Subtotals |
($7,292) |
($8,184) |
($8,552) |
($368) |
(4.5%) |
|
Other Localc |
$9,375 |
$9,409 |
$9,495 |
$86 |
0.9% |
|
Federal |
$6,986 |
$7,572 |
$7,507 |
-$65 |
-0.9% |
|
Totals |
$84,391 |
$88,287 |
$90,639 |
$2,352 |
2.6% |
|
Studentsd |
5,971,343 |
5,958,933 |
5,958,288 |
-645 |
— |
|
Proposition 98 Funding Per Student |
$10,171 |
$10,593 |
$10,924 |
$331 |
3.1% |
|
Total Funding Per Student |
$14,133 |
$14,816 |
$15,212 |
$396 |
2.7% |
|
aIncludes funding for state debt-service payments for school facilities, state contributions to the State Teachers’ Retirement System, and California Department of Education operations. bIncludes one-time clean energy funds carried over from previous years. cIncludes revenue from local fees, property taxes collected in excess of the Local Control Funding Formula allotments, and parcel taxes. dReflects average daily attendance. Posted January 2017. |
|||||
K-12 Funding by Source Under 2017-18 Governor's Budget
K-12 Proposition 98 Funding Per Student
K-12 Education Programs Funded by Proposition 98
(Dollars in Millions)
|
2015-16 |
2016-17 |
2017-18 |
Change From 2016-17 |
||
|
Amount |
Percent |
||||
|
LCFF—Districts |
$52,778 |
$55,804 |
$56,611 |
$807a |
1.4% |
|
LCFF—County Offices of Education |
$1,015 |
$1,018 |
$1,020 |
$2 |
0.2% |
|
Categorical Programs |
|||||
|
Special Education |
$3,830 |
$3,783 |
$3,829 |
$46 |
1.2% |
|
State Preschool |
885 |
975 |
995 |
20 |
2.0 |
|
After School Education and Safety |
547 |
547 |
547 |
— |
— |
|
Energy efficiency grants |
313 |
399 |
423 |
24 |
6.0 |
|
Mandates Block Grant |
219 |
219 |
227 |
8 |
3.6 |
|
Child Nutrition |
164 |
160 |
162 |
2 |
1.5 |
|
Charter School Facility Grants |
112 |
112 |
112 |
— |
— |
|
Student assessments |
126 |
110 |
110 |
— |
— |
|
Other educational agenciesb |
82 |
83 |
80 |
-3 |
-3.3 |
|
Foster Youth Services Coordinating Program |
25 |
25 |
26 |
0.4 |
1.5 |
|
Partnership Academies |
21 |
21 |
21 |
— |
— |
|
Adults in Correctional Facilities |
—c |
15 |
15 |
— |
— |
|
Safe Neighborhood and Schools Program |
— |
9 |
10 |
1 |
7.8 |
|
County Offices of Education fiscal oversight |
5 |
5 |
5 |
— |
— |
|
Specialized Secondary Programs |
5 |
5 |
5 |
— |
— |
|
Agricultural Vocational Education |
4 |
4 |
4 |
— |
— |
|
Otherd |
604 |
687 |
25 |
-662 |
-96.3 |
|
Payment deferrals |
— |
-859 |
859 |
-1,718 |
N/A |
|
Subtotals |
($6,944) |
($6,301) |
($7,456) |
($1,155) |
(18.3%) |
|
Totals |
$60,738 |
$63,122 |
$65,087 |
$1,964 |
3.1% |
|
aConsists of $744 million in General Fund gap funding, $25 million in property tax revenue from basic aid districts, and $38 million in technical adjustments. bReflects Proposition 98 funding for educational services provided by the state special schools, the Department of Juvenile Justice, the Department of Developmental Services, and American Indian Education Centers. cThe state provided program with $15 million in unspent prior-year funds in 2015-16. dIncludes one-time allocations for mandate backlog payments, Career Technical Education Incentive Grants for Secondary Schools, Broadband Infrastructure Improvement Grants, various minor one-time expenditures, an adjustment for federal land royalties, and programs with less than $4 million in ongoing funding. LCFF = Local Control Funding Formula. |
|||||
Tracking Implementation of the Local Control Funding Formula
Breakdown of Local Control Funding Formula
Formula for School Districts and Charter Schools, LAO Estimates (Dollars in Millions)
|
2015-16 |
2016-17 |
2017-18 |
Change From 2016-17 |
||
|
Amount |
Percent |
||||
|
Main Components |
|||||
|
Base funding |
$42,844 |
$45,363 |
$46,031 |
$668 |
1.5% |
|
Supplemental funding |
5,356 |
5,671 |
5,755 |
84 |
1.5 |
|
Concentration funding |
3,059 |
3,239 |
3,287 |
48 |
1.5 |
|
Subtotals |
($51,260) |
($54,274) |
($55,073) |
($799) |
(1.5%) |
|
Add-Ons |
|||||
|
HTS and TIIG |
$1,304 |
$1,304 |
$1,304 |
— |
— |
|
Minimum State Aida |
$116 |
$116 |
$116 |
— |
— |
|
Economic Recovery Target |
$23 |
$31 |
$38 |
$8 |
25% |
|
Other |
$76 |
$80 |
$80 |
— |
— |
|
Subtotals |
($1,519) |
($1,530) |
($1,537) |
($8) |
(0.5%) |
|
Totals |
$52,778 |
$55,804 |
$56,611 |
$807 |
1.4% |
|
aAmount shown reflects latest 2015-16 data. HTS = Home-to-School Transportation and TIIG = Targeted Instructional Improvement Grant. Posted January 2017. |
|||||
Local Control Funding Formula Per-Student Rates
Effective 2017-18 School District and Charter School Rates Under Governor’s Budget
|
Grade Span |
Base |
Supplementala |
Concentrationb |
|
K-3 |
$7,626 |
$1,525 |
$3,813 |
|
4-6 |
7,011 |
1,402 |
3,505 |
|
7-8 |
7,220 |
1,444 |
3,610 |
|
9-12 |
8,583 |
1,717 |
4,291 |
|
aEquals 20 percent of the base rate. Generated for each student who is a foster youth, English learner, or low income (EL/LI). bEquals 50 percent of the base rate. When EL/LI students comprise more than 55 percent of total district enrollment, generated for each EL/LI student above that threshold. Posted January 2017. |
|||
Additional Workload and Funding for the California Department of Education (CDE)
2017-18 Governor’s Budget (In Thousands)
|
New Workload |
Funding |
LAO Recommendation |
|
Provide funding to county office of education regional leads to help school districts effectively merge their federal plans for serving English learners with their state-required Local Control and Accountability Plans. One-time federal funds. |
$1,000 |
Recommend Approval. Helps school districts develop a single plan for serving English learners, which would reduce administrative burden. |
|
Undertake additional technical assistance and monitoring activities to ensure school districts are complying with federal rules for procuring goods and services for school nutrition programs. Ongoing federal funding. |
479 |
Recommend Approval. Helps CDE comply with federal law. |
|
Develop manual that documents best practices for schools serving English learners with disabilities. Pursuant to Chapter 579 of 2016 (AB 2785, O’Donnell). One-time federal funding. |
143 |
Recommend Approval. Helps CDE to implement recent legislation. |
|
Develop informational materials and provide training and technical assistance to teachers and administrators assisting homeless students. Pursuant to Chapter 538 of 2016 (SB 1068, Leyva). Federal funding, $39,000 ongoing and $49,000 one time. |
49 |
Recommend Approval. Helps CDE to implement recent legislation. |
|
Total |
$1,671 |
Child Care and Preschool Budget
(Dollars in Millions)
|
2015-16 |
2016-17 |
2017-18 |
Change From 2016-17 |
||
|
Amount |
Percent |
||||
|
Expenditures |
|||||
|
CalWORKs Child Care |
|||||
|
Stage 1 |
$334 |
$418 |
$386 |
-$32 |
-8% |
|
Stage 2b |
419 |
445 |
505 |
60 |
13 |
|
Stage 3 |
257 |
287 |
303 |
15 |
5 |
|
Subtotals |
($1,010) |
($1,150) |
($1,193) |
($43) |
(4%) |
|
Non-CalWORKs Child Care |
|||||
|
General Child Carec |
$305 |
$321 |
$319 |
-$1 |
—d |
|
Alternative Payment Program |
251 |
267 |
279 |
12 |
4% |
|
Migrant Child Care |
29 |
31 |
31 |
—d |
—d |
|
Care for Children With Severe Disabilities |
2 |
2 |
2 |
—d |
—d |
|
Infant and Toddler QRIS Grant (one-time) |
24 |
— |
— |
— |
— |
|
Subtotals |
($611) |
($620) |
($630) |
($10) |
(2%) |
|
Preschool Programse |
|||||
|
State Preschool—part dayf |
$425 |
$447 |
445 |
-$2 |
—d |
|
State Preschool—full day |
555 |
627 |
648 |
21 |
3% |
|
Transitional Kindergarteng |
665 |
704 |
714 |
10 |
1 |
|
Preschool QRIS Grant |
50 |
50 |
50 |
— |
— |
|
Subtotals |
($1,695) |
($1,828) |
($1,857) |
($29) |
(2%) |
|
Support Programs |
$76 |
$89 |
$82 |
-$7 |
-8% |
|
Totals |
$3,392 |
$3,688 |
$3,763 |
$76 |
2% |
|
Funding |
|||||
|
Proposition 98 General Fund |
$1,550 |
$1,679 |
$1,709 |
$30 |
2% |
|
Non-Proposition 98 General Fund |
885 |
984 |
1,002 |
18 |
2 |
|
Federal CCDF |
573 |
639 |
606 |
-32 |
-5 |
|
Federal TANF |
385 |
385 |
446 |
61 |
16 |
|
aReflects Department of Social Services’ revised Stage 1 estimates. Reflects budget act appropriation for all other programs. bDoes not include $9.2 million provided to community colleges for certain child care services. cGeneral Child Care funding for State Preschool wraparound care shown in State Preschool—full day. dLess than $500,000 or 0.5 percent. eSome CalWORKs and non-CalWORKs child care providers also use their funding to offer preschool. fIncludes $1.6 million each year used for a family literacy program at certain State Preschool programs. gReflects preliminary LAO estimates. Transitional Kindergarten enrollment data not yet available for any year of the period. QRIS = Quality Rating and Improvement System; CCDF=Child Care and Development Fund; TANF=Temporary Assistance for Needy Families; CDE = California Department of Education; and DOF = Department of Finance. Posted January 2017. |
|||||
2017-18 Child Care and Preschool Changes
(In Millions)
|
Change |
Proposition 98 General Fund |
Non-Proposition 98 General Fund |
Federal Funds |
Total |
|
Annualization of Changes Initiated in 2016-17 |
||||
|
Annualizes Regional Market Rate increasea |
— |
$45 |
$12 |
$57 |
|
Annualizes State Preschool slot increase |
$24 |
— |
— |
24 |
|
Annualizes 5 percent license-exempt rate increase |
— |
9 |
2 |
11 |
|
Subtotals |
($24) |
($54) |
($13) |
($91) |
|
Caseload Changes |
||||
|
Decreases non-CalWORKs slots for statutory growth adjustmentb |
-$4 |
-$3 |
— |
-$7 |
|
Makes CalWORKs caseload and average cost of care adjustments |
— |
61 |
-$73 |
-11 |
|
Subtotals |
(-$4) |
($58) |
(-$73) |
(-$18) |
|
Other Adjustments |
||||
|
Adjusts Transitional Kindergarten for increases in LCFF |
$10 |
— |
— |
$10 |
|
Replaces state funds with federal funds |
— |
-$93 |
$93 |
— |
|
Removes one-time funding |
— |
-1 |
-6 |
-7 |
|
Subtotals |
($10) |
(-$95) |
($88) |
($3) |
|
Totals |
$30 |
$18 |
$28 |
$76 |
|
aIncludes a hold harmless provision so that no provider receives less than it received in 2015-16. This provision will expire at the end of 2017-18. bReflects 0.4 percent decrease in the birth-through-four population. LCFF = Local Control Funding Formula. Posted January 2017. |
||||
Child Care and Preschool Subsidized Slotsa
|
2015-16 |
2016-17 |
2017-18 |
Change From 2016-17 |
||
|
Amount |
Percent |
||||
|
CalWORKs Child Care |
|||||
|
Stage 1 |
43,909 |
41,806 |
42,060 |
254 |
0.6% |
|
Stage 2c |
52,021 |
51,083 |
53,835 |
2,752 |
5.4 |
|
Stage 3 |
33,714 |
34,770 |
33,454 |
-1,316 |
-3.8 |
|
Subtotals |
(129,644) |
(127,659) |
(129,349) |
(1,690) |
(1.3%) |
|
Non-CalWORKs Programs |
|||||
|
General Child Cared |
28,738 |
28,737 |
28,622 |
-115 |
-0.4% |
|
Alternative Payment Program |
31,091 |
30,614 |
30,459 |
-156 |
-0.5 |
|
Migrant Child Care |
3,060 |
3,064 |
3,052 |
-12 |
-0.4 |
|
Care for Children with Severe Disabilities |
105 |
104 |
107 |
3 |
2.9 |
|
Subtotals |
(62,994) |
(62,519) |
(62,240) |
(-280) |
(-0.4%) |
|
Preschool Programs |
|||||
|
State Preschool—part day |
101,469 |
101,598 |
101,190 |
-408 |
-0.4% |
|
State Preschool—full day |
57,568 |
62,005 |
64,072 |
2,068 |
3.3 |
|
Transitional Kindergartenf |
80,073 |
79,905 |
79,897 |
-8 |
—e |
|
Subtotals |
(239,110) |
(243,508) |
(245,159) |
(1,652) |
(0.7%) |
|
Totals |
431,747 |
433,686 |
436,748 |
3,062 |
0.7% |
|
aGenerally based on appropriation and annual average rate per child. Except where noted, slot numbers reflect DSS estimates for CalWORKs Stage 1; DOF estimates for CalWORKs Stage 2 and 3, General Child Care, Migrant Child Care, and Care for Children with Severe Disabilities; and LAO estimates for all other programs. bReflects actuals for all stages of CalWORKs in 2015-16 and updated DSS estimates for Stage 1 in 2016-17. cDoes not include certain community college child care slots (1,300 to 1,800 slots annually). dState Preschool wraparound slots for non-LEAs (funded by General Child Care) are shown in State Preschool—full day. eLess than 0.05 percent. fReflects preliminary LAO estimates. Transitional Kindergarten enrollment data not yet available for any year of the period. DSS = Department of Social Services; DOF = Department of Finance; and LEAs = local educational agencies. Posted January 2017. |
|||||
Child Care and Preschool Funding Rates by Rate System, Setting, and Agea
|
2015-16 |
2016-17 |
2017-18 |
Change From 2016-17 |
||
|
Amount |
Percent |
||||
|
Local Control Funding Formula Rates |
|||||
|
Transitional Kindergarten |
$8,305 |
$8,810 |
$8,937 |
$126 |
1.5% |
|
Standard Reimbursement Rates |
|||||
|
State Preschool Centers |
|||||
|
State Preschool—part day |
$4,177 |
$4,386 |
$4,386 |
— |
— |
|
State Preschool—full day |
9,633 |
10,114 |
10,114 |
— |
— |
|
Child Care Centers |
|||||
|
Infants |
$16,273 |
$17,087 |
$17,087 |
— |
— |
|
Toddlers |
13,402 |
14,072 |
14,072 |
— |
— |
|
Preschoolers |
9,573 |
10,051 |
10,051 |
— |
— |
|
School-aged children |
9,573 |
10,051 |
10,051 |
— |
— |
|
Family Child Care Homes |
|||||
|
Infants and toddlers |
$13,402 |
$14,072 |
$14,072 |
— |
— |
|
Preschoolers |
9,573 |
10,051 |
10,051 |
— |
— |
|
School-aged children |
9,573 |
10,051 |
10,051 |
— |
— |
|
Regional Market Reimbursement Rates (Averagesb) |
|||||
|
Centers |
|||||
|
Infants and toddlers |
$16,334 |
$16,973 |
$17,435 |
$462 |
2.8% |
|
Preschoolers |
12,545 |
13,008 |
13,335 |
327 |
2.6 |
|
School-aged children |
8,961 |
9,408 |
9,757 |
349 |
3.9 |
|
Family Child Care Homesc |
|||||
|
Infants and toddlers |
$9,382 |
$10,140 |
$10,795 |
$655 |
7.0% |
|
Preschoolers |
8,825 |
9,417 |
9,914 |
496 |
5.6 |
|
School-aged children |
7,583 |
7,920 |
8,174 |
255 |
3.4 |
|
aAll rates reflect full-time, full-year care, with the exception of Transitional Kindergarten and State Preschool—part day, which operate part day for 180 and 175 days per year respectively. bRates are weighted by the number of subsidized children receiving child care in each setting and county. Estimates assume half of children reimbursed at weekly rate and half at monthly rate. cLicense-exempt rates were 60 percent of the family child care home (FCCH) rate for the first three months of 2015-16. The state increased the license-exempt rate to 65 percent of the FCCH rate beginning October 1, 2015 and to 70 percent of the FCCH rate beginning January 1, 2016. Posted January 2017. |
|||||
2015-16 California Community Colleges Proposition 98 Changes
(In Millions)
|
2015-16 Proposition 98 Spending in 2016-17 Budget Act |
$7,983 |
|
Technical Adjustments |
$5 |
|
Policy Changes |
|
|
Reduce apportionments to reflect unused enrollment growth funding |
-56 |
|
Total Changes |
-$50 |
|
2015-16 Revised Proposition 98 Spending |
$7,933 |
|
Posted January 2017. |
|
2016-17 California Community Colleges Proposition 98 Changes
(In Millions)
|
2016-17 Budget Act Proposition 98 Spending |
$8,295 |
|
Technical Adjustments |
-$57 |
|
Policy Changes |
|
|
Backfill for estimated reduction in student fee revenue |
$8 |
|
Total Changes |
-$49 |
|
2016-17 Revised Proposition 98 Spending |
$8,246 |
|
Posted January 2017. |
|
2017-18 California Community Colleges Proposition 98 Changes
(In Millions)
|
2016-17 Revised Proposition 98 Spending |
$8,246 |
|
Technical Adjustments |
|
|
Remove one-time spending |
-$177 |
|
Other technical adjustments |
-32 |
|
Subtotal |
(-$209) |
|
Policy Adjustments |
|
|
Fund guided pathways initiative (one time) |
$150 |
|
Provide 1.48 percent COLA for apportionments |
94 |
|
Fund 1.34 percent enrollment growth |
79 |
|
Provide unallocated base increase |
24 |
|
Fund Innovation Awards (one time) |
20 |
|
Augment Online Education Initiative |
10 |
|
Develop integrated library system (one time) |
6 |
|
Provide 1.48 percent COLA for select categorical programsa |
4 |
|
Subtotal |
($387) |
|
Total Changes |
$179 |
|
2017-18 Proposed Proposition 98 Spending |
$8,424 |
|
aApplied to Extended Opportunity Programs and Services, Disabled Students Programs and Services, CalWORKs student services, and support for certain campus child care centers. COLA = cost-of-living adjustment. Posted January 2017. |
|
California Community Colleges Funding by Source
(Dollars in Millions)
|
2015-16 |
2016-17 |
2017-18 |
Change From 2016-17 |
||
|
Amount |
Percent |
||||
|
Proposition 98 |
|||||
|
General Funda |
$5,304 |
$5,443 |
$5,465 |
$22 |
0.4% |
|
Local property tax |
2,630 |
2,803 |
2,959 |
156 |
5.6 |
|
Subtotals |
($7,933) |
($8,246) |
($8,424) |
($179) |
(2.2%) |
|
Other State |
|||||
|
Non-Proposition 98 General Fundb |
$435 |
$522 |
$472 |
-$50 |
-9.5% |
|
Lottery |
232 |
227 |
227 |
— |
— |
|
Special funds and reimbursements |
76 |
104 |
94 |
-10 |
-9.4 |
|
Subtotals |
($744) |
($853) |
($793) |
(-$60) |
(-7.0%) |
|
Other Local |
|||||
|
Enrollment fees |
$432 |
$436 |
$440 |
$4 |
1.0% |
|
Other local revenuec |
2,437 |
2,488 |
2,456 |
-33 |
-1.3 |
|
Subtotals |
($2,869) |
($2,924) |
($2,896) |
(-$28) |
(-1.0%) |
|
Federal |
$298 |
$297 |
$297 |
— |
— |
|
Totals |
$11,843 |
$12,320 |
$12,411 |
$91 |
0.7% |
|
Full-Time Equivalent (FTE) Students |
1,145,637 |
1,156,810 |
1,168,379 |
11,569 |
1.0% |
|
Proposition 98 Funding Per FTE Student |
$6,925 |
$7,128 |
$7,210 |
$82 |
1.2% |
|
Total Funding Per FTE Student |
$10,338 |
$10,650 |
$10,622 |
-$28 |
-0.3% |
|
aIncludes $500 million each year (and an additional $5 million in 2016-17) for the Adult Education Block Grant, of which more than $400 million goes to school districts for their adult education services. bIncludes funding for state general obligation bond debt service, state contributions to the State Teachers’ Retirement System (STRS), and Chancellor’s Office operations. 2017-18 amount includes a $64 million decline in debt service and a $23 million increase in STRS contributions. cPrimarily consists of revenue from student fees (other than enrollment fees), sales and services, and grants and contracts, as well as local debt-service payments. Amounts are estimates and do not include federal and state student financial aid for nontuition costs or bond proceeds for capital outlay. Posted January 2017. |
|||||
California Community Colleges Proposition 98 Funding by Program
(Dollars in Millions)
|
2015-16 |
2016-17 |
2017-18 |
Change From 2016-17 |
||
|
Amount |
Percent |
||||
|
Apportionments |
$5,967 |
$6,054 |
$6,242 |
$188 |
3% |
|
Categorical Programs and Other Appropriations |
— |
— |
|||
|
Adult Education Block Grant |
500 |
505 |
500 |
-5 |
-1 |
|
Student Success and Support Program |
299 |
299 |
299 |
— |
— |
|
Strong Workforce Program |
— |
200 |
248 |
48 |
24 |
|
Student equity plan implementation |
155 |
155 |
155 |
— |
— |
|
Student success grant initiativesa |
— |
15 |
150 |
135 |
900 |
|
Extended Opportunity Programs and Services |
123 |
123 |
125 |
2 |
1 |
|
Disabled Students Program |
115 |
115 |
117 |
2 |
1 |
|
Financial aid administration |
74 |
73 |
73 |
—b |
—b |
|
Apprenticeship |
52 |
54 |
55 |
1 |
2 |
|
Proposition 39 energy efficiency projects |
39 |
49 |
52 |
3 |
6 |
|
Basic Skills Initiativec |
20 |
50 |
50 |
— |
— |
|
Cal Grant B and C supplemental grants |
39 |
41 |
44 |
3 |
8 |
|
CalWORKs student services |
35 |
44 |
44 |
1 |
1 |
|
Lease revenue bond payments |
56 |
47 |
44 |
-3 |
-6 |
|
Telecommunications and technology servicesd |
27 |
28 |
34 |
6 |
22 |
|
Mandates block grant and reimbursements |
32 |
32 |
32 |
—b |
—b |
|
Institutional effectiveness initiative |
18 |
28 |
28 |
— |
— |
|
Part-time faculty compensation |
25 |
25 |
25 |
— |
— |
|
Online course initiativee |
10 |
18 |
23 |
5 |
28 |
|
Economic and Workforce Development |
23 |
23 |
23 |
— |
— |
|
Innovation Awards (one time) |
— |
25 |
20 |
-5 |
-20 |
|
Nursing grants |
13 |
13 |
13 |
— |
— |
|
Part-time faculty office hours |
4 |
7 |
7 |
— |
— |
|
Fund for Student Success |
4 |
6 |
6 |
— |
— |
|
Foster Parent Education Program |
5 |
5 |
5 |
— |
— |
|
Support for certain campus child care centers |
3 |
3 |
3 |
—b |
— |
|
Equal Employment Opportunity program |
1 |
3 |
3 |
— |
— |
|
Physical plant and instructional support (one time)f |
100 |
154 |
— |
-154 |
— |
|
CTE Pathways Initiative (one time)g |
— |
48 |
— |
-48 |
— |
|
Mandates backlog payment (one time) |
193 |
— |
— |
— |
— |
|
Otherh |
2 |
3 |
3 |
— |
— |
|
Subtotals |
($1,966) |
($2,192) |
($2,182) |
(-$10) |
(-1%) |
|
Totals |
$7,933 |
$8,246 |
$8,424 |
$179 |
2% |
|
a2016-17 amount is for intersegmental partnership grants. 2017-18 amount is for guided pathways grants. bLess than $500,000 or 0.5 percent. c2016-17 amount includes $30 million for one-time grants. Full 2016-17 amount becomes available for ongoing expenditure beginning in 2017-18. d2015-16 amount includes $7 million one time to upgrade technology infrastructure. 2017-18 amount includes $6 million one time to develop an integrated library system. e2016-17 amount includes $5 million one time for a zero-textbook-cost degree initiative and $3 million ongoing to provide digital instructional materials for students who are inmates in Department of Corrections and Rehabilitation facilities. 2017-18 amount includes $10 million ongoing for campus learning management system licenses. fAdditionally, $23.8 million in Proposition 98 settle-up funds and $6.4 million in prior-year funds in 2016-17, and $43.7 million in Proposition 98 settle-up funds in 2017-18. gState provided $48 million in 2014-15 for expenditure in 2015-16. Trailer legislation sunsets program July 1, 2017 and folds funding into Strong Workforce Program. hIncludes programs with less than $2 million in ongoing funding (Academic Senate, transfer education and articulation, district financial crisis oversight, and part-time faculty health insurance). CTE = career technical education. Posted January 2017. |
|||||
California Community Colleges Proposition 98 Funding Per Full-Time Equivalent Student
University of California Funding by Source
(Dollars in Millions)
|
2015-16 |
2016-17 |
2017-18 |
Change Over 2016-17 |
||
|
Amount |
Percent |
||||
|
Core Funds |
|||||
|
General Fund—ongoing |
$3,135 |
$3,279 |
$3,362 |
$83 |
2.5% |
|
General Fund—one time |
124 |
262 |
169 |
-93 |
-35.0 |
|
Subtotals |
($3,259) |
($3,541) |
($3,531) |
(-$10) |
(-0.3%) |
|
Resident tuition and fees |
$3,211 |
$3,371 |
$3,449 |
$78 |
2.3% |
|
Nonresident supplemental tuition |
833 |
976 |
1,050 |
74 |
7.6 |
|
Subtotals |
($4,044) |
($4,347) |
($4,499) |
($152) |
(3.5%) |
|
Lottery |
$38 |
$36 |
$36 |
— |
— |
|
Othera |
318 |
286 |
334 |
$49 |
17.1% |
|
Subtotals—Core Funds |
($7,660) |
($8,209) |
($8,401) |
($191) |
(2.3%) |
|
Other Funds |
|||||
|
Medical centers |
$9,467 |
$9,751 |
$10,044 |
$293 |
3.0% |
|
Sales and services |
6,045 |
6,308 |
6,497 |
189 |
3.0 |
|
Federal |
3,920 |
3,994 |
3,988 |
-6 |
-0.2 |
|
Privateb |
2,055 |
2,149 |
2,234 |
85 |
4.0 |
|
State special funds |
26 |
59 |
106 |
47 |
80.0 |
|
Other |
1,400 |
1,451 |
1,490 |
40 |
2.7 |
|
Subtotals |
($22,913) |
($23,711) |
($24,359) |
($648) |
(2.7%) |
|
Totals |
$30,573 |
$31,921 |
$32,760 |
$839 |
2.6% |
|
aIncludes a portion of overhead funding on federal and state grants and a portion of patent royalty income. Also includes $50 million in funding freed up for core purposes by Proposition 56 funds. bConsists of private gifts and endowment earnings. Posted January 2017. |
|||||
2017-18 UC General Fund Changes
(In Millions)
|
2016-17 Revised Funding |
$3,541 |
|
Pay down unfunded pension liability (one time) |
$169 |
|
Provide base increase |
131 |
|
Other adjustments |
2 |
|
Offset General Fund with Proposition 56 funds |
-50 |
|
Remove prior-year one-time funding |
-262 |
|
Total Changes |
-$10 |
|
2017-18 Proposed Funding |
$3,531 |
|
Posted January 2017. |
|
California State University Funding by Source
(Dollars in Millions)
|
2015-16 |
2016-17 |
2017-18 |
Change From 2016-17 |
||
|
Amount |
Percent |
||||
|
Core Funds |
|||||
|
General Fund |
|||||
|
Ongoinga |
$3,271 |
$3,479 |
$3,714 |
$235 |
6.8% |
|
One time |
5 |
110 |
1 |
-109 |
-99 |
|
Subtotals |
($3,276) |
($3,589) |
($3,715) |
($126) |
(3.5%) |
|
Lottery |
$58 |
$55 |
55 |
— |
— |
|
Tuition and feesb |
3,022 |
2,963 |
2,963 |
— |
— |
|
Subtotals, Core Funds |
($6,357) |
($6,607) |
($6,733) |
($126) |
(1.9%) |
|
Other Funds |
|||||
|
Federal funds |
$1,256 |
$1,385 |
$1,385 |
— |
— |
|
Other CSU fundsc |
2,104 |
1,844 |
1,899 |
$55 |
3.0% |
|
Subtotals |
($3,360) |
($3,228) |
($3,284) |
($55) |
(1.7%) |
|
Totals |
$9,717 |
$9,835 |
$10,017 |
$182 |
1.8% |
|
aIncludes CSU debt service on general obligation and lease-revenue bonds and funds for pensions and retiree health benefit costs. bIncludes funds that CSU uses to provide tuition discounts and waivers to certain students. In 2017-18, CSU plans to provide $662 million in such aid. cIncludes funds such as housing fees, parking fees, and extended education charges. |
|||||
2017-18 California State University General Fund Changes
(In Millions)
|
2016-17 Revised Funding |
$3,589 |
|
Unrestricted base increase |
|
|
Funding per Governor’s original long-term plan |
$131 |
|
Redirected savings from Middle Class Scholarship modifications |
26 |
|
Subtotal |
($157)a |
|
Pension adjustment |
$50 |
|
Retiree health benefits adjustment |
23 |
|
Lease-revenue bond debt service adjustment |
5 |
|
Remove one-time funding provided in prior year |
-87 |
|
Other adjustments |
-21 |
|
Total Changes |
$126 |
|
2017-18 Proposed Funding |
$3,715 |
|
aCSU indicates that it would use these funds to cover recently ratified bargaining agreements ($139 million) and various other cost increases ($18 million). |
|
Annual Tuition and Fees by Higher Education Segment
Mandatory Charges for a Full-Time Resident Student
|
2015-16 |
2016-17 |
2017-18 |
Change From 2016-17 |
||
|
Amount |
Percent |
||||
|
Hastings College of the Law |
|||||
|
Tuitionb |
$43,486 |
$43,486 |
$43,486 |
— |
— |
|
Other fees |
700 |
732 |
732 |
— |
— |
|
University of California |
|||||
|
Student Services Fee |
$1,020 |
$1,074 |
$1,128 |
$54 |
5% |
|
Tuition |
|||||
|
Professionalc |
$15,420-$51,696 |
$15,610-$53,720 |
$15,610-$53,720 |
— |
— |
|
Graduate |
11,220 |
11,220 |
11,220 |
— |
— |
|
Undergraduate |
11,220 |
11,220 |
11,220 |
— |
— |
|
Average campus feed |
1,211 |
1,257 |
1,320 |
$63 |
5% |
|
California State University |
|||||
|
Systemwide Tuition |
|||||
|
Graduate |
$6,738 |
$6,738 |
$6,738 |
— |
— |
|
Teacher credential |
6,348 |
6,348 |
6,348 |
— |
— |
|
Undergraduate |
5,472 |
5,472 |
5,472 |
— |
— |
|
Average campus fee |
1,346 |
1,409 |
1,409 |
— |
— |
|
California Community Colleges |
|||||
|
Enrollment Fee |
$1,380 |
$1,380 |
$1,380 |
— |
— |
|
Maximum campus feese |
92 |
94 |
94 |
— |
— |
|
aReflects rates assumed by administration, except for CCC, which reflects rates in state law. bReflects tuition for juris doctor (JD) program only. Non-JD programs do not use residency classifications. cReflects range for students in business, law, medicine, nursing, and other professional programs. dReflects average for undergraduate students. Average campus fees for graduate students are lower. For planning purposes, UC assumes a 5 percent average increase from 2016-17. eReflects maximum statutory charges for five campus service fees. Not all campuses charge the maximum amount. Posted January 2017. |
|||||
Enrollment by Higher Education Segment
Resident Full-Time Equivalent (FTE) Studentsa
|
2015-16 |
2016-17 |
2017-18 |
Change From 2016-17 |
||
|
Amount |
Percent |
||||
|
California Community Collegesb |
1,145,637 |
1,156,810 |
1,168,379 |
11,569 |
1.0%c |
|
California State University |
|||||
|
Undergraduate |
335,218 |
339,232 |
339,232 |
— |
— |
|
Graduate/Other Postbaccalaureate |
28,713 |
28,984 |
28,984 |
— |
— |
|
Teacher Credential |
7,028 |
7,148 |
7,148 |
— |
— |
|
Subtotals |
(370,959) |
(375,364) |
(375,364) |
(—) |
(—) |
|
University of California |
|||||
|
Undergraduate |
174,111 |
181,154 |
183,654 |
2,500 |
1.4% |
|
Graduate |
36,225 |
37,236 |
37,851 |
615 |
1.7 |
|
Subtotals |
(210,336) |
(218,390) |
(221,505) |
(3,115) |
(1.4) |
|
Hastings College of the Lawd |
785 |
815 |
799 |
-16 |
-2.0 |
|
Totals |
1,727,717 |
1,751,379 |
1,766,047 |
14,668 |
0.8% |
|
aAt UC and CSU, 1 FTE student represents 30 credit units for an undergraduate and 24 credit units for a graduate student. At CCC, 1 FTE student represents 525 contact hours per year, which on average generates about 24 credits. bReflects funded enrollment levels. cReflects 1.3 percent systemwide growth plus 0.8 percent enrollment restoration (certain districts earning back slots they had lost within the last three years), offset by a projected 1.1 percent reduction in districts with declining enrollment. dIncludes juris doctor (JD) program only. Non-JD programs do not use residency classifications. Posted January 2017. |
|||||
Proposed Funding for Workforce Education and Training Programs in California
2017-18 (In Millions)
|
Program |
Agency |
State General Fund |
Other Fund Sourcesa |
Total Funding |
|
Apportionments for workforce education and training |
CCC |
$2,214b |
— |
2,214 |
|
Adult Education Block Grant |
CDE/CCC |
500 |
— |
500 |
|
Career Technical Education Incentive Grants |
CDE |
200c |
— |
200 |
|
CalWORKs employment and training services |
DSS |
248 |
987 |
1,235 |
|
CCC Strong Workforce Program |
CCC |
248d |
— |
248 |
|
Office of Correctional Education programs |
CDCR |
210 |
— |
210 |
|
Office of Offender Services workforce programse |
CDCR |
114 |
43 |
156f |
|
Vocational Rehabilitation |
CDR |
61 |
365 |
426 |
|
Apprenticeships |
CDE/CCC |
55 |
— |
55 |
|
CCC Student Services for CalWORKs Recipients |
CCC |
44 |
— |
44 |
|
Core Training Program |
Corps |
44 |
53 |
97 |
|
Project Workability for students in special education |
CDE |
40 |
— |
40 |
|
Economic and Workforce Development Program |
CCC |
23 |
— |
23 |
|
California Partnership Academies |
CDE |
21 |
— |
21 |
|
Adults in Correctional Facilities (Jail Ed) |
CDE |
15 |
— |
15 |
|
Nursing program support |
CCC |
13 |
— |
13 |
|
Specialized Secondary Programs |
CDE |
5 |
— |
5 |
|
Agriculture Incentive Grants |
CDE |
4 |
— |
4 |
|
Adult, Youth, and Dislocated Worker Services (WIOA Title I) |
EDD |
— |
418 |
418 |
|
Wagner-Peyser Employment Services (WIOA Title III) |
EDD |
— |
128 |
128 |
|
Carl D. Perkins Career and Technical Education Act Program |
CDE/CCC |
— |
109 |
109 |
|
Adult Education and Family Literacy Program (WIOA Title II) |
CDE/CCC |
— |
87 |
87 |
|
Employment Training Panel |
EDD |
— |
78 |
78 |
|
CalFresh Employment and Training Program |
DSS |
— |
64 |
64 |
|
Jobs for Veterans State Grant |
EDD |
— |
20 |
20 |
|
CDE Student Services for CalWORKs Recipients |
CDE |
— |
10 |
10 |
|
Proposition 39 pre-apprenticeships |
EDD |
— |
3 |
3 |
|
Offender Development programs |
CalPIA |
2 |
2g |
4 |
|
Totals |
$4,062 |
$2,366 |
$6,428 |
|
|
aLargely federal funds with some special funds. bExtrapolated from best available data, assumes community colleges spend one-third of apportionment funding on core adult education areas. cReflects third-year funding for three-year, $900 million grant program. dReflects first year of folding in funds formerly earmarked for the CTE Pathways program. eReflects funding for wraparound services, which include workforce education and training. fReflects funding for programs in 2016-17. gFunded through sale of CalPIA goods. Assumes program will sell the same value of goods as in 2015-16. CCC = California Community Colleges; CDE = California Department of Education; CDCR = California Department of Corrections and Rehabilitation; CDR = California Department of Rehabilitation; CalPIA = California Prison Industrial Authority; Corps = California Conservation Corps; DSS = California Department of Social Services; EDD = California Employment Development Department; Energy = California Energy Commission; and WIOA = Workforce Innovation and Opportunity Act. Posted January 2017. |
||||
California Student Aid Commission Budget
(Dollars in Millions)
|
2015-16 |
2016-17 |
2017-18 |
Change From 2016-17 |
||
|
Amount |
Percent |
||||
|
Expenditures |
|||||
|
Local Assistance |
|||||
|
Cal Grants |
1,916a |
1,952 |
1,986 |
$34 |
1.7% |
|
Middle Class Scholarships |
48 |
74 |
74 |
— |
— |
|
Assumption Program of Loans for Education |
14 |
10 |
7 |
-3 |
-33 |
|
Chafee Foster Youth Program |
11 |
14 |
14 |
— |
— |
|
Student Opportunity and Access Program |
8 |
8 |
8 |
— |
— |
|
National Guard Education Assistance Awards |
2 |
2 |
2 |
— |
— |
|
Other Programsb |
1 |
1 |
1 |
—c |
3.7 |
|
Subtotals |
($2,002) |
($2,062) |
($2,093) |
($31) |
(1.5%) |
|
State Operations |
$14 |
$17 |
$14 |
-2 |
-14% |
|
Totals |
$2,016 |
$2,079 |
$2,107 |
$28 |
1.4% |
|
Funding |
|||||
|
State General Fund |
$1,479 |
$1,130 |
$1,153 |
$23 |
2% |
|
Federal TANF |
521 |
926 |
926 |
— |
— |
|
Other federal funds and reimbursements |
15 |
18 |
18 |
-1 |
-2.8 |
|
College Access Tax Credit Fund |
1 |
5 |
11 |
6 |
119 |
|
aReflects amount assumed in the Governor’s budget. The California Student Aid Commission estimates expenditures to be $56 million lower. bIncludes Cash for College, Child Development Teacher/Supervisor Grants, Graduate Assumption Program of Loans for Education, John R. Justice Program, Law Enforcement Personnel Dependents Scholarships, and State Nursing Assumption Program of Loans for Education for Nursing Faculty. cLess than $500,000. TANF = Temporary Assistance for Needy Families. Posted February 2017. |
|||||
(Dollars in Millions)
|
2015-16 |
2016-17 |
2017-18 |
Amount |
Percent |
|
|
Total Spending |
$1,861a |
$1,952 |
$1,986 |
$34 |
1.7% |
|
By Segment: |
|||||
|
University of California |
$843 |
$879 |
$897 |
$18 |
2.1 |
|
California State University |
636 |
685 |
705 |
20 |
2.8 |
|
Private nonprofit institutions |
234 |
229 |
218 |
-11 |
-4.9 |
|
California Community Colleges |
131 |
142 |
150 |
8 |
5.9 |
|
Private for-profit institutions |
17 |
17 |
16 |
—b |
-2.4 |
|
By Program: |
|||||
|
High School Entitlement |
$1,503 |
$1,571 |
$1,594 |
$23 |
1.5% |
|
CCC Transfer Entitlement |
212 |
221 |
230 |
8 |
3.8 |
|
Competitive |
141 |
155 |
158 |
3 |
1.7 |
|
Cal Grant C |
5 |
5 |
5 |
—b |
-1.1 |
|
By Award Type: |
|||||
|
Cal Grant A |
$1,052 |
$1,084 |
$1,099 |
$15 |
1.4% |
|
Cal Grant B |
804 |
863 |
882 |
19 |
2.2 |
|
Cal Grant C |
5 |
5 |
5 |
—b |
-1.1 |
|
By Renewal or New: |
|||||
|
Renewal |
$1,312 |
$1,368 |
$1,400 |
$31 |
2.3% |
|
New |
549 |
579 |
587 |
8 |
1.3 |
|
By Funding Source: |
|||||
|
State General Fund |
$1,337 |
$1,022 |
$1,050 |
$28 |
2.7% |
|
Federal TANF |
521 |
926 |
926 |
— |
— |
|
College Access Tax Credit Fund |
1 |
5 |
11 |
6 |
119 |
|
aReflects expenditures estimated by the California Student Aid Commission. The amount assumed in the Governor’s budget is $56 million higher. bLess than $500,000. TANF = Temporary Assistance for Needy Families. Posted Februrary 2017. |
|||||
|
2015-16 |
2016-17 |
2017-18 |
Change From 2016-17 |
||
|
Amount |
Percent |
||||
|
Total Recipients |
328,414 |
337,557 |
344,972 |
7,415 |
2.2% |
|
By Segment: |
|||||
|
California State University |
121,383 |
125,246 |
128,095 |
2,849 |
2.3 |
|
California Community Colleges |
105,690 |
110,057 |
113,492 |
3,435 |
3.1 |
|
University of California |
70,585 |
72,495 |
74,072 |
1,577 |
2.2 |
|
Private nonprofit institutions |
27,412 |
26,211 |
25,700 |
-511 |
-1.9 |
|
Private for-profit institutions |
3,344 |
3,548 |
3,613 |
65 |
1.8 |
|
By Program: |
|||||
|
High School Entitlement |
246,659 |
253,288 |
258,354 |
5,066 |
2.0 |
|
Competitive |
47,120 |
50,355 |
51,998 |
1,643 |
3.0 |
|
CCC Transfer Entitlement |
27,691 |
27,766 |
28,867 |
1,101 |
4.0 |
|
Cal Grant C |
6,944 |
6,148 |
5,753 |
-395 |
-6.4 |
|
By Award Type: |
|||||
|
Cal Grant B |
209,725 |
218,107 |
224,377 |
6,270 |
2.9 |
|
Cal Grant A |
111,745 |
113,302 |
114,842 |
1,540 |
1.4 |
|
Cal Grant C |
6,944 |
6,148 |
5,753 |
-395 |
-6.4 |
|
By Renewal or New: |
|||||
|
Renewal |
200,813 |
205,995 |
211,063 |
5,068 |
2.5 |
|
New |
127,602 |
131,559 |
133,906 |
2,347 |
1.8 |
|
Totals do not match across all categories due to modeling issues. Posted February 2017. |
|||||
Middle Class Scholarship Spending and Recipients
(Dollars in Millions)
|
2015-16 |
2016-17 |
2017-18 |
Change From 2016-17 |
||
|
Amount |
Percent |
||||
|
Spending |
|||||
|
CSU |
$36 |
$54 |
$54 |
— |
— |
|
UC |
12 |
20 |
20 |
— |
— |
|
Totals |
$48 |
$74 |
$74 |
— |
— |
|
Recipients |
|||||
|
CSU |
41,327 |
45,742 |
29,778 |
-15,964 |
-35% |
|
UC |
7,948 |
10,362 |
6,789 |
-3,573 |
-34 |
|
Totals |
49,275 |
56,104 |
36,567 |
-19,537 |
-35% |
|
Posted February 2017. |
|||||
California State Library Budget
(Dollars in Millions)
|
2015-16 |
2016-17 |
2017-18 |
Change From 2016-17 |
||
|
Amount |
Percent |
||||
|
Local Assistance |
|||||
|
Library Services and Technology Act |
$11.3 |
$11.3 |
$11.3 |
— |
— |
|
California Library Services Act |
1.9 |
6.6a |
3.6 |
-$3.0 |
-45.2% |
|
California Library Literacy and English Acquisition Program |
5.8 |
4.8 |
4.8 |
— |
— |
|
Statewide Library Broadband Services Program |
6.5 |
2.5 |
2.5 |
— |
— |
|
California Civil Liberties Public Education Program |
— |
1.0a |
— |
-1.0 |
N/A |
|
California Historical Society |
— |
1.0a |
— |
-1.0 |
N/A |
|
Telephonic Reading for the Blind |
0.6 |
0.6 |
0.6 |
— |
— |
|
Subtotals |
($26.0) |
($27.7) |
($22.7) |
(-$5.0) |
(-18.0%) |
|
State Operations |
|||||
|
State Library Services |
$20.9 |
$21.3 |
$20.8 |
-$0.5 |
-2.1% |
|
Library Development Services |
3.0 |
3.1 |
3.1 |
—b |
0.2 |
|
Information Technology Services |
2.0 |
2.0 |
2.0 |
— |
— |
|
Subtotals |
($25.9) |
($26.3) |
($25.8) |
(-$0.4) |
(-1.7%) |
|
Totals |
$51.9 |
$54.0 |
$48.6 |
-$5.4 |
-10.1% |
|
Funding |
|||||
|
General Fund |
|||||
|
Ongoing |
$31.4 |
$28.3 |
$27.9 |
-$0.4 |
-1.5% |
|
One Time |
— |
5.0 |
— |
-5.0 |
-100.0 |
|
Subtotals |
($31.4) |
($33.3) |
($27.9) |
(-$5.4) |
(-16.3%) |
|
Federal Trust Fund |
$18.1 |
$18.1 |
$18.1 |
—b |
—b |
|
Otherc |
2.4 |
2.6 |
2.5 |
-$0.1 |
-4.7% |
|
aIncludes funding for one-time initiatives in 2016-17 ($3 million for the California Library Services Act and $1 million apiece for the California Civil Liberties Public Education Program and California Historical Society). bLess than $100,000 or 0.1 percent. cIncludes California State Law Library Special Account, Central Service Cost Recovery Fund, and the Deaf and Disabled Telecommunications Program Administrative Committee Fund. |
|||||
California Institute for Regenerative Medicine
Research Grant Awards and Funding
September 2005 Through December 2016 (Dollars in Millions)
|
Grants Approved |
Original Amount Committed |
Award Reductions |
Revised Amount Committed |
Amount Dispersed |
Amount to be Disbursed |
|
|
Discovery Grants |
||||||
|
Basic biological research |
186 |
$284.9 |
$23.6 |
$261.3 |
$245.3 |
$16.0 |
|
Initial stem cell studies |
93 |
49.9 |
4.4 |
45.5 |
44.4 |
1.2 |
|
Start-up funding for faculty |
79 |
239.5 |
49.3 |
190.2 |
162.1 |
28.0 |
|
New research technologies |
64 |
85.5 |
4.5 |
81.0 |
70.3 |
10.7 |
|
Subtotals |
(422) |
($659.8) |
($81.8) |
($578.0) |
($522.1) |
($55.9) |
|
Translation Grants |
||||||
|
Early proof-of-concept |
78 |
$277.5 |
$31.8 |
$245.7 |
$238.3 |
$7.4 |
|
Pre-approval process with FDA |
19 |
79.9 |
5.8 |
74.1 |
29.4 |
44.7 |
|
Subtotals |
(97) |
($357.4) |
($37.6) |
($319.8) |
($267.7) |
($52.0) |
|
Clinical Grants |
||||||
|
Approval process with FDA |
70 |
$353.8 |
$62.8 |
$291.0 |
$258.8 |
$32.3 |
|
Clinical trials |
29 |
377.2 |
68.3 |
308.9 |
172.9 |
136.1 |
|
Subtotals |
(99) |
($731.0) |
($131.0) |
($600.0) |
($431.6) |
($168.3) |
|
Education Grants |
||||||
|
Conferences and workshops |
125 |
$2.7 |
$0.2 |
$2.5 |
$2.0 |
$0.4 |
|
Research training for students |
79 |
235.1 |
16.9 |
218.3 |
177.0 |
41.2 |
|
Subtotals |
(204) |
($237.8) |
($17.1) |
($220.7) |
($179.1) |
($41.6) |
|
Infrastructure Grants |
||||||
|
New facilities |
29 |
$413.0 |
$73.0 |
$340.0 |
$339.6 |
$0.4 |
|
Statewide support |
25 |
127.8 |
0.4 |
127.4 |
61.3 |
66.1 |
|
Subtotals |
(54) |
($540.8) |
($73.4) |
($467.4) |
($400.9) |
($66.5) |
|
Totals |
876 |
$2,526.9 |
$341.0 |
$2,185.9 |
$1,801.5 |
$384.4 |
|
FDA = Food and Drug Administration. Posted January 2017. |
||||||