
 Report in PDF
LAO Report
January 19, 2017Assessing UC and CSU Enrollment and Capacity
Executive Summary
Background
State Has Two Public University Systems. In 2015–16, the University of California (UC) enrolled 248,000 students at ten campuses and the California State University (CSU) enrolled 394,000 students at 23 campuses. UC is a research university, educating undergraduates, graduate students through the doctoral degree, and professional–school students. CSU educates undergraduates and graduate students, primarily through the master’s degree.
State Eligibility Policies One Key Factor Driving Enrollment. Under longstanding state policy, the top 12.5 percent of high school graduates are eligible to attend UC as freshmen and the top 33 percent are eligible to attend CSU as freshmen. Community college students are eligible to transfer to UC if they complete certain coursework with a 2.4 grade point average (GPA) and to CSU with a 2.0 GPA. These policies have generally guided state decisions in setting enrollment levels, although many factors can influence whether a student actually applies and enrolls at UC or CSU.
Campuses Have Current and Planned Enrollment Capacity. The Legislature has certain expectations regarding use of academic facilities during the fall through spring terms as well as summer term. These guidelines determine current capacity, or how much enrollment the systems can support within their existing facilities. Campuses also develop long–range land use plans that estimate planned capacity, or the amount of enrollment they could support if all planned facilities were constructed.
Legislation Requires Us to Assess Whether a New Campus Is Warranted in the Near Future. Chapter 22 of 2015 (SB 81, Committee on Budget and Fiscal Review) requires our office to review the need for new UC or CSU campuses, taking a systemwide perspective for UC and a regional perspective for CSU. In making our assessment, the legislation requires our office to consider a variety factors, including enrollment demand and enrollment capacity.
Major Findings
College Preparation Increasing Statewide. The proportion of high school graduates completing college preparatory work has increased from around 35 percent in the early 2000s to 43 percent by 2014–15. Some CSU and UC freshmen, however, still require remediation. In 2014–15, remediation rates were 40 percent at CSU and 19 percent at UC—down somewhat since 2000–01. Among community college students, 157,000 completed two years of full–time study in transferable coursework in 2014–15, a 67 percent increase over the 2000–01 level.
UC and CSU Likely Drawing From Beyond Freshman Pools for Admission. Both university systems receive many more freshman applicants and likely are admitting more freshmen than their freshman eligibility pools under state policy. For transfer admission, UC reports admitting all eligible applicants, whereas CSU reports denying admission to roughly 11,000 applicants, the bulk of whom apply to a nonlocal campus.
Freshman Participation Has Been Increasing at CSU, Relatively Steady at UC. The proportion of high school graduates enrolling at CSU as freshmen has increased from 10 percent in 2000 to 14 percent in 2015. At UC, the rate has been relatively steady, hovering around 8 percent.
California Has a Relatively Highly Educated Population. In 2014, 32 percent of adult Californians held at least a bachelor’s degree, slightly above the national average. California currently ranks 14th among states for its attainment rate, one spot below its 2005 ranking.
Significant Regional Variation in College Preparation, Participation, and Attainment. High school graduates from more urban counties generally are more likely than graduates from rural counties to complete college preparatory work and enroll at UC and CSU. Urban counties also generally have a higher proportion of adults who have attained at least a bachelor’s degree.
Campuses Have Significant Room to Grow. Both systems report using their existing facilities less than the Legislature’s guidelines. For the fall through spring terms, UC and CSU report using their facilities at 84 percent and 90 percent of the guidelines, respectively. Summer enrollment is at about 20 percent of fall enrollment at UC and 6 percent of fall enrollment at CSU—both well below the state’s expectations. Furthermore, both systems indicate having room to grow based on their campuses’ long–term plans.
Assessment
Report Assumes 11 Regions for CSU Analysis. As the state has no formal set of regions that it consistently uses for CSU purposes, we explored various options, ultimately selecting a set of 11 regions already used by the state for various education programs. In our view, these regions provide one reasonable approach, though other regional breakdowns also could be reasonable.
Modest Enrollment Growth Projected Over Period. High school graduates are expected to increase modestly between 2016–17 and 2024–25. Based on this forecast, we project UC would enroll 11,000 more resident students (5 percent) in 2024–25 compared to 2016–17. For CSU, we project enrollment growth for eight of the eleven regions, with total growth of 15,000 resident students (4 percent) over the 2016–17 level.
Significant Capacity Available at UC and CSU. Whereas UC is projected to grow by 11,000 students between now and 2024–25, we estimate that it has capacity through existing and planned facilities to accommodate at least triple this number of students. Whereas CSU is projected to grow a total of 15,000 students, we estimate it could accommodate 92,000 in its existing facilities and another 139,000 students were the campuses to construct new facilities according to their long–range plans. We find that every CSU region could accommodate projected enrollment growth.
New Campus Not Warranted at this Time. Given UC and every CSU region could accommodate projected enrollment within existing campuses, we conclude that new campuses are not warranted at this time. Because both UC and CSU have capacity significantly beyond projected enrollment growth, new campuses likely would not be warranted even if the Legislature were to change its underlying assumptions. For example, even were the Legislature to expand freshman eligibility, new campuses likely would not be warranted in the near future.
Introduction
Report Assesses Whether State Should Construct New University Campuses. Chapter 22 of 2015 (SB 81, Committee on Budget and Fiscal Review) requires our office to assess whether the state should construct new University of California (UC) or California State University (CSU) campuses. Chapter 22 requires our office to take statewide and regional approaches for UC and CSU, respectively. This report fulfills these requirements. (The appendix contains the text of the legislation.)
Report Focuses on Access for Resident Undergraduates. Longstanding state policy has focused on providing access for students from in–state high schools and community colleges to attend UC and CSU as undergraduates. Chapter 22 affirms this focus by requiring our office to analyze certain data, such as projections of public high school graduates, that pertain to resident undergraduate enrollment. Though we focus on resident undergraduates throughout the report, we include graduate students and nonresident students in some relevant parts of our analysis, such as when evaluating campus capacity. Unless otherwise noted, we cite enrollment in terms of full–time equivalent students (reflecting the number of units taken) rather than headcount (reflecting the total number of students regardless of units taken).
Report Comprised of Three Main Sections and an Appendix. In the first section, we provide background on enrollment and capacity. In the second section, we present key findings from our analysis of the data required by Chapter 22. Most notably, we examine state and county data on college preparation, admissions, enrollment, and capacity. Due to the amount of data required by Chapter 22, we summarize our findings in the section but include county–specific data in an appendix. In the final main section, we assess whether the state should construct a new campus.
Back to the TopBackground
In this section, we provide background on (1) the state’s goals for providing students access to public higher education, (2) ways the state can gauge enrollment demand, (3) current UC and CSU campuses and their enrollment, and (4) ways the state can measure campus capacity.
State Goals for Access
Master Plan Is the State’s Key Policy Document for Access. Written in 1960, the California Master Plan for Higher Education established a number of key higher education policies for the state’s public sector. Most relevant for this report, the Master Plan set forth each of the three segments’ missions and student eligibility policies. The state and the segments historically have based their enrollment, budget, and capacity decisions upon these policies.
Master Plan Assigns Each Public Segment a Different Mission. The Master Plan envisions UC as the state’s primary public research university and directs it to grant bachelor’s, master’s, and doctoral degrees. It calls for CSU to focus on instruction in the liberal arts and grant bachelor’s and master’s degrees. The California Community Colleges (CCC) are to provide basic skills instruction, career technical education, and lower–division instruction. The Master Plan sets forth that CCC is to grant associate degrees and certificates and prepare students to transfer to four–year colleges.
Master Plan Has Each Public Segment Differing in Selectivity and Cost. Each segment caters to somewhat different student populations. The CCC system is to be open access for all students over the age of 18, CSU is to be somewhat selective, and UC is to be the most selective segment. Each segment also has different expected costs. Because of its research mission, UC has the highest per–student cost, CSU has the next highest cost, and CCC has the lowest cost.
Master Plan Sets Different UC and CSU Eligibility Policies. Consistent with its vision for UC to be more selective than CSU, the Master Plan sets higher freshman and transfer eligibility standards for UC. For freshman eligibility, UC is to draw from the top 12.5 percent of public high school graduates, whereas CSU is to draw from the top 33 percent. For transfer eligibility, UC is to admit students who have completed lower–division coursework with at least a 2.4 grade point average, whereas CSU is to admit those having at least a 2.0 grade point average. The transfer function is intended both to (1) provide students who do not qualify for freshman admission an opportunity to earn a bachelor’s degree and (2) reduce costs for students seeking a bachelor’s degree by allowing them to attend CCC for their lower–division coursework.
UC and CSU Establish Systemwide Freshman Admission Requirements. For freshmen, the university systems are responsible for setting specific admission criteria intended to reflect their respective eligibility pools. As a minimum criterion, both systems require high school students to complete a series of college preparatory courses known as the “A–G” series. The series includes courses in math, science, English, and other subjects. To qualify for admission, students must complete this series while earning a certain combination of course grades and scores on standardized tests.
Freshman Admission Criteria Periodically Reassessed. To gauge whether the universities are drawing from their freshman eligibility pools, the state funds “eligibility studies.” These studies examine public high school graduates’ transcripts to determine the proportion of students eligible for each university system. If the proportion is significantly different from 12.5 percent and 33 percent for UC and CSU, respectively, the universities are expected to adjust their admission policies accordingly. For example, UC tightened its admission criteria after an eligibility study conducted in 2003 found it drawing from the top 14.4 percent of public high school graduates. The last eligibility study was conducted in 2007. The 2015–16 budget provided $1 million for the Office of Planning and Research to complete a new eligibility study by December 1, 2016. (As of the release of this report, the study was not yet published.)
UC and CSU Assess Entering Freshmen for Proficiency. Though UC and CSU admit only students who have completed the college preparatory A–G course series, they require freshmen to demonstrate proficiency in certain areas prior to enrolling. UC requires students to demonstrate proficiency in writing, whereas CSU requires students to demonstrate proficiency in both English and math. Students have a number of options for demonstrating proficiency, including attaining certain scores on state tests, advanced placement tests, SAT tests, or placement tests administered by the universities. Based on test results, the universities place some students into remedial courses.
Admission Rules Differ for Transfer Students. The university systems set general education and pre–major course requirements for transfer admission. Transfer students completing these courses and meeting the Master Plan’s grade point average requirements are eligible for admission. Unlike for freshmen, UC and CSU do not have set eligibility pools for transfer students. Also in contrast to freshmen, UC and CSU do not test transfer students’ proficiency prior to enrolling them or require them to complete remedial coursework.
Legislature Recently Directed UC and CSU to Report on Potential Changes to Eligibility Policies. The 2016–17 budget requires UC and CSU to develop plans to produce 250,000 and 480,000 more bachelor’s degrees, respectively, by 2030 than projections made by the Public Policy Institute of California. To reach these targets, the budget specifies that the university systems could each consider changes that would broaden eligibility, increase enrollment, or improve graduation rates. The segments are required to submit their reports to the Legislature by March 2017.
UC Focuses on Systemwide Access. UC guarantees eligible students access to its system but does not guarantee them admission to a particular campus. Campuses that receive more applicants than they can accommodate have higher admission standards than the minimum requirements to be eligible to the system. Eligible students not admitted to a UC campus of their choice are referred to less selective campuses. Currently, Merced is the sole referral campus for freshmen, and both Merced and Riverside are referral campuses for transfer students.
CSU Generally Considered a Regional System. Unlike UC, CSU has historically been considered a regional system, with many of its campuses generally drawing their enrollment from their surrounding areas. Historically, campuses that receive more eligible applicants than they can accommodate set “local admission areas” to determine which students are “local.” These campuses, in turn, guarantee admission for local students but increase admission standards for students from outside the local admission areas. In recent years, however, six campuses have decided no longer to guarantee admission to local eligible applicants. These six campuses instead only grant “priority points” to local applicants when evaluating their applications. Figure 1 identifies the admission guarantees currently offered by each CSU campus.
Figure 1
CSU Campuses’ Admission Guarantees
For Admission in 2017–18
|
All Eligible |
All Local |
None |
|
Bakersfield |
Chico |
Fresno |
|
Channel Islands |
Humboldta |
Fullerton |
|
Dominguez Hills |
Los Angeles |
Long Beach |
|
East Bay |
Monterey Bay |
San Diego |
|
Maritime Academy |
Northridge |
San Jose |
|
Stanislaus |
Pomona |
San Luis Obispo |
|
Sacramento |
||
|
San Bernardino |
||
|
San Francisco |
||
|
San Marcos |
||
|
Sonoma |
||
|
aFor freshman admission only. All eligible transfer applicants are guaranteed admission. |
||
CSU’s Regional Role Never Formalized. Despite CSU historically serving a regional function, neither state law nor the 1960 Master Plan formally establish a regional policy or set specific regions for the system. Lacking a formalized set of regions, the state has used different CSU regions for its new campus studies. For example, a 1957 new campus study considered 29 CSU regions, whereas the 1960 Master Plan considered 13 regions.
Enrollment Demand
Enrollment Demand Different From Access. Whereas access refers to which students are eligible to attend the public segments, enrollment demand considers how many eligible students want to attend them. Some students eligible for admission to UC or CSU might prefer to attend an in–state private university or an out–of–state university. Some UC–eligible students might prefer a CSU campus, and some UC– and CSU–eligible students might prefer to attend community college for their lower–division coursework. Other eligible students might prefer to enter the workforce directly after high school.
Demographic Changes One Factor in Measuring Enrollment Demand. The state typically has measured enrollment demand in a few ways. One way has been to look at changes in high school graduates. Assuming no other change, an increase in the number of California high school graduates causes a proportionate increase in the number of students eligible to enter UC and CSU as freshmen. An increase in freshman enrollment can contribute to an immediate increase in transfer enrollment, as UC aims to enroll one transfer student for every two freshmen and CSU typically enrolls at around a one–to–one ratio. Increases in high school graduates also can have a future effect on transfer enrollment, as some of those students will work their way through the transfer process at CCC over the course of a few years. Though not as direct an indicator, changes in the college–aged population (18–24 year olds) also can affect enrollment demand, as more than 90 percent of UC undergraduates and about 80 percent of CSU undergraduates are in this age group.
College Participation Rates Another Factor in Gauging Enrollment Demand. For any subgroup (for example, high school graduates), the percentage of individuals who are enrolled in college is that subgroup’s college participation rate. Other factors remaining constant, if participation rates increase (or decrease), then enrollment demand increases (or decreases). Participation rates can change due to a number of factors, including student fee levels, availability of financial aid, state and institutional efforts to promote college going, and the availability and attractiveness of other postsecondary and employment options.
Actual Enrollment Levels Affected by Available Funding. Though the demand for enrollment might change due to population growth or increases in college participation, actual enrollment at each segment depends heavily on the availability of funding. To align with their annual budgets, UC and CSU actively “manage” their enrollment levels. Some of the strategies the university systems use to manage enrollment include the changing of application deadlines (shortening them to reduce enrollment, lengthening them to increase enrollment) and referring students to campuses where they did not apply (referring more students to reduce enrollment, referring fewer to increase enrollment).
Current Enrollment
UC Currently Enrolls 248,000 Students at Ten Campuses. Nine UC campuses enroll both resident and nonresident, undergraduate and graduate students and offer a broad array of academic programs. A tenth campus in San Francisco enrolls only graduate students in the health sciences. As Figure 2 shows, UC campuses vary in size. In 2015–16, five UC campuses enrolled more than 30,000 students, three enrolled between 10,000 and 30,000 students, and two enrolled fewer than 10,000 students. With the exception of San Francisco, all campuses enroll more undergraduate than graduate students, with graduate enrollment varying from one–quarter of total enrollment (at Berkeley and Los Angeles) to less than one–tenth (at Santa Cruz and Merced).
Figure 2
UC and CSU Campus Enrollment
|
Campus |
County |
Full–Time Equivalent Enrollment in 2015–16a |
||
|
Undergraduate |
Graduate |
Total |
||
|
University of California |
||||
|
Los Angeles |
Los Angeles |
30,928 |
9,162 |
40,090 |
|
Berkeley |
Alameda |
28,926 |
8,985 |
37,911 |
|
Davis |
Yolo |
27,717 |
5,916 |
33,633 |
|
San Diego |
San Diego |
27,385 |
5,556 |
32,941 |
|
Irvine |
Orange |
26,304 |
4,697 |
31,001 |
|
Santa Barbara |
Santa Barbara |
20,797 |
2,752 |
23,549 |
|
Riverside |
Riverside |
18,466 |
2,545 |
21,011 |
|
Santa Cruz |
Santa Cruz |
16,412 |
1,602 |
18,014 |
|
Merced |
Merced |
6,419 |
431 |
6,850 |
|
San Francisco |
San Francisco |
0 |
2,771 |
2,771 |
|
Subtotals |
(203,354) |
(44,417) |
(247,771) |
|
|
California State University |
||||
|
Northridge |
Los Angeles |
29,095 |
3,116 |
32,211 |
|
Fullerton |
Orange |
27,207 |
3,886 |
31,094 |
|
San Diego |
San Diego |
26,747 |
3,925 |
30,672 |
|
Long Beach |
Los Angeles |
26,601 |
3,721 |
30,322 |
|
San Jose |
Santa Clara |
21,234 |
4,193 |
25,427 |
|
San Francisco |
San Francisco |
22,782 |
2,605 |
25,387 |
|
Sacramento |
Sacramento |
22,214 |
2,065 |
24,279 |
|
Los Angeles |
Los Angeles |
19,289 |
3,180 |
22,469 |
|
Fresno |
Fresno |
18,140 |
2,295 |
20,435 |
|
Pomona |
Los Angeles |
18,723 |
1,019 |
19,742 |
|
San Luis Obispo |
San Luis Obispo |
18,635 |
851 |
19,486 |
|
San Bernardino |
San Bernardino |
14,820 |
1,645 |
16,465 |
|
Chico |
Butte |
14,802 |
993 |
15,795 |
|
East Bay |
Alameda |
10,961 |
2,106 |
13,067 |
|
Dominguez Hills |
Los Angeles |
9,446 |
1,532 |
10,977 |
|
San Marcos |
San Diego |
9,746 |
488 |
10,234 |
|
Bakersfield |
Kern |
7,736 |
991 |
8,727 |
|
Sonoma |
Sonoma |
7,668 |
632 |
8,300 |
|
Humboldt |
Humboldt |
7,433 |
490 |
7,923 |
|
Stanislaus |
Stanislaus |
6,731 |
857 |
7,587 |
|
Monterey Bay |
Monterey |
6,279 |
359 |
6,637 |
|
Channel Islands |
Ventura |
5,171 |
188 |
5,359 |
|
Maritime Academy |
Solano |
1,279 |
37 |
1,316 |
|
Subtotals |
(352,737) |
(41,174) |
(393,911) |
|
|
Totals |
556,091 |
85,591 |
641,682 |
|
|
aIncludes both resident and nonresident students. |
||||
CSU Enrolls 394,000 Students at 23 Campuses. All CSU campuses enroll resident and nonresident, undergraduate and graduate students, and almost all campuses offer a broad array of academic programs. The exception is the Maritime Academy, which focuses solely on maritime professions. Several campuses, most notably San Diego, also offer joint doctoral programs with UC, and a few recently have begun running a small number of independent doctoral programs. Graduate enrollment at each campus ranges from 3 percent to 16 percent of total enrollment. CSU campuses tend to be smaller than UC campuses, but significant variation exists across the CSU system. As Figure 2 shows, four campuses enroll more than 30,000 students, five campuses enroll between 20,000 and 30,000 students, seven campuses enroll between 10,000 and 20,000 students, and seven campuses enroll fewer than 10,000 students.
CSU Campuses Also Operate Off–Campus Centers Serving Undergraduates. At CSU only, campuses have established a number of off–campus sites that provide undergraduate instruction. These centers provide commuting undergraduate students with opportunities to take some or all of their coursework at a nearby center instead of the main campus. Several of CSU’s most recently constructed campuses converted or replaced former off–campus centers. The nearby box provides further information on CSU’s off–campus centers serving undergraduates.
CSU’s Undergraduate–Serving Off–Campus Centers
CSU Has 17 Undergraduate Centers. The California State University (CSU) formally recognizes seven sites as off–campus centers for undergraduate instruction—Antelope Valley (in Lancaster), Concord, Irvine, Palm Desert, Imperial Valley (in Calexico), Downtown San Francisco, and Stockton. These seven centers enroll undergraduate students whose instruction is supported with state funding and systemwide student tuition. In addition to these centers, CSU campuses provide undergraduate instruction at ten other sites. All courses at these ten centers are “extension,” meaning they are funded solely from campus fees charged to students enrolled in those courses and not supported with state and systemwide tuition funding. (The seven centers enrolling state–funded students also enroll extension students.)
Centers Enroll 4,100 State–Funded Students. The figure below lists the 17 centers and shows state–funded enrollment for the applicable sites. At those sites, state–funded enrollment in 2015–16 ranged from 1,133 students at the Irvine Center to 189 students at the Stockton Center. CSU’s central office does not compile data on extension enrollment.
Course Offerings Tend to Vary Based on Distance From Main Campus. Many centers are located within a one–hour drive from a main campus. These centers typically offer a limited set of programs, requiring students to take courses both at the center and the main campus to complete their degree requirements. Centers more distant from their main campus tend to offer a wider variety of courses so that students can complete their degrees entirely at the center. Historically, centers have provided only upper–division course offerings, expecting their students to complete lower–division coursework at a nearby community college.
CSU’s Undergraduate–Serving Off–Campus Centers
Full–Time Equivalent Enrollment in 2015–16
|
Center |
Main Campus |
State–Funded |
|
Irvine |
Fullerton |
1,133 |
|
Imperial Valley (Calexico and Brawley) |
San Diego |
790 |
|
Palm Desert |
San Bernardino |
783 |
|
Concord |
East Bay |
467 |
|
Antelope Valley (Lancaster) |
Bakersfield |
413 |
|
Downtown San Francisco |
San Francisco |
351 |
|
Stockton |
Stanislaus |
189 |
|
College of the Canyons (Santa Clarita) |
Bakersfield |
— |
|
Santa Barbara City College |
Channel Islands |
— |
|
Cottage Health System (Goleta) |
Channel Islands |
— |
|
Shata College University Center (Redding) |
Chico |
— |
|
Oakland |
East Bay |
— |
|
College of the Sequoias (Visalia) |
Fresno |
— |
|
Downtown Los Angeles Campus |
Los Angeles |
— |
|
Ukiah Center |
Sonoma |
— |
|
Temecula |
San Marcos |
— |
|
Canada College (Redwood City) |
San Francisco |
— |
|
Total |
4,127 |
|
|
aCSU does not compile data on extension enrollment at off–campus centers. |
||
Capacity
Two Aspects of Enrollment Capacity. First, campuses can accommodate a certain number of students based on the facilities that they currently operate (current capacity). Second, campuses typically can accommodate more students by constructing additional facilities on their existing sites (planned capacity). We discuss both concepts below.
Current Capacity Determined by Facility Use Guidelines. For any amount of facility space, the number of students that can be served depends on how extensively the buildings are used. The Legislature established guidelines in the 1970s for how often instructional space (classrooms and teaching laboratories) should be used. Both UC and CSU report to the Legislature biennially comparing their current facility use to these legislative guidelines. The Legislature has periodically reviewed and reaffirmed these guidelines, though UC consistently has maintained they set too high a standard.
Use Guidelines Comprised of Three Components. These components are: (1) how often rooms are available for use, (2) how often rooms are actually used, and (3) how often seats in a room are filled. Figure 3 shows the guidelines for classrooms and teaching laboratories. Classrooms are to be available for use from Monday to Friday, 8 am to 10 pm (70 hours per week) and actually used 75 percent of that time (53 hours per week). About two–thirds of classroom seats are to be filled throughout the week (35 seat hours per week). Teaching laboratories have lower expectations regarding seat hours per week. The guidelines do not set use expectations for non–instructional facilities, such as faculty offices or research.
Figure 3
Legislative Guidelines for Facility Use at UC and CSU
|
Room Category |
Room Availability |
Room Usage |
Seat Occupancy |
||||
|
Hours / Week |
Percent |
Hours / Week |
Percent |
Hours / Week |
|||
|
Classrooms |
70a |
75% |
53 |
67% |
35 |
||
|
Teaching Laboratories |
|||||||
|
Lower division |
45b |
61 |
28 |
85 |
23c |
||
|
Upper division |
45b |
49 |
22 |
80 |
18c |
||
|
aAssumes classrooms are available for use Monday through Friday, 8 a.m. to 10 p.m. bAssumes teaching laboratories are available for use Monday through Friday, 8 a.m. to 5 p.m. cUC does not classify its laboratories as lower or upper division. It instead uses an average of the two guidelines (20 hours per week). |
|||||||
Separate Use Guidelines Exist for Summer Term. Higher education institutions traditionally operate instructional programs during the fall through spring, with significantly fewer programs offered during the summer. The Legislature in the past has sought to increase the use of facilities during the summer to accommodate more students. Chapter 386 of 2009 (AB 1182, Brownley) established the state’s most recent expectations regarding summer enrollment at UC and CSU. At UC, summer enrollment is to be 40 percent of fall enrollment. For CSU campuses in urban areas, the expectation is the same. For CSU campuses in rural settings, summer enrollment is to be 25 percent of fall enrollment.
Planned Capacity Determined by Campus Land Use Plans. Both UC and CSU require their campuses to develop land use plans that guide their physical development as their enrollment grows. The university systems use different names for their campus plans. UC refers to these documents as long–range development plans and CSU refers to them as physical master plans. Though the names differ, the processes for formulating these plans are similar, including an environmental impact review and final approval by each system’s governing board. The campus plans show existing and anticipated facilities necessary to accommodate a specified enrollment level in the fall through spring terms over the next five to ten years. Though campus physical plans contain an upper limit (or planned capacity) on campus growth for this five to ten–year period, new growth limits can be established as the plans are renewed.
No Agreed Upon Optimal Campus Size. Little consensus exists on the ideal enrollment level and physical size of a campus. Existing UC and CSU campuses vary notably in enrollment. Moreover, even the largest UC and CSU campuses are significantly smaller than certain public university campuses in other states. For example, Ohio State University serves about 57,000 students—nearly one and a half times the largest UC or CSU campus. Existing UC and CSU campuses also vary notably in their footprints. For example, despite enrolling roughly the same number of students, CSU’s Northridge campus occupies about 30 percent more acreage than its San Diego campus. Though external constraints (such as environmental and community factors) exist for all campuses, these constraints typically can be overcome with creativity, compromise, and monetary contributions.
Back to the TopFindings
This section describes several key components of data that Chapter 22 required us to review. As we were required to examine county–level data, we provide most of this data in the appendix, with a few summary figures provided below. For historical trends, we provide most data going back to 2000–01.
College Preparation
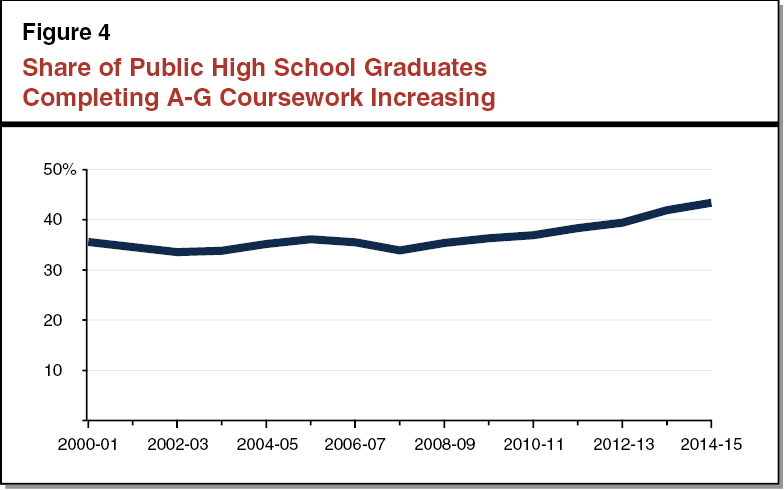
More High School Students Completing A–G Than Are Eligible for Freshman Admission. As Figure 4 shows, 43 percent of public high school graduates completed A–G coursework in 2014–15. This exceeds the share of public high school graduates from which UC and CSU are to draw under the Master Plan. The share of public high school students completing A–G coursework hovered at about 35 percent during the first half of the 2000s, but increased steadily beginning in 2007–08. This recent increase could be due to heightened interest in attending college and more focus on preparing students for college, with some high schools now requiring students to complete A–G coursework in order to earn a high school diploma.
Significant Regional Variation in Share of Students Completing A–G Coursework. A–G completion rates by county range from a high of 61 percent in Marin to a low of 11 percent in Inyo. Generally, coastal counties in the Bay Area and Southern California have higher rates than the statewide average, whereas less populous and inland counties have lower rates. Various factors could explain these regional differences. For example, research suggests that parental income is associated with student success in school, and regions with lower completion rates tend to have lower average household incomes. Some counties also have higher rates because their high schools more commonly require A–G completion as part of their graduation requirements.
Many Students Completing A–G Coursework Deemed Not College Ready in Certain Subjects. In 2015, 40 percent of entering CSU freshmen were not proficient in math or English, while 19 percent of entering UC freshmen were not proficient in writing. Remediation rates have improved at both systems over the last 15 years, decreasing from highs of 65 percent at CSU and 28 percent at UC. These declines likely reflect a combination of improved instruction at secondary schools and changes in the university systems’ remediation policies. As an example of the latter, CSU now allows high school students to determine if they are college ready prior to enrolling in their senior year. If not college ready, high school students can enroll in appropriate coursework during their senior year, with the goal of demonstrating college readiness prior to enrolling at CSU.
Number of Transfer–Prepared Students Increasing Statewide. Community colleges track the number of “transfer–prepared” students who have completed 60 transferable units. Since 2000–01, the number of these students has increased nearly every year. In 2014–15, 157,760 students completed 60 transferable units, a 67 percent increase over the 2000–01 level.
Regional Variations in Number of Transfer–Prepared Students Correspond to Differences in Overall CCC Enrollment. Transfer–prepared students are heavily concentrated in coastal counties, particularly in Southern California. These regions also have the greatest concentration of CCC enrollment. By contrast, regions in more rural areas of the state tend to have fewer transfer–prepared students, as well as fewer CCC students overall.
Applications, Admissions, and Enrollment
More Students Applying for Freshman Admission Than Are Eligible Under Master Plan. In 2015, 21 percent of high school graduates applied to UC for freshman admission and 41 percent applied to CSU. This means that applicants notably exceed UC’s and CSU’s respective freshman eligibility pools.
UC and CSU Likely Admitting More Freshmen Than Called for Under Master Plan. In 2015, 13 percent of high school graduates were admitted to UC and 30 percent to CSU. Because some eligible students do not apply to UC and CSU, the university systems are drawing from even larger pools of students than these percentages suggest, with both systems very likely exceeding their Master Plan freshman eligibility targets.
UC Admitting All Eligible Transfer Applicants, CSU Denying Admission to Some Applicants. UC reports that it admits all eligible transfer applicants. CSU, by contrast, reports denying admission to about 11,000 eligible transfer students. Specifically, 12 CSU campuses report denying admission to eligible transfer students. Most of these denied students applied to a campus that was outside their local area.
About Half of Californians Admitted to UC and CSU as Freshmen Choose to Enroll. As of 2015, 54 percent of California high school students admitted to UC as freshmen decided to enroll, while the comparable figure for CSU was 45 percent. Both rates have been steady in recent years, although both are lower as compared to 2000 (59 percent at UC and 56 percent at CSU). Transfer rates (76 percent at UC and 74 percent at CSU) are much higher than the systems’ respective freshman rates.
Enrollment at Both UC and CSU Has Increased Over Last Decade. Compared to their 2006–07 levels, resident undergraduate enrollment in 2015–16 was about 12,000 students (7 percent) higher at UC and about 44,000 students (15 percent) higher at CSU. Resident undergraduate enrollment at both systems likely will increase further in 2016–17, as the annual state budget acts established enrollment growth targets.
Enrollment Has Declined at CSU Off–Campus Centers. Enrollment at CSU’s centers has fluctuated more than enrollment at its main campuses, with significant increases sometimes followed by significant decreases. In the early 2000s, enrollment steadily increased, nearly doubling prior to the start of the most recent recession. The establishment of two new centers during this time—Antelope Valley and Canada College—largely account for this increase. Enrollment subsequently declined during and after the recession. Several campus leaders indicated to us that they reduced enrollment at their centers to consolidate enrollment at their main campuses and reduce administrative costs. Total enrollment at the centers was 2,166 students (37 percent) higher in 2014–15 than 2000–01.
Enrollment Demand
Number of Public High School Graduates Has Steadily Increased. In 2014–15, nearly 427,000 students graduated from a public high school in California, an increase of about 110,800 students (35 percent) over the 2000–01 level. More than half of this increase came from the state’s southern counties (Los Angeles, Orange, San Diego, San Bernardino, and Riverside), which also comprise more than half of the state’s high school graduates.
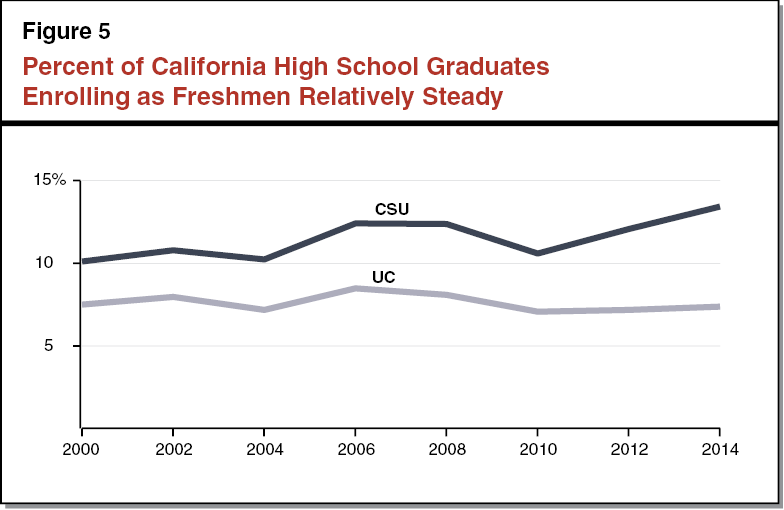
Freshman College Participation Rates Relatively Steady at UC and CSU. Figure 5 shows the percent of California high school graduates enrolling in UC and CSU within one year of graduation. Between 2000 and 2014, participation rates were relatively stable at UC, hovering around 8 percent, while rates increased at CSU from 10 percent to 13 percent. During this time, we estimate total participation in four–year institutions (including in–state private and out–of–state institutions) increased from 28 percent to 34 percent. (Calculating a comparable participation rate for transfer students is more difficult because not all community college students intend to transfer.)
Freshman College Participation Rates Vary by Region. San Francisco sends the highest percent of its high school graduates to UC and CSU as freshmen, with the county sending about 20 percent of its graduates to each system. For UC, Bay Area counties tend to have the highest participation, whereas the Central Valley and northern counties have the lowest. For CSU, the trend is similar, but its participation rates are higher than UC’s rates for several Central Valley counties, including Fresno and Stanislaus.
Educational Attainment
California’s Bachelor’s Degree Attainment Slightly Above National Average. In 2014, 32 percent of adult Californians had a bachelor’s degree or higher, compared to 30 percent of adults nationally. Educational attainment in California and the nation has slightly increased over the past decade. In 2005, 30 percent of adult Californians and 27 percent of adults nationwide had a bachelor’s degree or higher. California’s attainment rate ranked 14th among states in 2014, one spot below its 2005 ranking.
California’s Bachelor’s Degree Attainment Varies by Region. Regional variation in educational attainment is similar to variation in college preparation and participation, with counties in the Bay Area and Southern California generally at or above the state average and Central Valley and Northern California areas below.
Capacity
Use of Current UC and CSU Space Below Legislative Guidelines. The university systems report biennially to the Legislature on the number of hours students sit in class (known as student contact hours) compared to the legislative use guidelines. Both systems report classroom use below the guidelines (82 percent at UC and 89 percent at CSU) but teaching laboratory use above the guidelines (103 percent at UC and 105 percent at CSU). Because the vast majority of instruction occurs in classrooms, overall use of instructional space relative to the legislative guidelines is 84 percent at UC and 90 percent at CSU. (Our figures reflect the most recent facility use data available from each segment—fall 2014 for UC and fall 2015 for CSU.)
Both Systems Assert They Are Much Closer to Current Capacity. . . Though their reports on classroom and laboratory space show UC and CSU below the legislative guidelines, both systems assert they are much closer to capacity after factoring in the use of other space. Most notably, UC asserts that its campuses use research space to teach undergraduate courses. CSU asserts that its campuses teach courses in spaces such as faculty offices and conference rooms when classrooms or laboratories are occupied during peak hours or in poor condition.
. . . But Unable to Fully Substantiate Claim. UC was unable to quantify the amount of undergraduate instruction provided in research space or the capacity of that type of space. CSU, by contrast, was able to provide the number of students taught in other types of space besides classrooms and teaching labs. CSU estimates that it would be at 99 percent of capacity had these students been taught in classrooms and teaching labs. CSU, however, was unable to provide data on the amount of other space (such as faculty offices and conference rooms) currently being used for instruction.
Current Facility Use Below Summer Guidelines at Both Systems. In summer of 2015, UC enrolled about 20 percent of fall enrollment and CSU enrolled 2.1 percent of fall enrollment. At UC, summer use ranges from 26 percent at Los Angeles to 13 percent at Santa Cruz. At CSU, only two campuses (Maritime Academy and Bakersfield) had summer enrollment in excess of 10 percent of their fall enrollment.
CSU Off–Campus Centers Have Low Facility Use Year Round. CSU tracks the use of its facilities at its four state–owned off–campus centers (Concord, Palm Desert, Calexico, and Stockton). These sites have the lowest facility use in the CSU system, far lower than most CSU campuses. Because these centers are small relative to CSU’s main campuses, increasing their use would have a small effect on CSU’s overall capacity. Specifically, the centers could accommodate a total of around 3,500 additional students by increasing use of their existing facilities.
Both UC and CSU Have Substantial Room to Grow Under Their Long–Range Plans. In addition to reporting use of their existing facilities, both systems report their planned capacity under campuses’ long–range plans. Whereas UC indicates its campuses use their own facility guidelines when determining planned capacity, CSU estimates its planned capacity based on legislative guidelines. Using UC’s long–range plans, five UC campuses are below planned capacity. These five campuses could accommodate about 32,000 additional students, with more than half of these students accommodated at the Merced campus. (According to their long–range plans, the Berkeley, Davis, Los Angeles, and San Diego campuses already have exceeded their planned capacity by a combined 12,000 students.) At CSU, every campus has room to grow under their master plans, with the system able to accommodate a total of about 173,000 additional students (including about 1,000 students in state–owned off–campus centers). Whereas San Luis Obispo is very close to its planned capacity (with room for fewer than 100 additional students), six campuses have substantial remaining capacity (with room for more than 10,000 additional students).
Back to the TopAssessment
This section provides our analysis of whether a new UC or CSU campus is warranted at this time. We begin by describing the regions we use for our CSU analysis. We then provide enrollment projections for each university system and assess the capacity of each system to accommodate the projected growth.
CSU Regions
Analysis Sensitive to How CSU Regions Are Defined. As noted earlier, the state has never formalized CSU regions in state law, and in the past the state has used different regional breakdowns when evaluating whether to construct new CSU campuses. Various regional breakdowns could be viewed as reasonable, with the different approaches having distinct advantages and disadvantages. If we were to divide the CSU system into a few large regions, each region would have more campuses for accommodating enrollment growth, but more students would be located relatively far away from their local campuses. Alternatively, if we were to assume many small regions, more students would be located close to their local campus but those regions would have fewer campuses for accommodating enrollment growth. The exact regions selected could affect whether a new campus is deemed warranted.
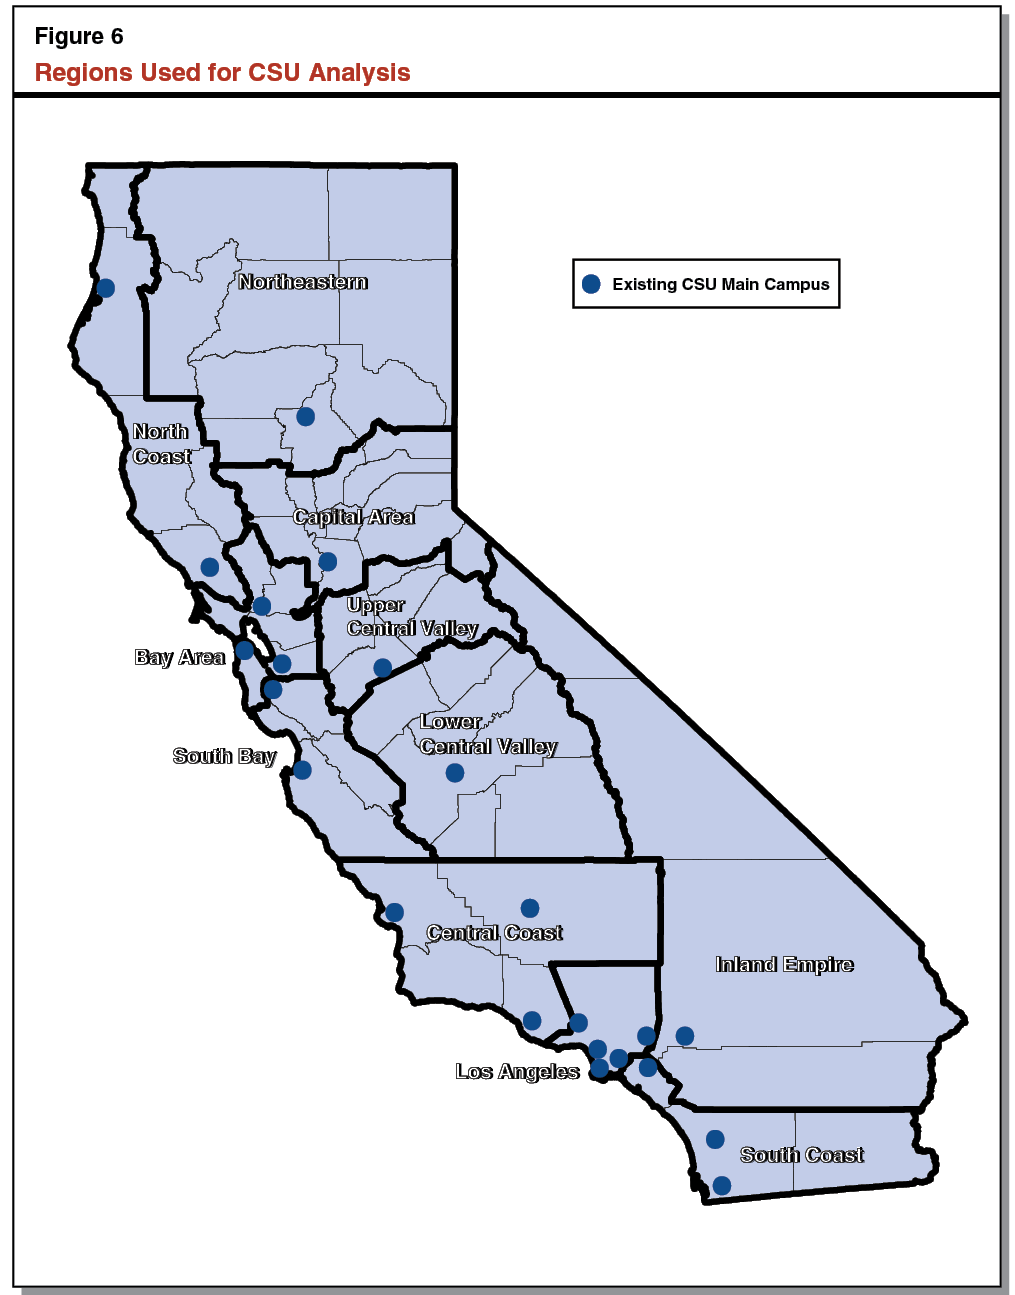
Analysis Assumes 11 CSU Regions. In selecting regions for our analysis, we looked for existing regional breakdowns already used for educational purposes that appeared, at a minimum, to take into account both population density and geographic continuity. We settled on using 11 regions corresponding to the California County Superintendents Educational Services Association regions. The state has used this 11–region breakdown for various educational planning and service delivery purposes. As Figure 6 shows, the 11 regions appear to balance population density and geographic continuity reasonably well, as evident from the geographically smaller regions in highly populated areas (such as Los Angeles county) and geographically larger regions in less concentrated areas (such as Northern California and the Inland Empire). Though we believe using this set of regions provides one reasonable approach for our analysis of CSU enrollment demand and capacity, we analyze two other regional approaches in a box at the end of the report.
Analysis Assumes New CSU Students Attend Regional Campus. For example, we assume new students from the Los Angeles region will attend one of that region’s five campuses (Dominguez Hills, Long Beach, Los Angeles, Northridge and Pomona). We believe this assumption is useful for planning purposes because it ensures every new student has access to their regional campus. Some students, however, likely will attend institutions in different regions and some institutions likely will draw heavily from other regions. For example, a handful of campuses (such as Chico, Humboldt, and San Luis Obispo) draw heavily from other regions in the state for their undergraduate enrollment.
Enrollment Projections
Enrollment Estimate for 2016–17 Based on Recent Data From UC and CSU. Both university systems indicate they currently are growing enrollment in 2016–17 to meet state budget enrollment targets. Based on information provided by the segments, we assume increases of 6,700 students (3.4 percent) at UC and 5,200 students (1.4 percent) at CSU in 2016–17 over 2015–16 levels.
Out–Year Enrollment Projections Based on Projections of High School Graduates. We assume growth in high school graduates will result in proportionate increases in incoming freshmen. We also assume that transfer enrollment will increase proportionately to freshmen (1:2 at UC and about 1:1 at CSU). For UC, we also assume proportionate increases in graduate enrollment, as the university system asserts that it relies heavily on those students to support new faculty instruction and research. (Because CSU is not designated as a research university, we do not assume a proportionate increase in graduate students at that system.)
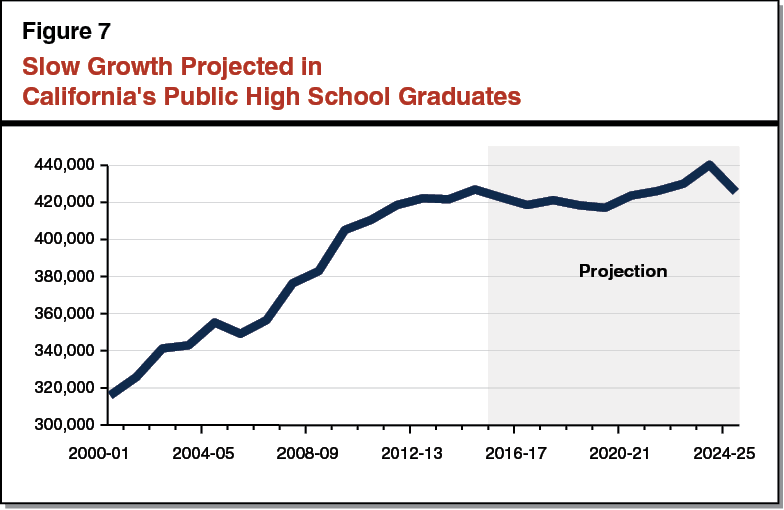
Little Growth in High School Graduates Over Projection Period. The Department of Finance’s Demographic Unit annually projects public school enrollment and high school graduates. Its model takes current enrollment in each elementary and secondary grade and carries forward each cohort into successive grades to forecast future enrollment. As Figure 7 shows, the department’s most recent projections indicate a slight decline in high school graduates until 2020, followed by slight increases the next few years, an uptick in 2023–24, and a decline the following year. In 2024–25, graduates are projected to be 7,100 (1.7 percent) higher than in 2016–17. Over the period, graduates are projected to grow at an average annual rate of 0.2 percent.
Based Upon Demographic Projections, Little Growth Expected in UC and CSU Enrollment Over Period. Because 2023–24 is projected to be the peak of the forecast period, we focus on growth through that year. We assume students graduating high school in spring 2024 enroll at UC and CSU as freshmen for the 2024–25 academic year. As Figure 8 shows, under our forecast, enrollment in 2024–25 would be 11,000 students (5 percent) higher at UC and 15,000 students (4 percent) higher at CSU than their 2016–17 levels. Under our forecast, each region at CSU would experience different rates of growth according to each region’s anticipated level of high school graduates. Whereas eight regions are expected to grow, two regions (North Coast and Northeastern) are projected to have flat enrollment, and one region (Los Angeles) is projected to have declining enrollment.
Figure 8
Little Enrollment Growth Projected at UC and CSU
Full–Time Equivalent Resident Enrollment
|
2016–17 Estimated |
2024–25 Projected |
Change |
||
|
Level |
Percent |
|||
|
UC, Systemwide |
203,000 |
212,000 |
11,000 |
5% |
|
CSU, by Region |
||||
|
Bay Area |
37,000 |
42,000 |
5,000 |
14 |
|
Capital Area |
24,000 |
26,000 |
2,000 |
8 |
|
South Bay |
29,000 |
31,000 |
2,000 |
7 |
|
Upper Central Valley |
8,000 |
10,000 |
2,000 |
25 |
|
Lower Central Valley |
20,000 |
22,000 |
2,000 |
10 |
|
Inland Empire |
16,000 |
18,000 |
2,000 |
13 |
|
Central Coast |
31,000 |
32,000 |
1,000 |
3 |
|
South Coast |
67,000 |
68,000 |
1,000 |
1 |
|
North Coast |
16,000 |
16,000 |
— |
— |
|
Northeastern |
15,000 |
15,000 |
— |
— |
|
Los Angeles |
111,000 |
109,000 |
–2,000 |
–2 |
|
Totals |
374,000 |
389,000 |
15,000 |
4% |
Projections Subject to Uncertainty. All long–term projections, including these enrollment projections, are subject to a level of uncertainty. Changing any underlying assumption—such as assuming higher or lower growth of high school graduates—would change UC and CSU enrollment projections. Notably, although Department of Finance projections of high school graduates have been fairly accurate one to two years out, their model in recent years has consistently underprojected actual high school graduates five to ten years out. As part of our analysis, we considered different scenarios with higher growth in high school graduates than assumed in our main forecast. These alternative scenarios did not fundamentally change the conclusions we discuss in the following section. Enrollment growth, however, could be significantly higher than projected were the state to change its eligibility policies. Expanding eligibility, in turn, could affect conclusions regarding the ability of UC and CSU to accommodate the additional students within existing and planned capacity.
Capacity
Analysis Estimates Current and Planned Capacity at Existing Campuses. The following analysis estimates how much, if any, additional capacity could be gained on existing campuses by maximizing use of existing facilities and constructing new facilities up to the campuses’ planned capacity. We assume the state maximizes current and planned capacity prior to constructing a new campus, as constructing a new campus is much more costly. (Though we focus on maximizing current and planned capacity, the nearby box discusses several other capacity–related options the state could explore prior to constructing a new campus.)
Other Options for Adding Capacity at Existing Campuses
In addition to maximizing existing and already planned capacity, the state has several other capacity–related options it could explore before building a new University of California (UC) or California State University (CSU) campus. Below, we discuss five such options.
Implementing Instructional Efficiencies. Instructional efficiencies include changes such as granting credit for college–level courses taken in high school and expanding online course offerings. Relative to more capital–intensive growth strategies, instructional efficiencies can take less time to implement and be less expensive. Associated costs generally are limited to one–time planning activities by faculty and staff.
Leasing Space. To accommodate increasing enrollment demand, campuses sometimes have leased space off the main campus. For example, several CSU campuses (such as Fullerton) lease space for their off–campus centers. Leased space has traditionally accommodated relatively few students, and it is most often a short–term strategy, used until main campuses have constructed new permanent facilities.
Reducing Nonresident Enrollment. UC and CSU currently enroll 31,000 and 18,000 nonresident undergraduate students, respectively. These students occupy space that could be used by resident students. Though creating room for more resident students, reducing nonresident enrollment could lead to a significant loss in revenue, as both systems charge nonresident students supplemental tuition. After backing out what each system asserts to be the instructional costs for undergraduate students, UC would forego around $16 million annually in nonresident tuition revenue for every 1,000 nonresident students replaced with resident students. The associated annual foregone revenue for CSU would be $4 million. Loss of revenue associated from nonresident enrollment could be backfilled with additional state funding or tuition increases or addressed by redirecting funding from other existing areas of the universities’ budgets.
Increasing Facility Use Expectations. Increasing the legislative facility use guidelines would increase each segment’s current capacity. For example, the Legislature could revise its fall expectation to require space to be available more hours per week. The Legislature would have many associated options—from increasing its expectation on the share of desks filled in each classroom throughout the week to expecting facilities be used a certain number of hours on the weekends. The Legislature also could expect campuses to use their summer facilities much more extensively.
Increasing Planned Capacity. Planned capacity is based on land use plans that are periodically updated. When campuses update their plans, they typically expand their long–range planning capacity. Another option for increasing capacity therefore is to encourage or require campuses to update their land use plans.
Analysis Assumes Campuses Operate at Capacity. For purposes of our analysis, we assume all campuses operate right at capacity. That is, we assume campuses already above capacity shift enrollment to campuses currently below capacity. For CSU, we make this assumption for campuses within each region. We then assume that campuses still below capacity increase enrollment up to their capacity as needed. Although we think this approach best preserves the integrity of the concept of capacity, campuses rarely reduce enrollment when they exceed their capacity. Were campuses now above capacity to continue to operate at their existing enrollment levels, UC and CSU would have more capacity than what is presented below.
University of California
Current Campuses Could Accommodate Tens of Thousands of Additional Students in the Fall Through Spring Terms . . . Because UC uses different approaches for calculating its current and planned capacity, two different estimates exist for how many additional students could be served at existing campuses. Systemwide, the capacity estimates range from about 20,000 additional students (using planned capacity data) to about 50,000 (using facility use data and assuming planned capacity is reached).
. . . And Many More Students in Summer. If UC were to attain the state’s summer enrollment standards, it could enroll about 16,000 more students. Because this standard is based on current fall enrollment, UC’s summer expectation would increase further were it to increase enrollment in those other terms. For example, if UC were to fully maximize use of its existing facilities in the fall, its summer expectation would rise by several thousand more students.
New UC Campus Not Warranted at This Time. Our analysis indicates UC has ample capacity to accommodate its projected enrollment growth of 11,000 additional students between now and 2024–25. By using its existing facilities more extensively throughout the year, we estimate UC could accommodate at least triple that amount. Increasing facility use in summer alone would be sufficient to accommodate all of UC’s projected enrollment growth. Even if demographically driven enrollment growth ultimately were to be higher than we assume or the Legislature were to expand eligibility, these results suggest UC has adequate capacity without building a new campus.
California State University
Capacity Analysis Varies by Region at CSU. Figure 9 shows how much capacity could be added by maximizing the use of current facilities and expanding according to campus facility plans. (Though CSU asserts that its campuses are closer to current capacity than its report on facility use suggests, our conclusions on whether to construct a new campus would not change had we used CSU’s preferred estimates.) As discussed further below, CSU could accommodate all its projected enrollment growth through current and planned facilities on existing campuses.
Figure 9
Current and Planned Capacity Sufficient to Accommodate Projected Enrollment Growth at CSU
|
Projected Enrollment Growth |
Maximize Use of Facilities |
Expand According to Campus Facility Plans |
Total Capacity |
|||
|
Fall Through Spring |
Summerb |
Total |
||||
|
Bay Area |
5,000 |
5,000 |
7,000 |
12,000 |
12,000 |
24,000 |
|
Capital Area |
2,000 |
1,000 |
5,000 |
6,000 |
4,000 |
10,000 |
|
South Bay |
2,000 |
4,000 |
6,000 |
10,000 |
10,000 |
20,000 |
|
Upper Central Valley |
2,000 |
1,000 |
1,000 |
2,000 |
5,000 |
7,000 |
|
Lower Central Valley |
2,000 |
1,000 |
4,000 |
5,000 |
8,000 |
13,000 |
|
Inland Empire |
2,000 |
—c |
1,000 |
1,000 |
6,000 |
7,000 |
|
Central Coast |
1,000 |
1,000 |
3,000 |
4,000 |
21,000 |
25,000 |
|
South Coast |
1,000 |
4,000 |
11,000 |
15,000 |
29,000 |
44,000 |
|
North Coast |
— |
2,000 |
2,000 |
4,000 |
7,000 |
11,000 |
|
Northeastern |
— |
2,000 |
2,000 |
4,000 |
4,000 |
8,000 |
|
Los Angeles |
–2,000 |
10,000 |
19,000 |
29,000 |
33 ,000 |
62,000 |
|
Total |
15,000 |
31,000 |
61,000 |
92,000 |
139,000 |
231,000 |
|
a2016–17 through 2024–25. bAssumes urban campuses enroll 40 percent of fall enrollment and rural campuses enroll 25 percent of fall enrollment in the summer term. cEnrolls more students than current enrollment capacity. |
||||||
Seven Regions Could Accommodate All Projected Enrollment Growth by Increasing Existing Facility Use to Legislative Guidelines. All regions but one could accommodate all their projected enrollment by increasing use of their existing facilities. Four regions (the Bay Area, South Bay Area, Central Coast, and South Coast) could accommodate all projected enrollment by using their existing facilities more extensively during the fall through spring terms. Three regions (Capital Area as well as the Upper and Lower Central Valley regions) could accommodate all projected enrollment by increasing facility use during the fall through spring and summer terms.
Every Region Could Grow on Existing Campus Sites. Inland Empire’s one campus (San Bernardino) has attained its current enrollment capacity and thus would need to construct new facilities to serve additional students. Inland Empire could accommodate all of its projected enrollment growth by building out a portion (about one–third) of its long–range facility plan. Every other region also has room to accommodate more students by adding new facilities according to their campuses’ long–range plans. The region with the most room under its planned capacity is Los Angeles (which could grow by 33,000 additional students).
New CSU Campus Not Warranted at This Time. As with UC, our analysis indicates CSU has ample capacity to accommodate its projected enrollment growth of 15,000 additional students between now and 2024–25. If they used their existing facilities during the fall and spring terms according to legislative guidelines, they could accommodate an additional 31,000 students. If CSU campuses used their existing facilities during the summer term according to legislative guidelines, CSU could accommodate another 61,000 additional students. Such results indicate CSU has considerable existing capacity even without building out existing campuses to their planned capacities. Were CSU to begin adding new facilities according to those long–range plans, it could accommodate another 139,000 students. Between reaching current capacity and building out to planned capacity, CSU could serve a total of more than 200,000 additional students. Given the magnitude of these results, various assumptions could be changed (such as assuming higher demographically driven enrollment growth or expanding eligibility policies) and CSU still likely would have ample physical capacity. Even using a different set of regions does not dramatically alter these results (as discussed in the box).
Results Using Different CSU Regions
CPEC Designated Regions
One Alternative Is to Use Regions Identified by the California Postsecondary Education Commission (CPEC). The CPEC was a state agency that coordinated efforts between the state’s three higher education segments. The agency’s responsibilities included collecting statewide data and reviewing new program and campus proposals. To aid in some of these activities, CPEC divided California into 14 regions. These regions share many similarities with the 11 regions used in our analysis. The key differences are that CPEC has separate regions for Superior California, the Inyo–Mono part of the state, and Orange County.
Region Closest to Capacity Is Orange County. Orange County’s one campus (Fullerton) is nearing its master planned enrollment. Current projections show declines in high school graduates in Orange County, however, suggesting that enrollment is not likely to grow at this campus. Even if enrollment were to grow at Fullerton, the state could require that campus to expand use of its facilities in the summer, expand use of the Irvine off–campus center, and adjust its long–range plan, prior to considering establishing a new campus within the county. Two other CPEC regions—Superior California and Inyo–Mono—have no estimated capacity because currently they do not have any campuses or off–campus centers. We believe this is the key disadvantage of basing a capacity analysis on the CPEC regions, as such an analysis suggests the state build two new campuses in outlying areas with low population density.
Regions Based on Existing Campuses
A Second Alternative Is to Assign One Region for Each of the California State University’s (CSU’s) 23 Campuses. Under this approach, each campus could be responsible for enrolling students in its region and would not redirect students to other campuses. When a campus reached its capacity, the state could establish a new campus in the region. Although having an additional campus in the region would reduce commuting time for some students, building the new campus would be substantially more expensive than expanding the existing campus.
Under Second Alternative, Two General CSU Campuses Already at Planned Capacity. These two campuses are Fullerton and San Luis Obispo. San Luis Obispo County is projected to have an increase in high school graduates of 144 students (5.6 percent) by 2023–24, and only a small portion of these students likely will attend the San Luis Obispo campus. Though the campus is already at planned capacity, it could accommodate this small level of growth by expanding its use of summer term. As discussed above, Orange County is projected to experience a decline in high school graduates.
Conclusion
Under current state policy, UC and CSU are projected to experience modest enrollment growth over the next decade. The state has many options to accommodate this growth at existing campuses, including by increasing the use of existing facilities and constructing new facilities. Because these options can accommodate all projected growth, we believe a new campus is not warranted at this time.