The 2018-19 Budget:
California's Fiscal Outlook
See a list of this year's fiscal outlook material, including the core California's Fiscal Outlook report, on our fiscal outlook budget page.
LAO Contact

November 15, 2017
The 2018-19 Budget
California's Fiscal Outlook
Proposition 98 Outlook
Executive Summary
Substantial Funding Available for Schools and Community Colleges in Coming Budget Cycle. Each year, the state calculates a “minimum guarantee” for school and community college funding based upon a set of formulas established by Proposition 98 (1988). Under our near‑term outlook, we estimate that the 2017‑18 guarantee is up $651 million (0.9 percent) from the level assumed in the June budget plan and the 2018‑19 guarantee is up $2.6 billion (3.4 percent) over the revised 2017‑18 level. After accounting for growth in the minimum guarantee and backing out prior‑year one‑time spending, among other adjustments, we estimate the Legislature would have $5.3 billion in uncommitted Proposition 98 funds to allocate in 2018‑19. The state could use this funding to reach full implementation of the Local Control Funding Formula (estimated to cost $2.7 billion) and provide select K‑14 programs a 1.8 percent cost‑of‑living adjustment (estimated to cost $228 million). Even after making these augmentations, the state would have another $2.4 billion available. A key decision for the Legislature will be the amount of this funding to allocate for ongoing versus one‑time activities. Ongoing augmentations would help districts manage various cost pressures, including notable increases in pension contributions, whereas one‑time funding would provide a buffer in case the guarantee drops in 2019‑20. Having such a buffer would mitigate possible future cuts to ongoing K‑14 programs.
Introduction
Report Provides Our Fiscal Outlook for Schools and Community Colleges. State budgeting for schools and the California Community Colleges is governed largely by Proposition 98, a constitutional amendment approved by California voters in 1988 and modified in 1990. The measure establishes a minimum funding requirement, commonly known as the minimum guarantee. In this report, we describe our outlook for the minimum guarantee over the next several years. The report has six sections. First, we explain the formulas that determine the guarantee. Next, we describe the key economic and revenue assumptions underlying our near‑term outlook. Third, we explain how our estimates of the 2016‑17 and 2017‑18 guarantees differ from the estimates included in the June budget plan. Then, we estimate the 2018‑19 guarantee and identify the resulting funding that would be available for new commitments. After focusing on the near‑term outlook, we estimate changes in the minimum guarantee through 2021‑22 under two economic scenarios and conclude by highlighting a few key trends over this period. (For the outlook for other programs in the state budget, see The 2018‑19 Budget: California’s Fiscal Outlook.)
Calculating the Minimum Guarantee
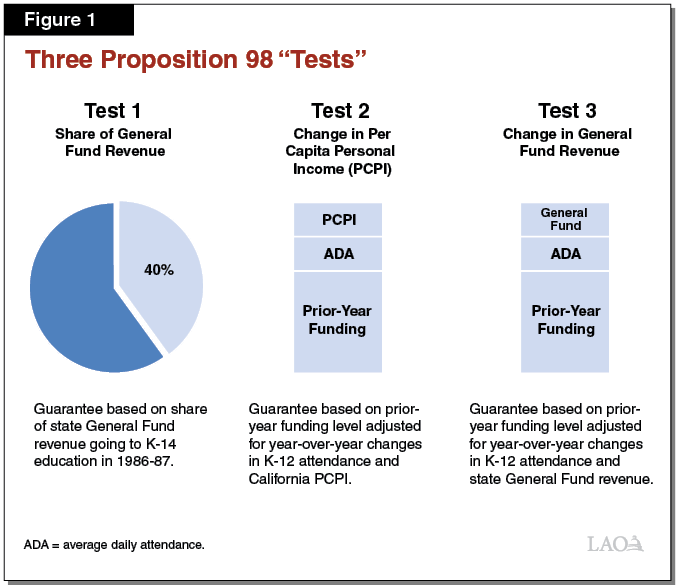
Minimum Guarantee Calculation Depends on Various Inputs and Formulas. The State Constitution sets forth three main tests for calculating the minimum guarantee. These tests depend upon several inputs, including K‑12 average daily attendance, per capita personal income, and per capita General Fund revenue (see Figure 1). The operative test that sets the guarantee is determined formulaically depending on these inputs. In most years, Test 2 or Test 3 is operative and the guarantee builds upon the level of funding provided the previous year. The state meets the guarantee through a combination of General Fund and local property tax revenue, with increases in property tax revenue usually reducing General Fund costs dollar‑for‑dollar. Though the state can provide more funding than required, in practice it usually funds at the guarantee. With a two‑thirds vote of each house of the Legislature, the state can suspend the guarantee and provide less funding than the formulas require that year.
“Maintenance Factor” Payments Required in Certain Years. In addition to the three main tests, the Constitution requires the state to track an obligation known as maintenance factor. The state creates a maintenance factor obligation when Test 3 is operative or when it suspends the guarantee. The obligation equals the difference between the actual level of funding provided and the Test 1 or Test 2 level (whichever is higher). Moving forward, the state tracks and adjusts the maintenance factor obligation each year for changes in K‑12 attendance and per capita personal income. In subsequent years, when General Fund revenue is growing relatively quickly, the Constitution requires the state to make maintenance factor payments until it has paid off the obligation. The magnitude of these payments is determined by formula, with stronger revenue growth generally requiring larger payments.
Estimates of the Guarantee Can Change After the Adoption of the Budget. The state does not finalize the minimum guarantee until the fiscal year is over. When the state updates the relevant inputs, the guarantee can change from the level initially assumed in the budget act. If the revised guarantee exceeds the initial estimate, the state makes a one‑time payment to “settle up” the difference for that year and uses the higher base for calculating the guarantee the following year. If the revised guarantee is below the initial estimate, the state can allow funding to remain at the higher level or make mid‑year adjustments to reduce funding to the lower guarantee. Either action affects the ongoing level of the minimum guarantee moving forward.
Key Economic and Revenue Assumptions
Near‑Term Outlook Assumes Continued Economic Expansion. Our outlook through 2018‑19 is based on a September 2017 consensus forecast of the U.S. economy prepared by Moody’s Analytics. This forecast anticipates continuing expansion of the U.S. economy. Using the data underlying this national forecast, we develop projections for near‑term trends in the California economy. Our California projections make assumptions about growth in employment, wages, and the stock market. In particular, we expect job growth to continue, but at a slower pace compared with recent years. We think this trend should result in rising wages and salaries over the next year or two. We also assume that stock market prices, which have risen substantially over the past two years (2016 and 2017), will stagnate over the coming two years. (Short‑term trends in the stock market, however, are particularly challenging to predict.)
Near‑Term Outlook Assumes Growth in State Revenue. Consistent with our economic assumptions, we estimate that state General Fund revenue will grow in the near term. The personal income tax accounts for most of the revenue growth, increasing nearly $8 billion (9.5 percent) in 2017‑18 and nearly $5 billion (5.4 percent) in 2018‑19. Revenue from the sales and use tax and the corporate tax also increases, albeit more slowly. Our revenue projections specifically assume the strong stock market growth experienced in 2017 will result in an increase in quarterly tax payments in the upcoming months of December, January, and April.
2016‑17 and 2017‑18 Updates
2016‑17 Proposition 98 Funding Level Unchanged Despite Small Drop in Guarantee. The June budget plan set overall Proposition 98 funding at $71.4 billion in 2016‑17. At the time, the state estimated that this allocation exceeded the minimum guarantee by $479 million. Due to a small reduction in General Fund revenue, we estimate the guarantee has dropped by $56 million. Despite this drop, we assume that the state maintains total Proposition 98 funding at the June level.
Increase in 2016‑17 Property Tax Revenue Reduces General Fund Costs. Though we assume total Proposition 98 funding remains unchanged in 2016‑17, our estimate of local property tax revenue is up $404 million (see Figure 2). The increase reflects updated property tax data for 2016‑17. The higher property tax revenue reduces Proposition 98 General Fund costs on a dollar‑for‑dollar basis.
Figure 2
Updating Prior‑ and Current‑Year Estimates of the Minimum Guarantee
(Dollars in Millions)
|
2016‑17a |
2017‑18 |
||||||
|
June Budget Plan |
November LAO |
Change |
June Budget Plan |
November LAO |
Change |
||
|
Minimum Guarantee |
|||||||
|
General Fund |
$50,488 |
$50,084 |
‑$404 |
$52,631 |
$52,766 |
$135 |
|
|
Local property tax |
20,902 |
21,306 |
404 |
21,892 |
22,408 |
516 |
|
|
Totals |
$71,390 |
$71,390 |
— |
$74,523 |
$75,175 |
$651 |
|
|
aIncludes General Fund provided on top of the minimum guarantee. |
|||||||
2017‑18 Guarantee Up $651 Million From Budget Act Estimate. For 2017‑18, the June budget plan funded at the minimum guarantee as estimated at that time. We now estimate that the guarantee is up $651 million (see Figure 2). This increase is due primarily to our assumption of higher General Fund tax revenue. The additional revenue requires the state to make a $1.4 billion maintenance factor payment, an increase of $858 million over the amount estimated in June. Such a payment would leave the state with no outstanding maintenance factor obligation. Offsetting some of the increase due to the higher maintenance factor payment is a roughly $200 million downward adjustment due to an estimated decline in K‑12 attendance.
Bulk of 2017‑18 Increase Covered by Higher Property Tax Revenue. Of the increase in the 2017‑18 guarantee, $516 million is covered by higher property tax revenue. Most of this increase is attributable to the higher property tax revenue in 2016‑17 carrying forward. In addition, data from county assessors show assessed property values increasing by 6.2 percent in 2017‑18, about 0.5 percentage point higher than the rate assumed in the June budget plan.
2018‑19 Budget Planning
Under Our Outlook, 2018‑19 Guarantee Grows $2.6 Billion Over Revised 2017‑18 Level. As Figure 3 shows, we estimate the minimum guarantee will grow from $75.2 billion in 2017‑18 to $77.7 billion in 2018‑19, an increase of $2.6 billion (3.4 percent). Test 2 is operative, with the change in the guarantee attributable to an increase in per capita personal income, partially offset by a modest decline in K‑12 attendance. State General Fund and local property tax revenue each cover about half of the $2.6 billion increase. The increase in property tax revenue is due to an estimated 5.9 percent increase in assessed property values, combined with somewhat slower growth in several smaller property tax components. (In the nearby box, we discuss how the guarantee would change if General Fund revenue comes in higher or lower than our outlook assumptions.)
Figure 3
Proposition 98 Near‑Term Outlook
(Dollars in Millions)
|
2016‑17 |
2017‑18 |
2018‑19 |
|
|
Minimum Guarantee |
|||
|
General Fund |
$50,084 |
$52,766 |
$54,079 |
|
Local property tax |
21,306 |
22,408 |
23,666 |
|
Totals |
$71,390 |
$75,175 |
$77,745 |
|
Change From Prior Year |
|||
|
General Fund |
$659 |
$2,682 |
$1,313 |
|
Percent change |
1.3% |
5.4% |
2.5% |
|
Local property tax |
$1,627 |
$1,102 |
$1,258 |
|
Percent change |
8.3% |
5.2% |
5.6% |
|
Total guarantee |
$2,287 |
$3,785 |
$2,570 |
|
Percent change |
3.3% |
5.3% |
3.4% |
|
General Fund Tax Revenuea |
$121,067 |
$130,138 |
$136,281 |
|
Growth Rates |
|||
|
K‑12 average daily attendance |
‑0.2% |
‑0.3% |
‑0.5% |
|
Per capita personal income (Test 2) |
5.4 |
3.7 |
4.0 |
|
Per capita General Fund (Test 3)b |
2.7 |
7.3 |
4.6 |
|
Operative Test |
3 |
2 |
2 |
|
Maintenance Factor |
|||
|
Amount created (+) or paid (‑) |
$1,279 |
‑$1,395 |
— |
|
Total outstandingc |
1,350 |
— |
— |
|
aExcludes non‑tax revenue and transfers, which do not affect the calculation of the minimum guarantee. bAs set forth in the State Constitution, reflects change in per capita General Fund plus 0.5 percent. cOutstanding maintenance factor is adjusted annually for changes in K‑12 attendance and per capita personal income. |
|||
Effect of Changes in State Revenue on the Guarantee
Higher Growth in State Revenue Unlikely to Increase the Guarantee. We examined the effect on the guarantee if General Fund revenue came in a few billion dollars above our outlook estimates in 2017‑18 or 2018‑19 (or in both years). None of these scenarios resulted in a higher minimum guarantee in 2017‑18 or 2018‑19. This dynamic is due primarily to the state having paid off its entire maintenance factor obligation under our outlook, such that additional revenue beyond what we assume does not trigger a higher maintenance factor payment. Moreover, the guarantee in both years is determined by growth in per capita personal income, with the guarantee unaffected by further increases in General Fund revenue. Counterintuitively, certain revenue increases could lead to lower minimum guarantees. For example, if revenue were to surge by a few billion dollars in 2017‑18 but none of the increase carried forward into 2018‑19, the slower year‑to‑year growth rate could result in a different test becoming operative and the guarantee in 2018‑19 falling from the estimate under our outlook.
Lower Growth in Revenue Likely to Reduce the Guarantee. We also examined the effect on the guarantee if General Fund revenue comes in below our estimates for 2017‑18 or 2018‑19 (or both years). Though we found that a modest revenue drop (up to roughly $1 billion in either or both years) likely would have no effect on the guarantee, further drops likely would reduce the guarantee. The reductions in the guarantee could be in the range of 40 to 50 cents for each dollar of lower revenue, with the specific amount depending on the timing and magnitude of the drop.
$5.3 Billion Available for Proposition 98 Priorities in 2018‑19. Our $77.7 billion estimate of the 2018‑19 guarantee is $3.2 billion higher than the $74.5 billion provided for schools and community colleges in 2017‑18 under the June budget plan. In addition, we estimate that another $2 billion is freed up inside the guarantee as a result of:
- Expiring One‑Time Funding. The 2017‑18 budget plan allocated $1.1 billion for one‑time initiatives (the largest allocation was for K‑12 discretionary grants). These initiatives do not continue in 2018‑19, freeing up the associated funding.
- Declining K‑12 Attendance. Most funding for schools flows through the Local Control Funding Formula (LCFF) and is adjusted automatically to reflect changes in K‑12 attendance. We estimate that lower attendance will reduce LCFF costs by more than $500 million.
- Proposition 39 Requirement Ending. Proposition 39 (2012) required the state to allocate funding for energy efficiency projects for five years. The state decided to meet this requirement by funding school and community college projects. This requirement ends in 2018‑19, freeing up $423 million in Proposition 98 funding. (Under legislation adopted earlier this year, grant recipients have until June 30, 2019 to spend down previously appropriated energy efficiency funds.)
These changes, in combination with the $3.2 billion increase in the minimum guarantee, result in the state having $5.3 billion in uncommitted funds for Proposition 98 programs in 2018‑19.
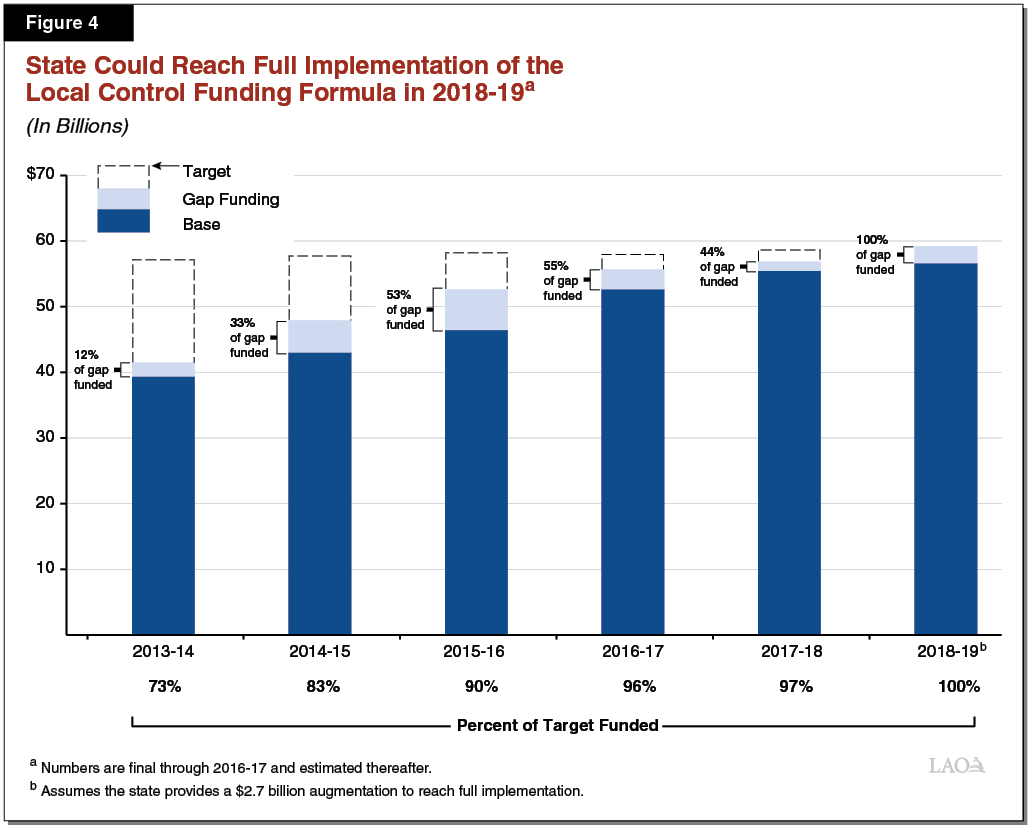
State Could Reach Full Implementation of LCFF in 2018‑19. In recent years, the state has dedicated a large portion of the increase in Proposition 98 funding to implementing LCFF. The state reached 97 percent of the formula’s target level in 2017‑18 (see Figure 4). Under our outlook, the state could reach full implementation of the formula in 2018‑19. Specifically, we estimate closing the remaining LCFF gap would cost $2.7 billion. Under this scenario, year‑over‑year per‑pupil LCFF funding would increase by 4.8 percent.
State Could Fund Additional Ongoing Augmentations. Under our outlook, the state would have $2.6 billion for other Proposition 98 priorities even after fully implementing LCFF. One of the state’s priorities the past several years has been to provide a cost‑of‑living adjustment (COLA) for certain K‑14 programs. For 2018‑19, we estimate the K‑14 COLA rate to be 1.8 percent. Providing this COLA to the K‑14 programs that received one last year would cost $228 million. This amount consists of $122 million for community college apportionments, $69 million for special education, $20 million for preschool, and $17 million for various other K‑14 programs. Another of the state’s priorities the past few years has been implementing a multiyear agreement to increase funding for the State Preschool Program. For 2018‑19, we estimate this agreement will require an additional $34 million. Finally, the Legislature recently established a program known as the California College Promise, which authorizes various community college activities to support college preparation, participation, and completion, including providing fee waivers for first‑year, full‑time community college students. The Chancellor’s Office estimates that providing these fee waivers in 2018‑19 would cost $31 million. Were the Legislature to contemplate further ongoing augmentations, it might choose to augment base LCFF rates and community college apportionments, as such an approach helps all districts accommodate higher base costs (due, for example, to rising pension costs).
State Usually Funds a Mix of One‑Time and Ongoing Initiatives. Although the state could allocate the entire $5.3 billion for ongoing programs, it tends to designate a portion of new Proposition 98 funds for one‑time purposes. The past five years, the state has allocated an average of 15 percent of new funds for one‑time purposes. Such an approach provides a measure of protection against future volatility in the minimum guarantee. If the guarantee experiences a year‑over‑year decline, the expiration of one‑time funding provides a buffer that reduces the likelihood of cuts to ongoing programs.
State Usually Signals How It Wants One‑Time Funding Spent. In recent years, the state has signaled its priorities but ultimately given school districts substantial discretion in deciding how to use one‑time funding. Specifically, the state has deemed providing professional development, purchasing instructional materials, upgrading technology, and addressing deferred maintenance to be high priorities for one‑time funding. Many school districts indicate they have spent one‑time funds on these priorities. A few districts indicate using one‑time funding to address retirement liabilities, in some cases achieving a significant reduction in their future costs. Regarding community college districts, the state has required most one‑time funds be spent for specified purposes, including deferred maintenance and special student support initiatives. Though the state has granted community colleges less control over one‑time funding, community colleges face similar cost pressures to school districts. Most notably, both school and community college districts are facing large unfunded retirement liabilities.
Outlook Through 2021‑22
Many Economic Scenarios Possible Over the Period. Over the next four years, state General Fund revenue will change due to various economic developments, such as changes in employment and fluctuations in the stock market. Changes in General Fund revenue, in turn, likely will have a significant effect on the minimum guarantee. In this section, we describe how the guarantee would change through 2021‑22 under two economic scenarios. The growth scenario assumes the California economy experiences steady increases in personal income and a mostly flat stock market over the next four years. The recession scenario assumes a moderate recession begins early in 2019‑20. These scenarios are illustrative, and neither represents a specific prediction about the future direction of the economy.
Under Growth Scenario, Minimum Guarantee Rises Steadily. The minimum guarantee increases steadily under the growth scenario from $75.2 billion in 2017‑18 to $87.3 billion in 2021‑22 (see Figure 5). The average annual increase is 3.8 percent. Under this scenario, the state could fund modest COLAs for school and community college programs. With remaining funds (roughly $2 billion per year), it could address other cost pressures facing districts, enhance or expand programs, and/or support one‑time initiatives.
Figure 5
Proposition 98 Outlook Through 2021‑22 Under Two Economic Scenarios
(Dollars in Billions)
|
2017‑18 |
2018‑19 |
2019‑20 |
2020‑21 |
2021‑22 |
|
|
Growth Scenario |
|||||
|
Minimum Guarantee |
$75.2 |
$77.7 |
$80.7 |
$83.8 |
$87.3 |
|
Year‑to‑year change |
— |
$2.6 |
$2.9 |
$3.1 |
$3.5 |
|
Percent change |
— |
3.4% |
3.8% |
3.9% |
4.2% |
|
General Fund Tax Revenuea |
$130.1 |
$136.3 |
$142.1 |
$148.5 |
$155.8 |
|
Key Growth Rates |
|||||
|
Per capita personal income (Test 2) |
3.7% |
4.0% |
4.8% |
4.5% |
3.7% |
|
Per capita General Fund (Test 3)b |
7.3% |
4.6% |
4.2% |
4.4% |
4.9% |
|
Operative Test |
2 |
2 |
3 |
3 |
1 |
|
Maintenance Factor |
|||||
|
Amount created (+) or paid (‑) |
‑$1.4 |
— |
$0.5 |
$0.1 |
‑$0.6 |
|
Total outstandingc |
— |
— |
0.5 |
0.7 |
0.1 |
|
Recession Scenario |
|||||
|
Minimum Guarantee |
$75.2 |
$77.7 |
$72.7 |
$70.4 |
$74.2 |
|
Year‑to‑year change |
— |
$2.6 |
‑$5.0 |
‑$2.4 |
$3.9 |
|
Percent change |
— |
3.4% |
‑6.4% |
‑3.3% |
5.5% |
|
General Fund Tax Revenuea |
$130.1 |
$136.3 |
$125.7 |
$116.0 |
$122.9 |
|
Key Growth Rates |
|||||
|
Per capita personal income (Test 2) |
3.7% |
4.0% |
1.7% |
0.7% |
3.9% |
|
Per capita General Fund (Test 3)b |
7.3% |
4.6% |
‑7.8% |
‑7.8% |
5.9% |
|
Operative Test |
2 |
2 |
1 |
1 |
1 |
|
Maintenance Factor |
|||||
|
Amount created (+) or paid (‑) |
‑$1.4 |
— |
— |
— |
— |
|
Total outstandingc |
— |
— |
— |
— |
— |
|
Comparison of Scenarios |
|||||
|
Minimum Guarantee |
|||||
|
Growth scenario |
$75.2 |
$77.7 |
$80.7 |
$83.8 |
$87.3 |
|
Recession scenario |
75.2 |
77.7 |
72.7 |
70.4 |
74.2 |
|
Difference |
— |
— |
$7.9 |
$13.4 |
$13.1 |
|
aExcludes non‑tax revenue and transfers, which do not affect the calculation of the minimum guarantee. bAs set forth in the State Constitution, reflects change in per capita General Fund plus 0.5 percent. cOutstanding maintenance factor is adjusted annually for changes in K‑12 attendance and per capita personal income. |
|||||
Under Recession Scenario, Minimum Guarantee Drops Sharply. The minimum guarantee declines under the recession scenario by $5 billion (6.4 percent) in 2019‑20 and a further $2.4 billion (3.3 percent) in 2020‑21. Test 1 is operative over the last three years of the period, with the guarantee receiving about 40 percent of General Fund revenue. The state’s recent practice is not to create any maintenance factor in Test 1 years, so the period ends with no maintenance factor outstanding despite the drops in the guarantee. Under this scenario, the state likely would need to make reductions to ongoing programs, though it could respond in various other ways, such as fund swaps or payment deferrals. The magnitude of the reduction in the guarantee (more than $7 billion over two years) highlights the importance of allocating at least some of the increase in 2018‑19 funding to one‑time activities. Such action would mitigate the need for steep reductions to ongoing programs under the recession scenario.
Key Trends
Property Tax Revenue Projected to Rise Steadily. In contrast to General Fund revenue, which tends to be highly sensitive to changes in the economy, property tax revenue typically grows at a steadier pace. Under the growth scenario, property tax revenue grows from $22.4 billion in 2017‑18 to $27.4 billion by 2021‑22. In this scenario, the $5 billion increase covers about 40 percent of the increase in the minimum guarantee over the period. Property tax revenue projections are driven primarily by assumptions about growth in assessed property values. We assume assessed values grow by about 6 percent per year, reflecting strong growth in real estate prices in recent years and the continuation of a modest recovery in new construction. We also assume that revenue shifted to schools and community colleges from former redevelopment agencies will increase more quickly as the debts and obligations of these agencies are retired. Under the recession scenario, property tax revenue could grow somewhat less quickly, though historically it has been much less sensitive to economic downturns than the minimum guarantee.
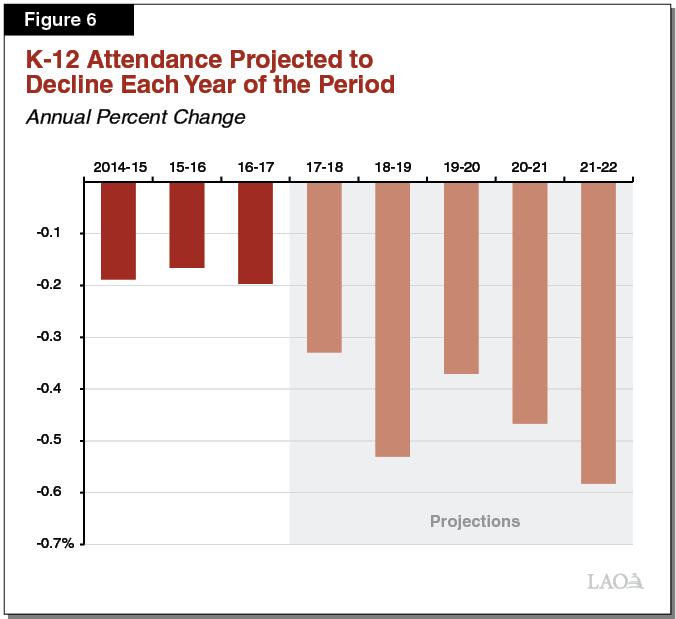
K‑12 Attendance Projected to Decline. K‑12 attendance grew at an average annual rate of 2.4 percent from the late 1980s to early 2000s, remained essentially flat from 2004‑05 through 2013‑14, and began declining in 2014‑15. We project this decline will continue over the period (see Figure 6). The primary attributing factor is our outlook for birth rates. Over the past decade, births have dropped from a peak of about 560,000 in 2007‑08 to about 490,000 in 2015‑16. We assume births remain roughly flat at this lower level and that the school‑age population declines as smaller cohorts of students gradually replace larger previous cohorts. Our outlook also assumes low and relatively stable rates of migration from other states and countries. The minimum guarantee does not drop for declining attendance unless attendance also has declined the two previous years. Given that attendance grew slightly in 2013‑14, this provision insulated the guarantee from declines in 2014‑15 and 2015‑16. In 2016‑17, however, declining attendance began affecting the guarantee, and we assume it continues to affect the guarantee throughout the period. Over the coming years, declining attendance also would result in somewhat lower costs for LCFF and other attendance‑driven programs.
Community College Enrollment Projected to Decline. Whereas K‑12 attendance is driven primarily by state demographics, community college enrollment is driven by a more complex set of factors—including demographics, the economy, and the state budget. Regarding demographics, the traditional college‑age population has been essentially flat in recent years. We anticipate this population will decline over the period, with 170,000 fewer individuals in 2021‑22 than 2016‑17 (reflecting a 4 percent drop). Regarding the economy and the state budget, these two factors often work in countervailing ways. For example, during economic expansions, more individuals are employed and less likely to seek education and training. Nonetheless, the state budget tends to be strong during economic expansions, with enrollment growth often a high priority. This dynamic has been at work in recent years, with enrollment dropping nearly 1 percent between 2015‑16 and 2016‑17 despite the state funding enrollment growth. Given all of these factors, we project a decline of a few percentage points in community college enrollment over the period. Community college enrollment does not affect the guarantee directly, but it does affect Proposition 98 funding available for other K‑14 priorities.
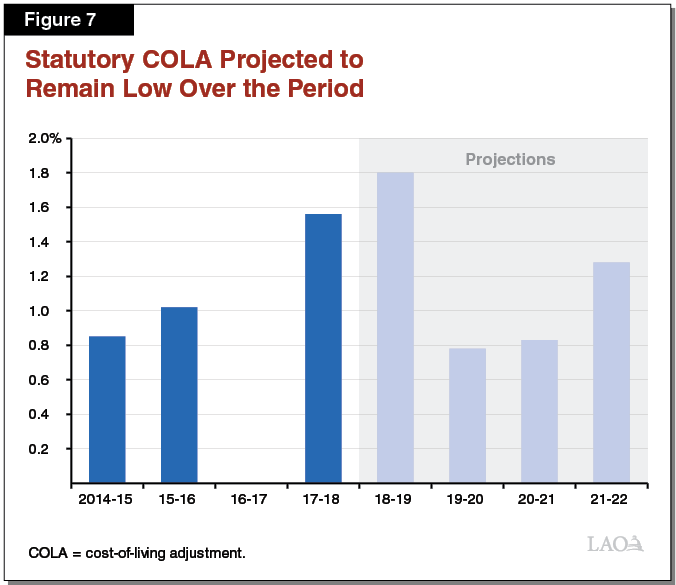
Statutory COLA Likely to Hover Around 1 Percent. The statutory COLA for applicable K‑14 programs is based upon a national price index for state and local governments. This index, calculated by the federal government, measures changes in employee compensation and other costs that affect governments around the country. Based on estimates provided by Moody’s Analytics, we assume the COLA remains low—hovering around 1 percent per year after 2018‑19 (see Figure 7).
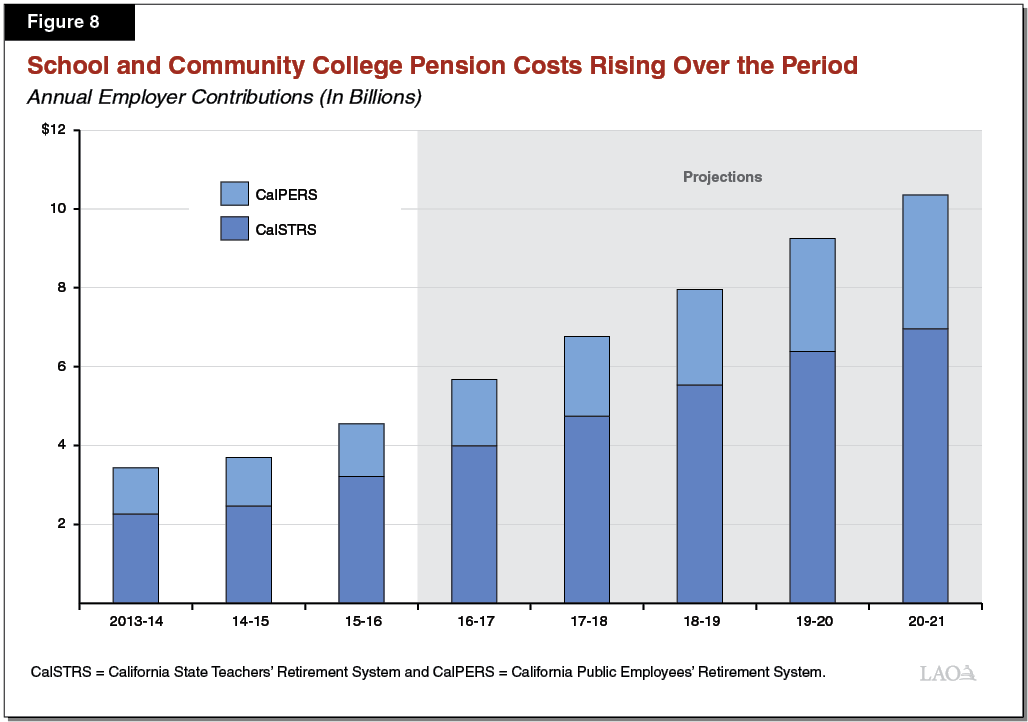
Pension Rates and Costs Rising Over the Period. Over the next several years, school and community college districts are set to experience continued increases in their contribution rates for the California State Teachers’ Retirement System (CalSTRS) and the California Public Employees’ Retirement System (CalPERS). CalSTRS administers pension benefits for teachers and other certificated employees, whereas CalPERS administers pension benefits for classified employees. The 2014‑15 budget included a plan to fully fund the CalSTRS pension system within about 30 years. Under the plan, district contribution rates increase from 8.3 percent of payroll in 2013‑14 to 19.1 percent by 2020‑21. The governing board of CalPERS also is taking action to address its liabilities. Over the same seven‑year period, it expects district contribution rates to increase from 11.4 percent to 23.8 percent. As Figure 8 shows, district contributions to the two pension systems have doubled over the past four years, increasing from $3.4 billion in 2013‑14 to $6.8 billion in 2017‑18. Over the next three years, the CalSTRS and CalPERS boards expect combined contributions to increase by another $3.6 billion, reaching $10.4 billion in 2020‑21.
Effect of Pension Cost Increases Varies Notably Under Two Outlook Scenarios. The increase in pension costs over next three years would equate to roughly 40 percent of the increase in the guarantee under our growth scenario. Under our recession scenario, pension costs would rise even as the guarantee dropped, magnifying the difficult decisions schools and community colleges would face.
Other Factors Drive Local Cost Pressures. Districts confront many cost pressures during their budget development and collective bargaining processes. Most notably, districts often face local pressure to increase salaries and, in some cases, reduce their student‑teacher ratios. Additionally, districts are experiencing rising health benefit costs. Though all districts face these pressures, districts vary widely in how they respond to them. In recent years, some districts have granted relatively large salary increases and hired additional staff, whereas others have granted smaller increases and hired fewer staff. Districts in the former group, in turn, are seeing greater growth in their pension costs than those in the latter group.