Related Publications
LAO Contact
- California Community Colleges
- California Student Aid Commission
- Affordability and Financial Aid
- Apprenticeship Programs
- University of California
- California State University

February 15, 2018
The 2018-19 Budget
Higher Education Analysis
- Introduction
- Higher Education In Context
- University of California
- California State University
- California Community Colleges
- California Student Aid Commission
- Summary of Recommendations
Executive Summary
In this report, we analyze the Governor’s higher education budget proposals. Below, we highlight key messages from the report.
University of California
Legislature Faces Key University of California (UC) Budget Decisions. UC’s budget is affected by certain key cost drivers—most notably employee compensation, enrollment growth, its academic quality initiatives, and facility projects. The Legislature likely will want to consider supporting certain faculty and staff compensation increases in 2018‑19. We note, however, that UC faculty salaries remain very competitive relative to other public universities that conduct intensive research. Regarding enrollment growth, we believe UC’s funding redirection plan to support 1,500 additional students in 2018‑19 generally is consistent with legislative intent. We recommend enrollment decisions for 2019‑20 be made within the context of any broader discussion on UC eligibility. We recommend the Legislature consider additional funding for UC’s academic quality initiatives as lower priority. Though UC’s student‑to‑faculty ratio has increased the past several years, its student outcomes have continued to improve. Finally, several of UC’s proposed capital outlay projects lack sufficient justification. For example, four projects entail relatively large, expensive expansions despite UC providing no systemwide analysis of existing unused capacity. Whatever cost increases it ultimately supports for UC, we encourage the Legislature to think about how to share those costs between the state and nonfinancially needy students. (The state covers tuition for financially needy students.)
California State University
Legislature Faces Similar Key Budget Decisions for California State University (CSU). CSU has similar cost drivers as UC—most notably, faculty and staff compensation, enrollment growth, the Graduation Initiative, and capital outlay. The Legislature likely will want to consider supporting compensation increases given CSU already has entered into contracts increasing its costs. We note, however, that recent faculty salary increases at CSU have far exceeded inflation and are generally higher than what other state workers and UC faculty have received. As regards enrollment growth, we recommend the Legislature set an overall enrollment target based on certain demographic and policy considerations, including the state’s recent finding that CSU is drawing from beyond its Master Plan freshman eligibility pool (admitting from the top 41 percent rather than the top 33 percent of high school graduates). As regards the Graduation Initiative, we identify a number of opportunities CSU has to improve course availability and student success using existing resources, such that lower priority could be placed on providing additional funding for this initiative in 2018‑19. Finally, we identified several serious deficiencies with CSU’s capital outlay requests and recommend the Legislature direct CSU to compile standard information, including stronger justifications for each project, and resubmit its proposals by early March.
California Community Colleges
Recommend Allocating Some California Community College (CCC) Funding Based on Performance. The Governor’s largest proposed higher education augmentation this year relates to implementing a new CCC funding formula. Specifically, the Governor proposes moving away from the almost entirely enrollment‑based CCC funding model to one based on three components: (1) enrollment, (2) low‑income student counts, and (3) performance. Given the strong incentives under the existing funding model to focus on enrolling students rather than accelerating their time to degree, we recommend the Legislature allocate less CCC funding based on enrollment and some portion based on performance. We suggest at least 20 percent of funding be performance based to ensure sufficiently strong incentives to focus on student completion and time to degree. Regarding specific performance measures, we recommend using the Governor’s proposed performance measures but refining them to ensure districts continue to focus on serving low‑income students and still offer relatively expensive programs that serve student needs (such as certain career technical education programs). We also recommend the Legislature combine the proposed funding for low‑income students with existing categorical funding for those students and offer districts more flexibility in how they serve these students. Enhanced flexibility could be coupled with more transparent district budgets indicating how these students are supported. Finally, we recommend the Legislature task the Chancellor’s Office with monitoring the approval of new program awards, grade‑related data, and changes in the types of degrees and certificates awarded to ensure the new funding system is working as intended.
Recommend Taking Time to Evaluate New Online College Proposal. The Governor’s next largest higher education proposal is to create a new online college. Initially, the college is intended to focus on short‑term program pathways for working adults with no postsecondary credentials. We believe some elements of the Governor’s proposal could have statewide benefits—for example, by expanding course access. The proposal, however, fails to clearly identify the key reasons why the target student group is currently not seeking or receiving more education. Moreover, research suggests the target student group is not particularly well suited for online instruction. The administration also has not explained how a statewide college would be able to foster sufficient industry partnerships given the regional nature of many industries. We encourage the Legislature to take its time in reviewing the proposal and consider alternatives. In particular, the Legislature could consider ways to improve online and competency‑based education reforms within the existing CCC system.
Recommend More Holistic Approach to Covering Unmet Living Costs for Financially Needy CCC Students. The Governor proposes to consolidate two financial aid programs that cover some living costs for full‑time community college students. Though the proposal consolidates two programs, it makes the underlying award rules even more complex. Layered onto an already complex financial aid system, the proposal could further complicate the financial aid landscape for students and administrators. We recommend the Legislature take a more straightforward approach—consolidating all four existing state financial aid programs for financially needy CCC students into one program with one set of rules. Under the new program, financially needy students would receive a grant for living costs that covered all their unmet need after taking into account their expected family contribution, federal aid, and a reasonable work expectation. As covering all unmet need for all financially needy full‑time CCC students would cost about $500 million compared to the $287 million earmarked for such aid under the Governor’s budget, the Legislature would have to consider how to ration awards or repurpose other funding to cover the full estimated program cost.
Introduction
In this report, we analyze the Governor’s higher education budget proposals. We begin by providing an overview of higher education in California. In the next four sections, we analyze the Governor’s budget proposals for the three public higher education segments and the California Student Aid Commission. In each of these sections, we provide relevant background, describe and assess the proposals, and make associated recommendations. The final section of the report consists of a summary of our recommendations. In addition to this report, we have three other higher education budget briefs that analyze the Governor’s proposals for adult education, the California Education Learning Lab, and Hastings College of the Law. The “EdBudget” section of our website contains many higher education budget tables, some of which are not included in this report.
Higher Education In Context
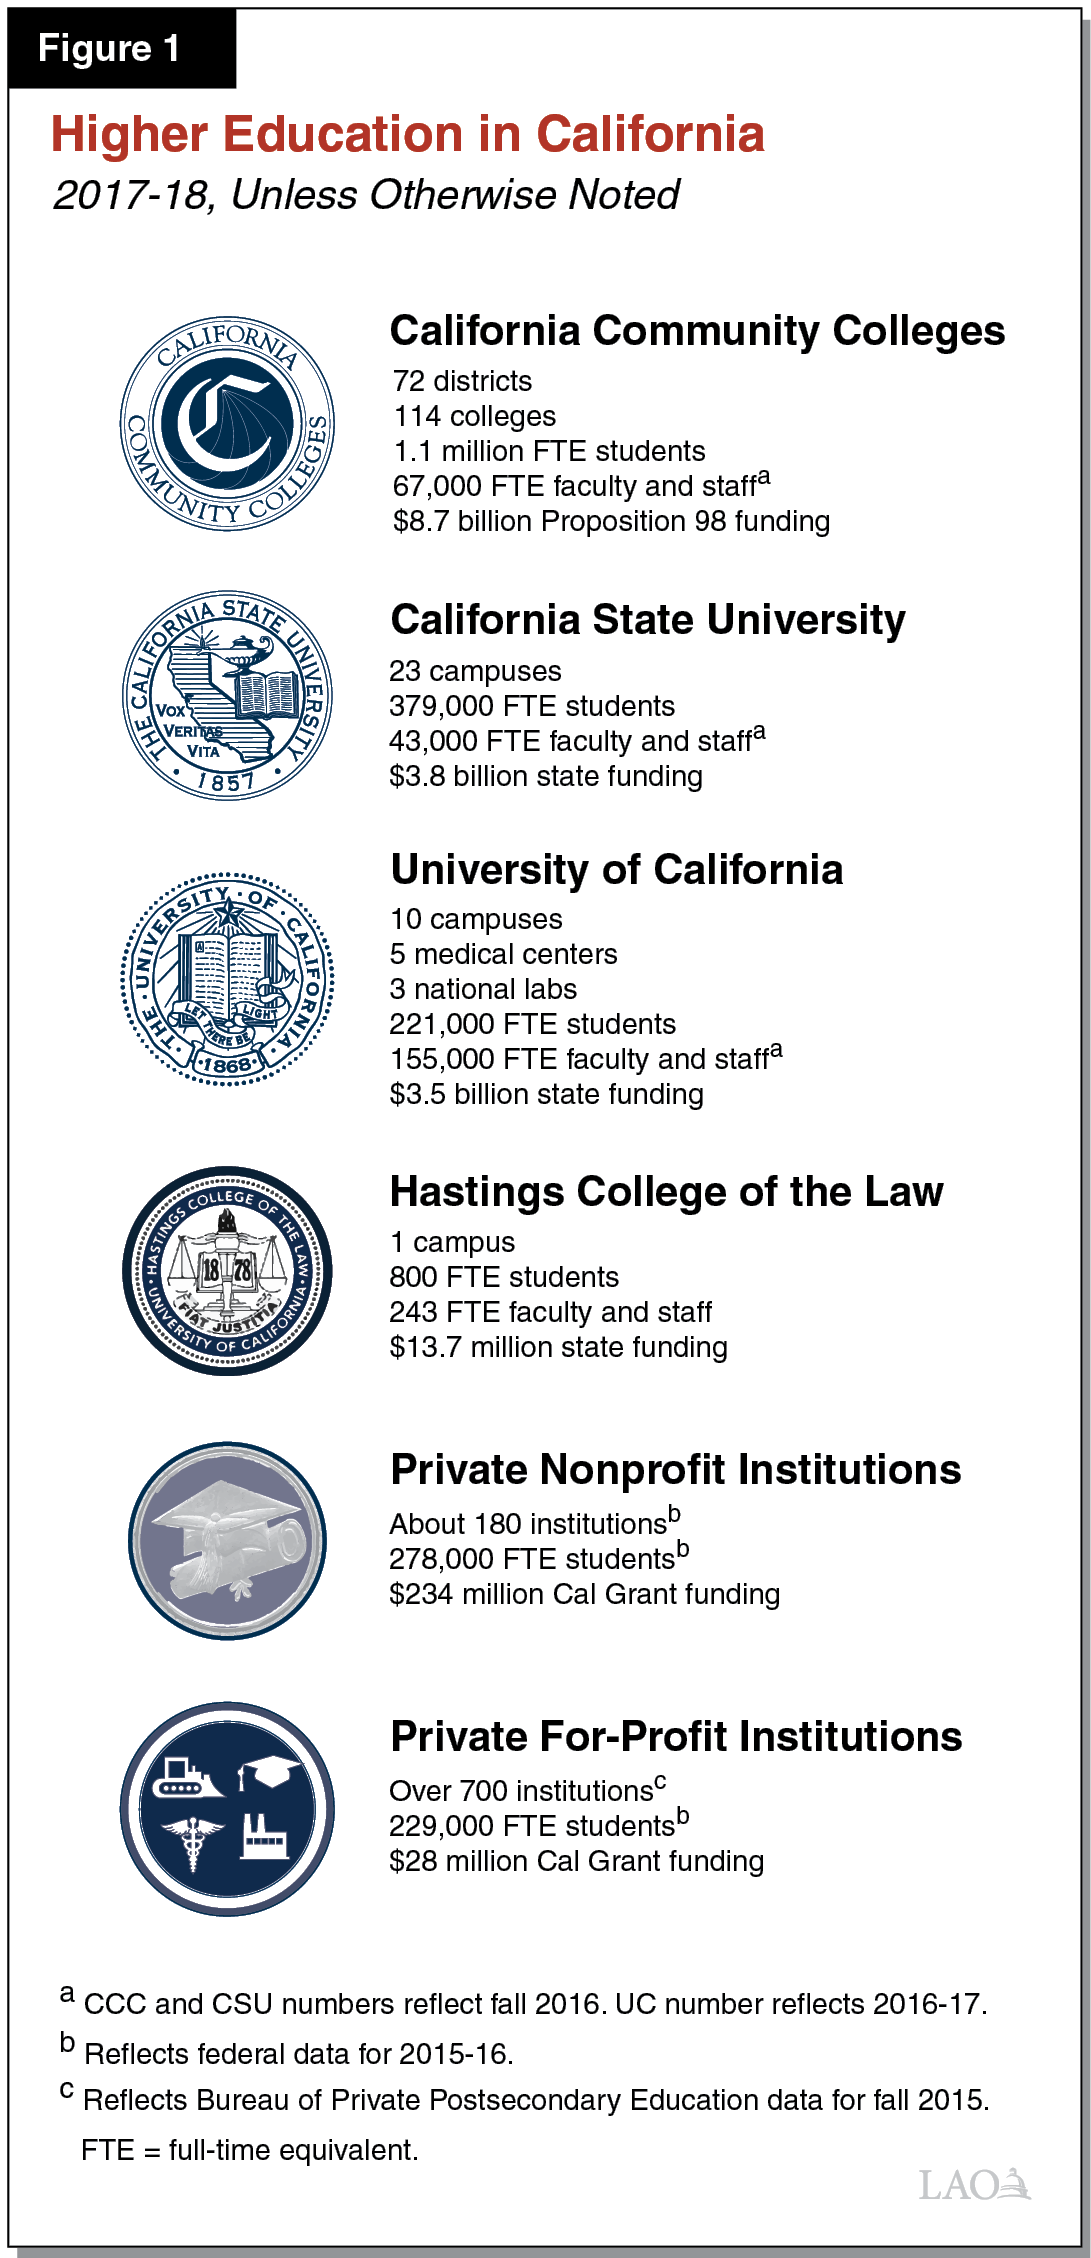
As Figure 1 shows, California has 114 California Community Colleges (CCC), 23 California State University (CSU) campuses, 10 University of California (UC) campuses, and 1 UC‑affiliated law school. Its private sector includes about 180 nonprofit colleges and universities and more than 700 for‑profit institutions. In this section, we focus primarily on the public sector—covering key issues relating to college eligibility, enrollment, and affordability.
Eligibility
Below, we provide background on the state’s eligibility policies, review the findings of a recent eligibility study funded by the state, and highlight issues for the Legislature to consider in light of these findings.
Background
Longstanding State Policies Determine Which Students Are Eligible to Attend Each Segment. In 1960, the state developed its Master Plan for Higher Education in California, which set forth eligibility policies for each of the public segments. Under the plan, all California residents may enroll in CCC. After completing lower‑division coursework with a minimum grade point average (GPA), CCC students may transfer to a public university. The Master Plan limits freshman admission to CSU and UC to the top one‑third and one‑eighth of high school graduates, respectively. Though never established in state law, these Master Plan policies have served as the basis for the universities’ admissions policies for the past six decades and influenced enrollment levels at all three public segments.
Policies Originally Intended to Tighten Freshman Access to Universities and Encourage Lower‑Division Instruction at CCC. Prior to the 1960 Master Plan, CSU and UC collectively drew from larger pools of high school graduates for freshman admission, with estimates of the proportion as high as 50 percent and 15 percent for CSU and UC respectively. Policymakers in 1960 elected to limit these proportions. In the original Master Plan report, policymakers cited five reasons for tightening freshman eligibility at the universities, including:
- Costs. Operating and capital outlay costs were lower at the community colleges than the universities. Costs were particularly high at UC because of its research mission. The authors of the Master Plan reasoned that focusing most enrollment growth at CCC would allow the state to support a more expansive higher education system.
- Access and Affordability. CCC was believed to be the most accessible of the three higher education segments to students, as that segment charges the lowest fees and generally serves local commuting students.
- Capacity. Several CSU and UC campuses at that time were believed to have reached enrollment levels that were “unmanageable.” Redirecting enrollment growth to CCC was seen as allowing the state to better control enrollment levels at those university campuses.
- Mission. Encouraging lower‑division enrollment at CCC was viewed as allowing CSU and UC to focus their resources on upper‑division and graduate instruction.
- Transfer Achievement. Data indicating that transfer students performed well at CSU and UC also was cited as a reason for focusing lower‑division coursework at CCC.
Transfer Eligibility Based on Grades Earned at CCC. In addition to setting policies for freshman eligibility, the Master Plan set expectations regarding transfer eligibility. Students at CCC who complete their lower‑division work and earn a minimum of a 2.0 GPA are eligible to attend CSU as upper division undergraduate students. To be eligible to attend UC as a transfers, students must earn a minimum of a 2.4 GPA in lower‑division CCC coursework.
Universities Are to Align Their Admission Policies With Their Respective Eligibility Pools. To draw from the top 33 percent and 12.5 percent of high school graduates, the university systems have historically structured their admission policies to require high school students to (1) complete college‑preparatory coursework and (2) attain a certain mix of high school GPA and scores on standardized aptitude tests (such as the SAT or ACT). We describe both requirements below:
- College Preparatory Coursework. Both university systems require students to complete a series of high school courses known as “A through G” (A‑G). The A‑G series includes courses in English, history, math, science, and other subjects. The share of high school graduates completing the A‑G series hovered around 35 percent from 2000‑01 through 2008‑09, before beginning to increase steadily over the next 7 years—reaching 45 percent in 2015‑16.
- Grades and Test Scores. Both university systems maintain an index of GPA and test scores that students must attain to be eligible for admission. Each index is devised such that a student with a lower GPA on A‑G courses must earn a higher test score to be eligible for admission. In order to draw from a smaller pool of students, UC’s index requires higher grades and test scores than CSU’s index.
UC Recently Developed Two Additional Freshman Admission Options. In addition to the statewide admission policy, students now have two other options to demonstrate eligibility at UC. Under the first of these options, known as “eligibility in the local context,” students in the top 9 percent of their high school are eligible to attend UC as freshmen—regardless of how they rank statewide. UC determines whether students are in the top 9 percent of their school based on high school GPA in A‑G courses, though students must still take the SAT or ACT. Under the second option, students who complete the A‑G series, have at least a 3.0 GPA, and take the SAT or ACT but do not meet either the statewide or the local admission criteria qualify for what is known as “comprehensive review.” A comprehensive review considers additional factors beyond overall grades and test scores, such as a student’s performance in their senior year, academic accomplishment in light of their life experiences, and special talents. Whereas students eligible under the statewide index or local context are guaranteed admission to UC, students qualifying for comprehensive review are not guaranteed admission. Instead, UC only views students who qualify for comprehensive review to be eligible once they are admitted. The combination of these three criteria (the statewide index, local context, and students admitted under comprehensive review) still are intended to draw from the top 12.5 percent of public high school graduates.
Eligible UC Students Not Ensured Access to Specific Campus or Major. While state policy is intended to guarantee eligible students admission to the UC system, it does not guarantee admission to students’ first‑choice campus or major. Eligible UC students who are not admitted to their campus of choice are referred to less selective campuses. Currently, Merced is the sole referral campus for freshmen. Merced and Riverside are referral campuses for transfer students.
Traditionally, CSU Attempts to Serve Eligible Students at Their Local Campus. In contrast to UC, high‑demand CSU campuses historically set “local admission areas” to determine which students are “local.” These campuses, in turn, guarantee admission for local students but increase admission standards for students from outside the local admission areas. This practice is intended to guarantee place‑bound students access to their nearby campus. Increasingly, more campuses are choosing to no longer guarantee admission to local students. CSU also does not have a systemwide referral policy for freshman applicants, though it does have a referral policy for transfer students who complete an associate degree for transfer. Due to some campuses not guaranteeing admission to local students and some eligible students not being referred to campuses with available slots, a proportion of eligible applicants (10 percent in 2016‑17) are not being admitted anywhere in the system. In response, the 2017‑18 Budget Act directed CSU to require all campuses to grant first priority admission to their local students and develop referral policies for students not admitted to the campus of their choice. (We provide more information regarding these efforts in the “CSU” section of this report.)
Universities’ Freshman Admission Criteria Periodically Assessed. To gauge whether the universities draw from their Master Plan eligibility pools, the state has funded what are known as “eligibility studies.” As part of these studies, CSU and UC admission counselors examine a sample of public high school transcripts and determine the number of students the universities would have admitted had these students applied. If the proportion of transcripts eligible for admission is significantly different from 33 percent and 12.5 percent for CSU and UC, respectively, the universities adjust their admission policies accordingly. For example, UC tightened its admission criteria after an eligibility study conducted in 2003 found it was drawing from the top 14.4 percent of public high school graduates. Since the 1960 Master Plan, the state has conducted eleven studies, with the last study conducted in 2015.
Findings From Recent Study
Results of Latest Study Recently Released. For the first time since 2007, the 2015‑16 budget provided funding for an eligibility study. The state provided $1 million to the Office of Planning and Research (OPR), which in turn contracted out the study to a private vendor. The vendor, which analyzed 77,000 transcripts from students graduating high school in 2015, completed the study in July 2017. We describe the results of the study below.
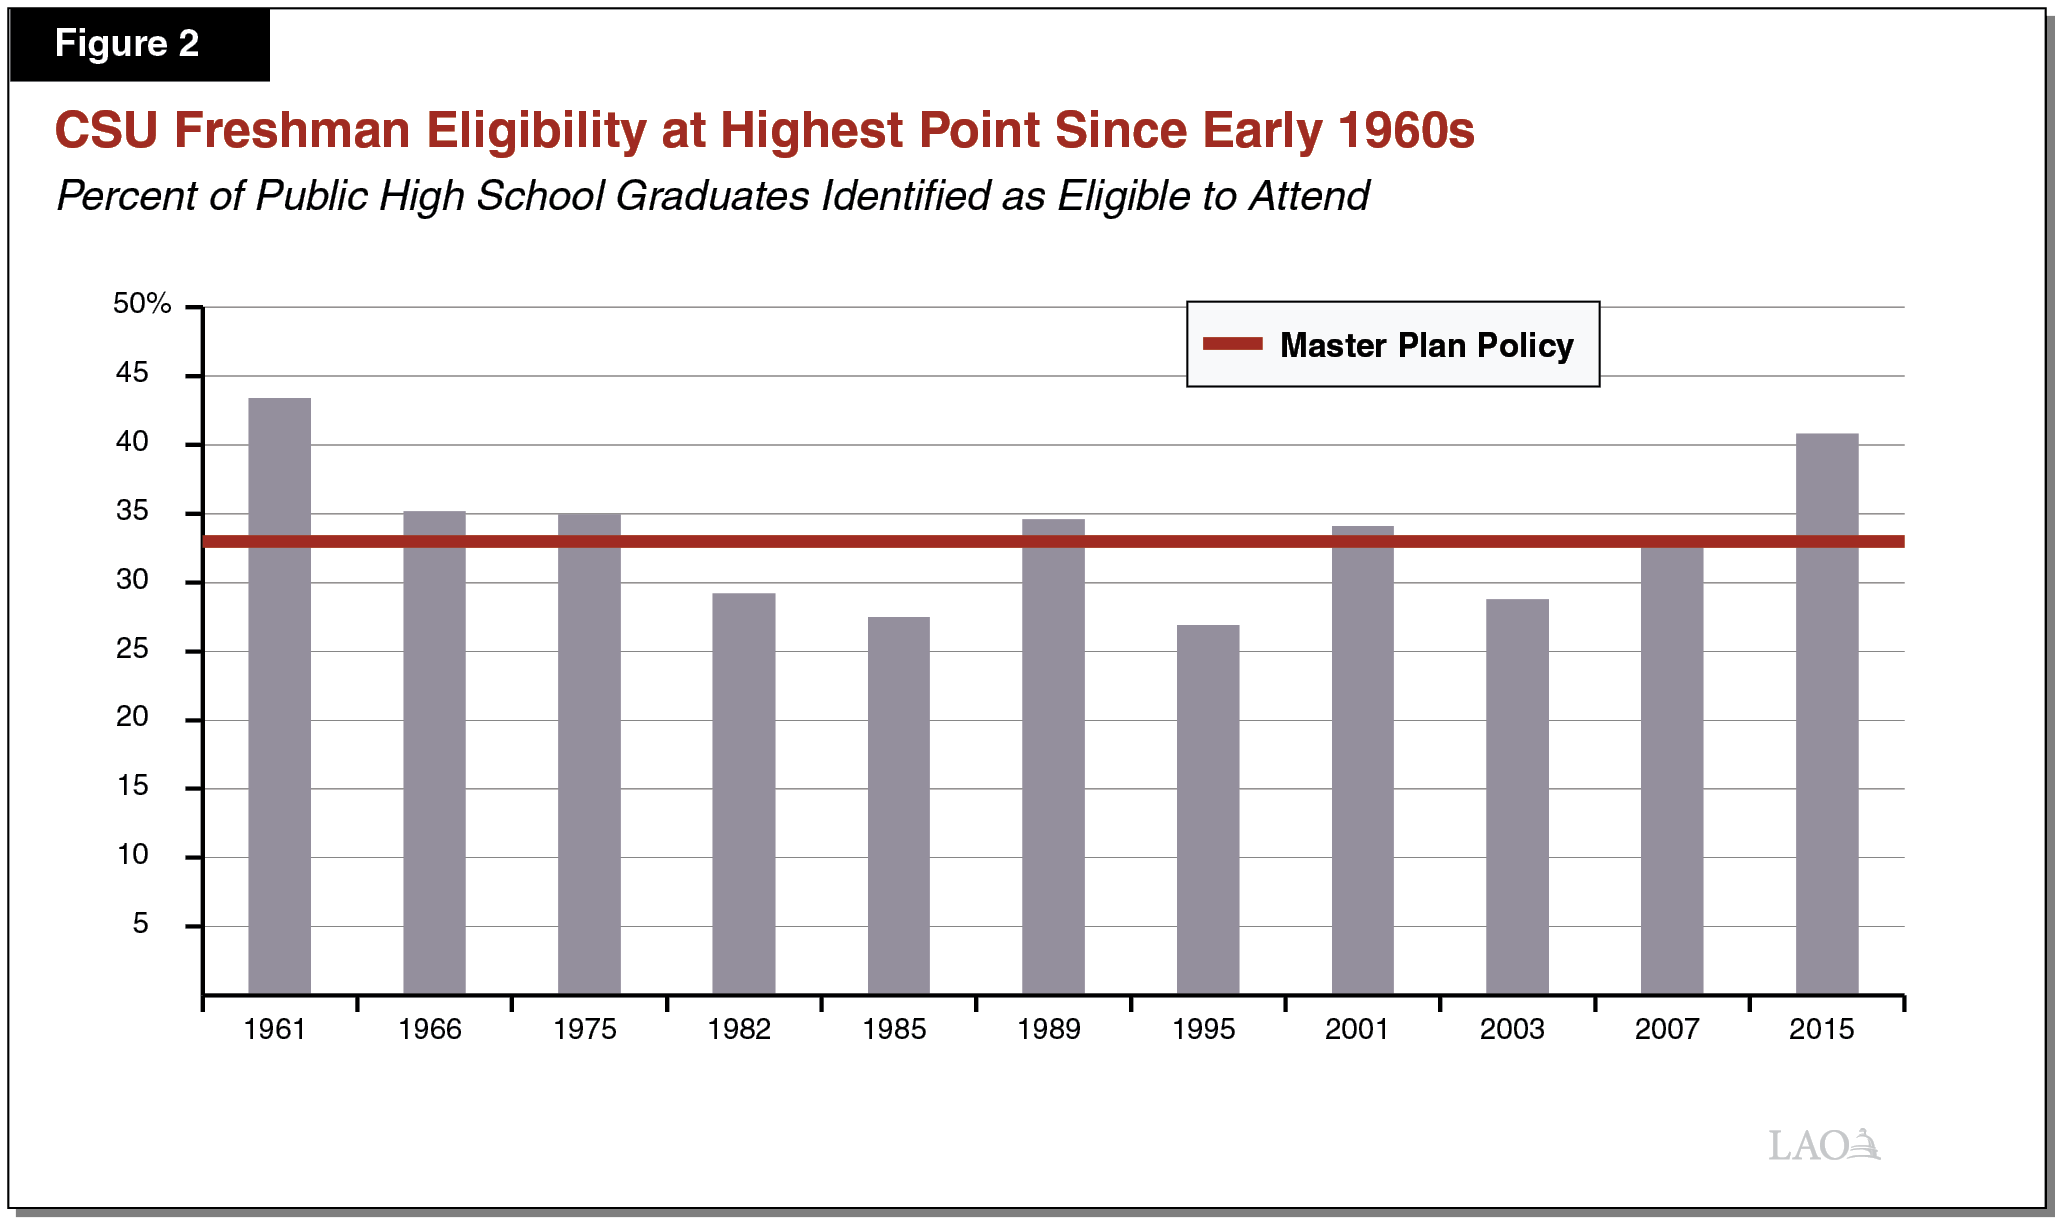
CSU Drawing From Notably Beyond Its Eligibility Pool. The study found that 41 percent of public high school graduates met CSU’s systemwide admission requirements in fall 2015. This proportion is notably higher than CSU’s expected eligibility pool of 33 percent. It also is the highest proportion of graduates CSU has drawn from since the 1960s (see Figure 2). Because CSU admission requirements have not changed since the last eligibility study in 2007, the increase since then is likely due to the greater share of high school graduates completing the A‑G series.
UC Might Be Drawing From Beyond Its Pool. For UC, the study found that 13.9 percent of public high school graduates met the university system’s admission requirements in 2015, with 11.2 percent of graduates eligible through the statewide or local criteria and an additional 2.7 percent of graduates admitted to UC under comprehensive review. While above UC’s expected 12.5 percent eligibility pool under the Master Plan, two factors complicate the study’s results. One is that UC’s results have a margin of error of 1.6 percentage points, creating a possible range between 12.3 percent to 15.5 percent. The other is that the eligibility study did not examine where students admitted under comprehensive review ranked statewide or locally, such that the state no longer knows the entire pool of students from which UC is drawing. Moreover, UC has increased the proportion of high school graduates admitted under comprehensive review. In fall 2016, UC admitted 4 percent of high school graduates under the comprehensive review policy.
Eligibility Increased for Students in Most Major Race and Ethnicity Groups. Figure 3 shows that eligibility rates are markedly higher for Asian students than other student groups. Eligibility rates for white students are somewhat higher than rates for Latino and black students. Since the last eligibility study in 2007, nearly all student groups have experienced increases in their eligibility rates. The eligibility rate for white students at UC, however, declined.
Figure 3
Eligibility Increased for Most Student Groups
Percent of High School Graduates Meeting Admission Requirements By Race and Ethnicity
|
2007 |
2015 |
Change From 2007 |
|
|
California State University |
|||
|
Asian |
50.9% |
64.0% |
13.1% |
|
White |
37.1 |
39.8 |
2.7 |
|
Latino |
22.5 |
31.9 |
9.4 |
|
Black |
24.0 |
30.0 |
6.0 |
|
All graduates |
32.7 |
40.8 |
8.1 |
|
University of California |
|||
|
Asian |
29.4% |
30.7% |
1.3% |
|
White |
14.6 |
11.9 |
‑2.7 |
|
Latino |
6.9 |
8.5 |
1.6 |
|
Black |
6.3 |
6.5 |
0.2 |
|
All graduates |
13.4 |
13.9 |
0.5 |
Issues for Consideration
Recent State Interest in Re‑examining Policies. Even prior to the findings of the recent eligibility study, the Legislature had expressed interest in reviewing the Master Plan eligibility policies. As part of the 2016‑17 budget, the state required all three segments to report on what would be entailed in notably increasing their production of certificate and degree holders by 2030. In its plan, UC estimated it would have to draw from around 17 percent to 20 percent of high school graduates to grow bachelor’s degrees to the desired level. CSU did not propose changes to its existing admission policies. Instead, it noted that many students who are not admitted to CSU as freshmen would eventually work their way to the university system through transfer from CCC. In addition to these reports, two state reviews of the 1960 Master Plan are currently underway: (1) a study of Master Plan polices and state workforce needs from OPR (due February 2018); and (2) a review by the Assembly Select Committee on the Master Plan for Higher Education in California, which held hearings in 2017 and plans to hold further hearings throughout 2018.
Key Trade‑Offs to Consider in Expanding Freshman Eligibility. In revisiting the state’s eligibility policies, one policy option would be to allow CSU and UC to continue drawing from larger eligibility pools than envisioned under the Master Plan. Expanding eligibility would permit more high school graduates to enroll directly at a public university. Advocates for this approach argue that the increase in A‑G completion rates indicates more students are better prepared for college‑level study and desire to attend CSU and UC as freshmen. Not every student who meets existing admission standards, however, is deemed ready for college‑level work, with remedial rates at CSU still notable—32 percent in fall 2017. (This proportion could drop in the coming years due to changes CSU is making both to how it assesses students’ college readiness and how it places students into first‑year courses.) The public universities also have higher instructional and capital costs than CCC. Moreover, the Legislature faces existing cost pressures in higher education, such as rising salary and benefit costs at each segment.
Key Trade‑Offs to Consider in Retaining Master Plan Eligibility Pools. In revisiting freshman eligibility pools, another policy option is to adhere to the Master Plan eligibility pools. This would mean CSU and UC would need to adopt stricter admissions requirements. This option would reduce enrollment pressures on CSU and UC, which would have the advantage of freeing up General Fund support for other cost pressures. As a result of tightening eligibility criteria, more students likely would be diverted to CCC, which has been experiencing declining enrollment in recent years. It also likely would increase the level of academic preparedness of entering freshman classes at CSU. Because this option would tighten admission requirements, however, many students may feel frustrated that they completed A‑G coursework but did not get admitted directly as freshmen to a public university.
Enrollment
Below, we discuss college‑related demographic trends, enrollment trends, and enrollment funding.
Demographic Trends
In 2016‑17, 422,000 Students in California Graduated From a Public High School. Enrollment demand for the three public segments is driven in part by changes in the number of high school graduates. Assuming no other changes, an increase in the number of California high school graduates causes a proportionate increase in college enrollment demand. More high school graduates can affect freshman enrollment immediately for all the segments. Increases in high school graduates also can have a future effect on transfer enrollment, as some entering community college students will work their way through the transfer process over the course of subsequent years.
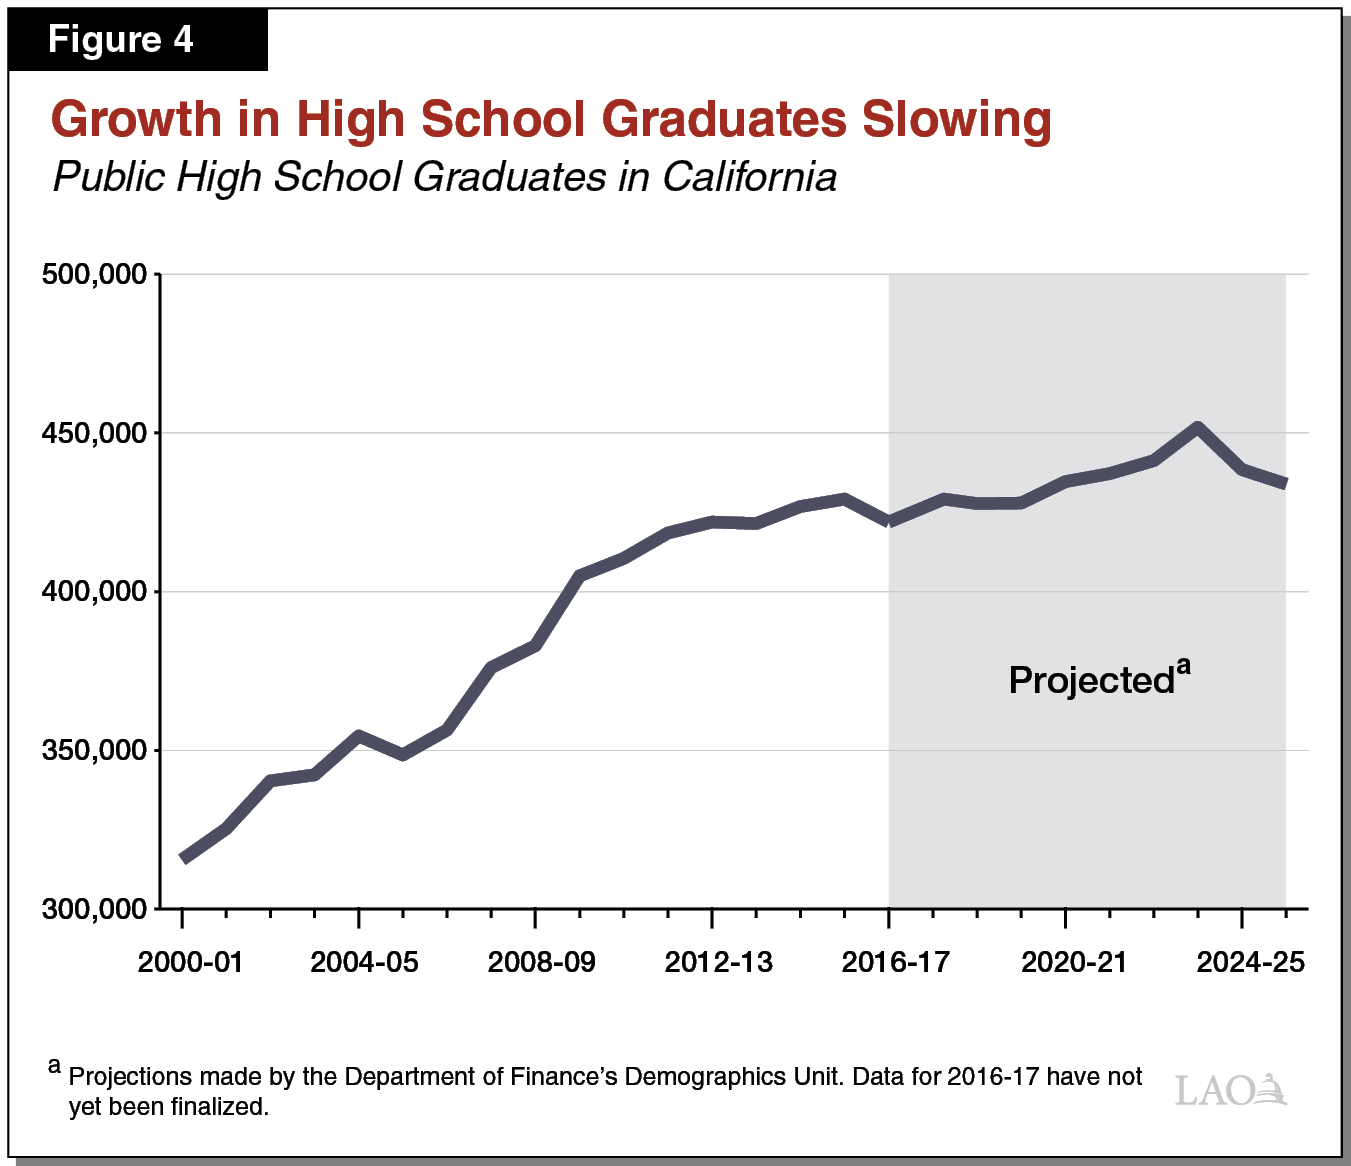
Growth in High School Graduates Is Slowing. As Figure 4 shows, the number of high school graduates grew somewhat quickly from 2000‑01 through 2009‑10, with average annual growth over this period of 2.8 period. Since 2009‑10, growth has slowed considerably. Between 2009‑10 and 2016‑17, average annual growth was 0.6 percent. The state is expected to continue seeing slow growth in high school graduates throughout the next several years. The Department of Finance projects 0.3 percent average annual growth between 2016‑17 and 2025‑26.
Share of Californians Attending College Is Growing. In 2015, 47 percent of Californians between the age of 18 and 24 (the traditional college‑going age) reported attending college. This share has steadily increased since 2000. In that year, 35 percent of 18‑24 years olds in California reported attending college. In 2015, the rate for all 18‑24 year olds in the nation was 43 percent, with California’s rate ranking 9th highest among all states.
Enrollment Trends
California Has Larger Public Sector Compared to Rest of Nation. About three‑fourths of full‑time equivalent (FTE) enrollment in California is in the public higher education sector. The share in the public sector is somewhat higher in California than the rest of the nation (two‑thirds of FTE enrollment). California’s share of students in nonprofit colleges is lower than the rest of the nation (13 percent compared to 23 percent). The for‑profit sector enrolls similar shares of students in California and the rest of the nation (12 percent and 11 percent, respectively).
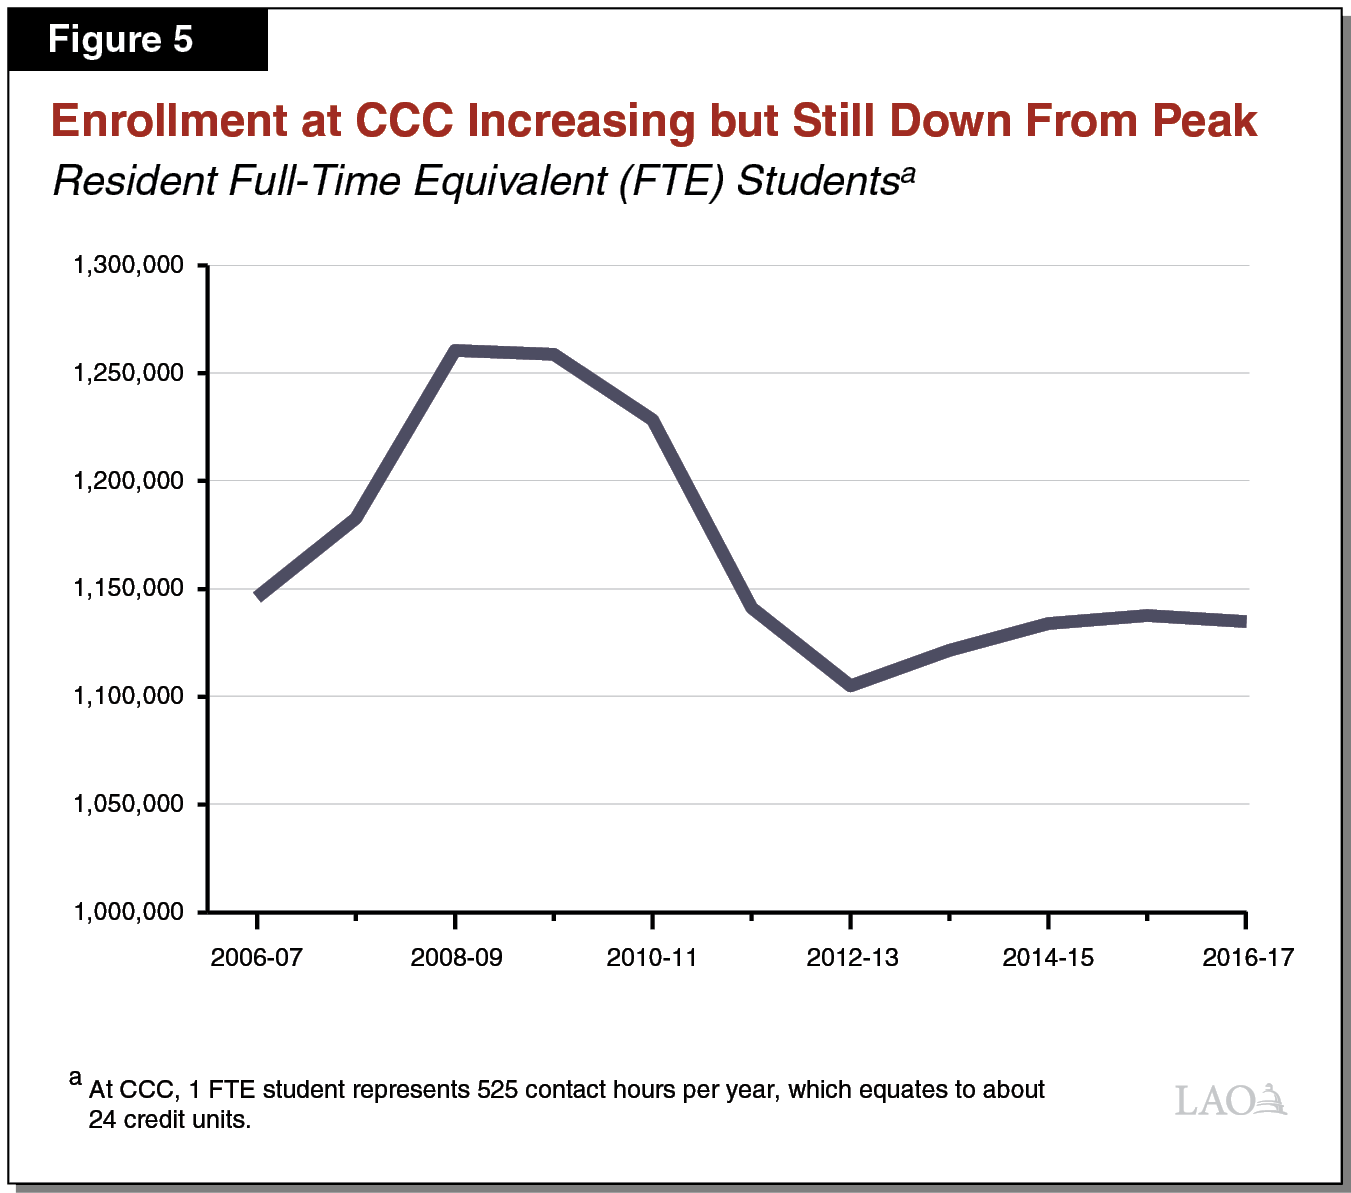
CCC Educates More Than 1 Million Resident FTE Students. CCC enrolls 62 percent of public sector undergraduate FTE students in California. This is higher than public sector enrollment in two‑year institutions in the rest of the nation (43 percent). California’s relatively larger community college system reflects the state’s eligibility policy, which encourages lower‑division enrollment at CCC. In 2016‑17, CCC educated 1.1 million FTE students (see Figure 5). This enrollment level is (0.7 percent) lower than the level in 2006‑07 and (10.7 percent) lower than the peak of CCC enrollment, which occurred in 2008‑09 (reaching almost 1.3 million FTE students). The decline in enrollment during the recession largely reflected reductions in state funding rather than declining enrollment demand. Enrollment demand is often highest at CCC during recessions as unemployment rates rise. California’s unemployment rate has been declining throughout the most recent economic expansion, likely a key reason why growth in CCC enrollment has been relatively slow in recent years. Largely due to its stronger link to the economic cycle, CCC enrollment is the most volatile among the three segments.
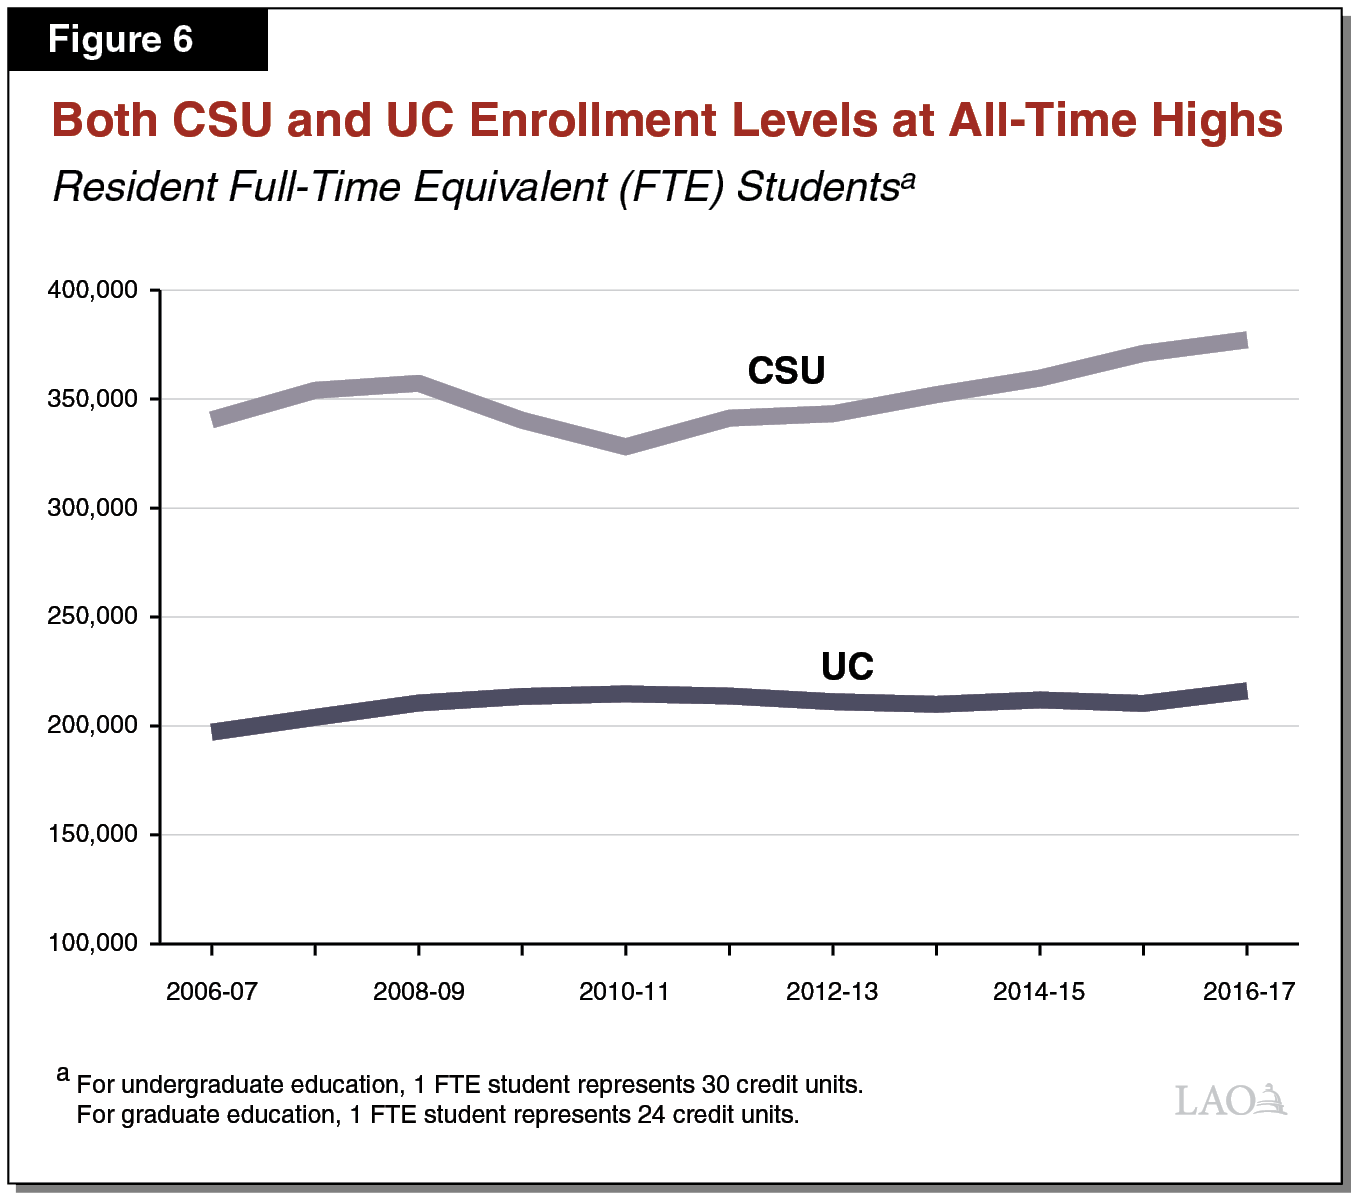
CSU and UC Resident Enrollment at All‑Time Highs. In 2016‑17, CSU educated 377,300 resident FTE students and UC educated 216,200 resident FTE students (see Figure 6). The 2016‑17 enrollment levels are 11 percent higher at CSU and 10 percent higher at UC compared to their respective levels in 2006‑07. Though resident enrollment at the universities is less volatile than at CCC, both CSU and UC experienced some enrollment decline during the past recession.
Nonresident Enrollment Remains Low at CCC and CSU but Has Grown Notably at UC. The proportion of nonresident students at CCC over the past ten years has been stable at 4 percent of total enrollment. At CSU, the share of nonresident students has grown only slightly—from 4 percent in 2005‑06 to 6 percent 2016‑17. Prior to the most recent recession, nonresident enrollment also was a small portion of enrollment at UC, comprising around 8 percent of all students. Nonresident enrollment at UC has grown notably since the start of the last recession, with the share in 2016‑17 reaching 17 percent. The share of nonresidents has grown especially quickly for undergraduate enrollment—from 4 percent in 2008‑09 to 15 percent in 2016‑17, increasing by 26,000 FTE students (148 percent) over the period.
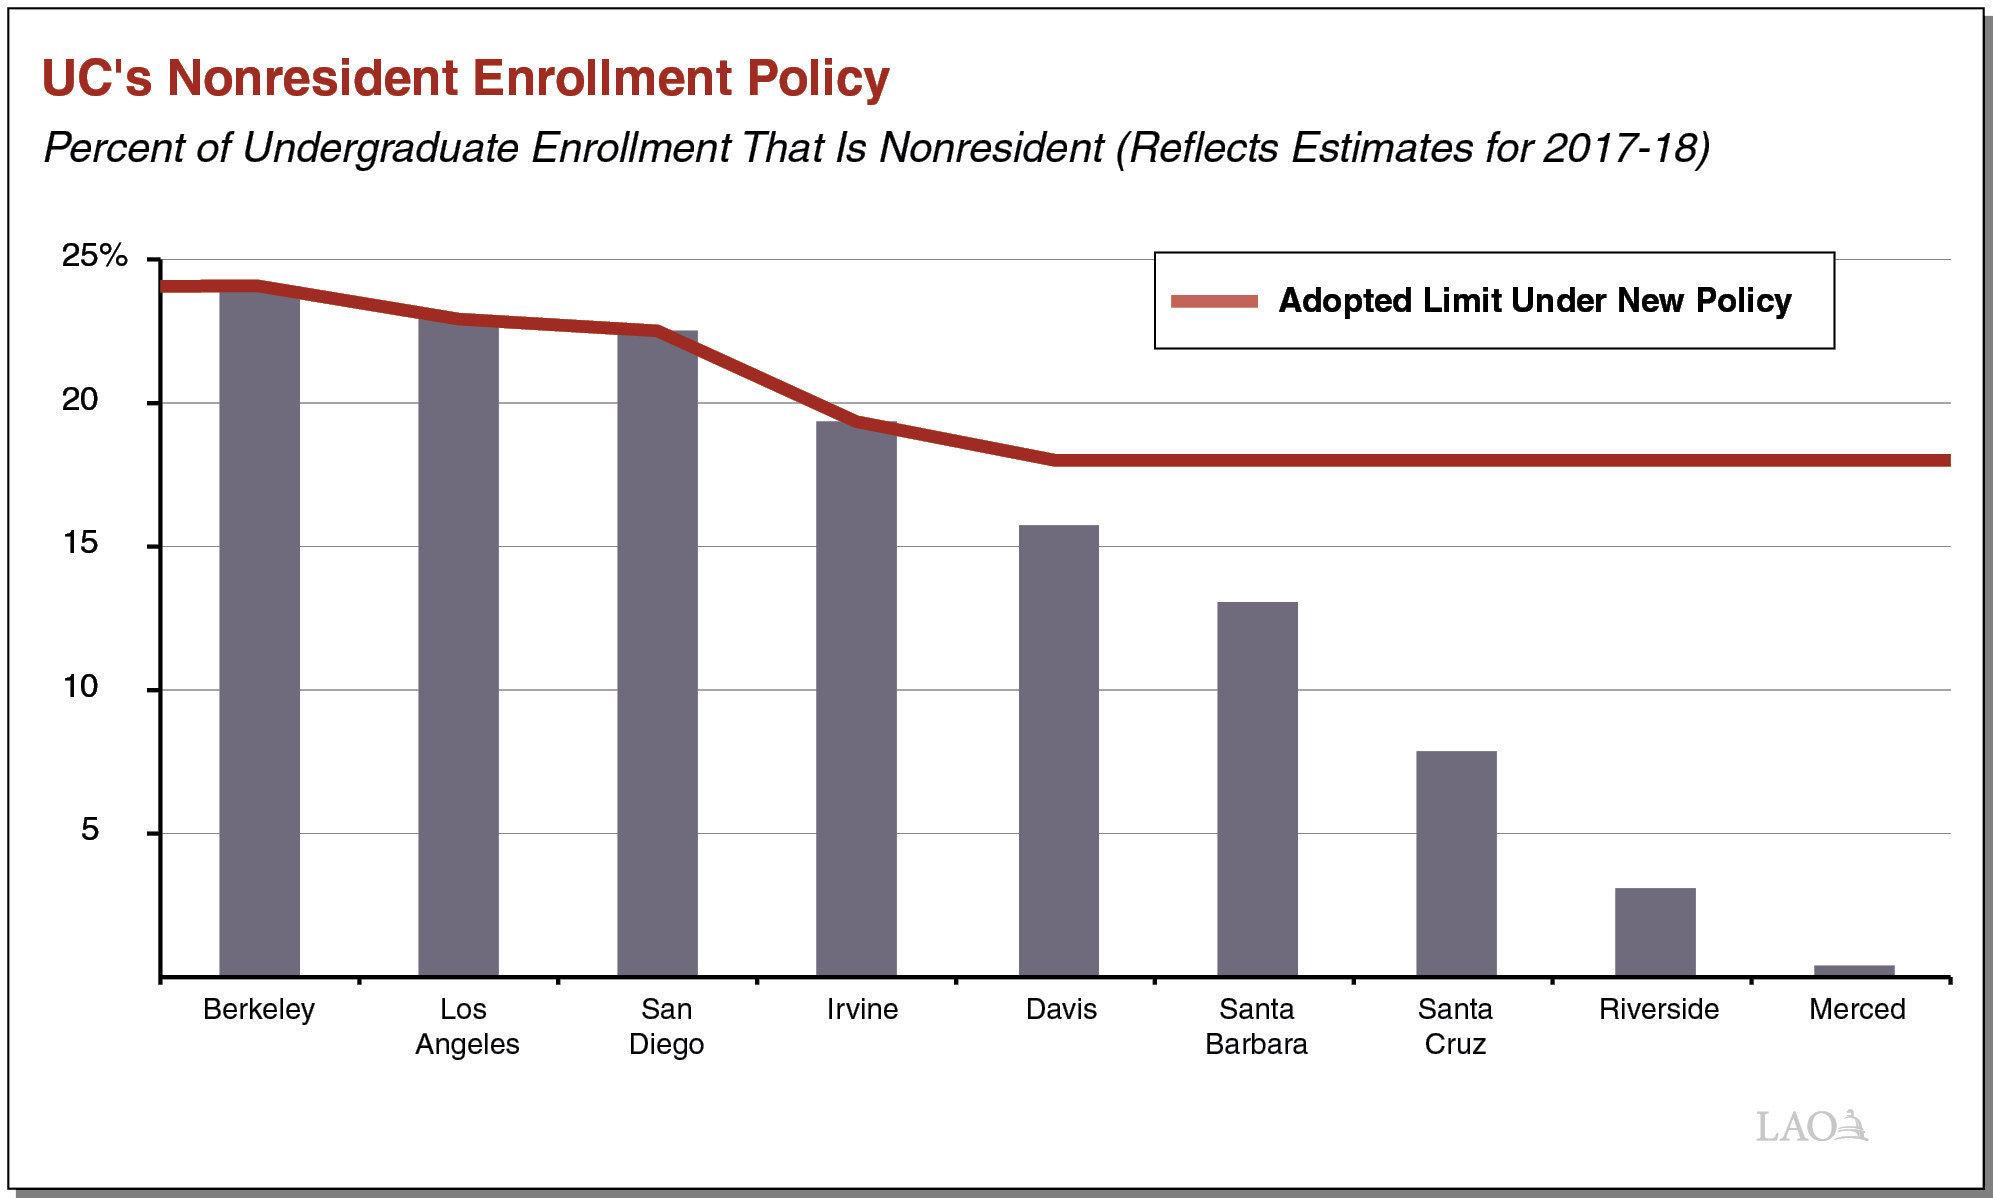
Growth in Nonresidents at UC Leads to New UC Enrollment Policy. In response to concerns that the increase in nonresident enrollment was limiting space for eligible resident students, the state recently directed UC to adopt a policy to limit nonresident enrollment. UC adopted such a policy earlier this year, which we describe in the nearby box. In contrast to UC, no formal policy limits nonresident enrollment at CCC and CSU.
UC’s Nonresident Enrollment Policy
The 2016‑17 budget included provisional language requiring UC to adopt a policy limiting nonresident enrollment as a condition of receiving enrollment growth funding that year. In May 2017, the UC Regents finalized the new policy. The policy sets an 18 percent cap (or target) for nonresident undergraduate enrollment at five campuses and sets higher campus‑specific caps for the remaining four campuses (see the figure below). At these campuses, the caps are linked to their 2017‑18 nonresident enrollment shares. Effectively, the new policy gives five campuses an opportunity to increase their shares of nonresident enrollment, while limiting further growth in nonresident enrollment at the four campuses with the highest existing shares.
Graduate Students Account for About 1 in 5 Students at UC and 1 in 10 Students at CSU. In 2016‑17, UC enrolled 50,600 graduate students (19 percent of its total enrollment) and CSU enrolled 40,700 graduate students (10 percent of its total enrollment). These shares are somewhat lower than the shares 15 years ago. In 2000‑01, graduate students comprised 23 percent of total enrollment at UC and 17 percent at CSU. Among UC graduate students today, about 50 percent are doctoral students, about 40 percent are enrolled in a master’s program, and about 10 percent are enrolled in a graduate professional program (such as medicine, law, and business). At CSU, about 75 percent of graduate students are enrolled in a master’s program and 25 percent are enrolled in a postbaccalaureate program (mostly teacher training programs). Postbaccaularate enrollment in 2016‑17 is less than one‑third of what it was 15 years ago.
Science Majors and Degrees Trending Upward Over Past 15 Years. This upward trend is most notable at UC, where the share of undergraduates enrolled in a science, technology, engineering, or mathematics (STEM) major increased from 30 percent in fall 2000 to 41 percent in fall 2016. While increasing at CSU too, the trend has been more gradual. In fall 2016, 23 percent of undergraduate students enrolled in a STEM major, compared to 20 percent in fall 2000. An even greater share of graduate students are enrolled in a STEM field—about 60 percent of UC doctoral students and about 26 percent of CSU master’s students in fall 2016.
Private Sector Enrollment Below Peak Levels. Private sector enrollment peaked in California in 2010‑11, reaching around 314,000 students in the for‑profit sector and 281,000 students in the nonprofit sector. Since that time, enrollment has declined notably at the for‑profit sector and slightly at the nonprofit sector. In 2014‑15, enrollment in the for‑profit sector was 18 percent lower than its peak, with enrollment in the nonprofit sector down 1.9 percent. Of the two sectors, the for‑profit sector has a larger share of its enrollment in two‑year institutions. Among nonprofit colleges, most enrollment (95 percent) is in four‑year institutions. Both sectors also have notable graduate student enrollment (10 percent of for‑profit enrollment and 36 percent of nonprofit enrollment).
Enrollment Funding
Traditionally, State Sets Enrollment Target for Each Segment. Under the traditional approach to funding enrollment, the state first considers the eligibility, demographic, and enrollment factors discussed earlier and sets a target for each segment. Over the past few decades, the state typically has set one overall enrollment target for each segment rather than separate targets for certain types of students (such undergraduate and graduate students or students in the humanities and sciences). If the state increases a segment’s overall enrollment target, then the state decides how much associated funding to provide.
State Funds CCC Enrollment Growth at Per‑Student Rate. State law requires that the CCC Board of Governor’s annual budget request for enrollment growth be based, at a minimum, on changes in the adult population and excess unemployment (defined as an unemployment rate higher than 5 percent). The Governor and Legislature do not have to approve enrollment growth at the requested level. Their decisions tend to reflect the state’s budget condition. Once the enrollment growth level is set, the state calculates how much funding to provide CCC based on a going per‑student funding rate. That rate ($5,151 in 2017‑18) effectively is based on the average cost of serving an additional CCC student. The CCC distributes enrollment growth funding among districts based upon a set of statutory factors, including each district’s prior‑year enrollment level as well as various socioeconomic factors (such as the local unemployment level). If a district does not meet its target, it retains associated enrollment funding for one year, but then the unearned funding is reverted. A district, however, has up to three years to earn back the funding if it can increase its enrollment. If the overall CCC system does not meet its target, the state immediately repurposes the funds for other college (or school) priorities.
CSU and UC Enrollment Growth Traditionally Funded Based on Marginal Cost Formula. In the case of the universities, the state makes a determination each year on how much enrollment to fund and gives the segments flexibility to set enrollment targets for each campus. When providing funding for enrollment growth, the state for decades used a “marginal cost” formula that estimated the cost of admitting one additional student. The most recently used formula assumed that the universities would hire a new professor (at the average salary of newly hired faculty) for every 19 additional students enrolled. In addition, the formula included the average cost per student for faculty benefits, academic and instructional support, student services, instructional equipment, and operations and maintenance of physical infrastructure. The marginal cost formula was based on the cost of all enrollment (undergraduate and graduate students and all academic disciplines excluding health sciences). After calculating the total marginal cost per student, state and student shares were calculated. In 2017‑18, CSU estimated its total marginal cost per student was $10,649, with a state share of $8,041. UC estimated its total marginal cost per student was $18,146, with a state share of $10,097. If the segments did not meet the enrollment target specified in the budget within a certain margin, then historically an equivalent portion of the associated enrollment growth funding was reverted.
Funding Enrollment Growth at CSU and UC Has Become Less Transparent Over Past Several Years. Though the state traditionally has set enrollment targets and used the marginal cost funding formula to determine how much associated enrollment growth funding to provide CSU and UC, it has not regularly used this process since 2008. The state began omitting enrollment targets in the 2008‑09 budget, when it entered the last recession and reduced base funding for CSU and UC. The purpose was to provide CSU and UC flexibility to manage state funding reductions. Though the state resumed some of its enrollment budgeting practices since that time, it has not consistently set enrollment targets and used the marginal cost formula to determine associated state funding.
New Budgetary Rules Emerging for UC. In recent years, the state has approached UC enrollment targets and funding in a few new ways:
- Setting Out‑Year Targets. In order to give UC more time to respond to legislative direction, the 2015‑16 budget set enrollment goals for UC for the 2016‑17 academic year, one year after the budget year. The state has since continued this practice. For example, the 2017‑18 budget set enrollment targets for the 2018‑19 academic year.
- Expecting UC to Cover Some of the Associated Cost From New Sources. In 2015‑16 and 2016‑17, the state budget provided UC with less enrollment growth funding than what would have been generated under the traditional marginal cost formula. The 2017‑18 budget did not provide any new funding for enrollment growth. The change in funding practices were made with the expectation that UC find funding through alternative sources and redirected savings from certain cost reductions.
- Making Funding Conditional. In years where funding was provided for enrollment growth (the 2015‑16 and 2016‑17 budgets), the state budget required UC to demonstrate to the Department of Finance that it was on track to meet its enrollment target by May of the following year. If UC was on track, it received its enrollment funding. In both years, UC ultimately received funding.
Core Funding Per Student Increasing in Recent Years. As Figure 7 shows, total core funding per student is highest at UC ($30,975), lower at CSU ($15,457), and lowest at CCC ($10,014). CCC’s inflation‑adjusted per‑student amount is down slightly from the system’s peak level, reached in 2015‑16 ($10,125). At the universities, inflation‑adjusted per‑student funding has been increasing in recent years but remains below peak levels (of $39,299 at UC in 2000‑01 and $17,205 at CSU in 1998‑99). Since 1990‑91, state and local funds have comprised around 95 percent of core funds at CCC. At the universities the share of state funding has declined, from around 80 percent in 2000‑01 at both segments to around 60 percent at CSU and 50 percent at UC in recent years.

Affordability
Below, we provide information about student tuition, living expenses, and financial aid.
Tuition
State Currently Does Not Have a Tuition Policy. A tuition policy establishes how tuition levels are to be adjusted over time. Depending on the policy, the tuition charge either explicitly or implicitly represents the share of education costs to be borne by full fee‑paying students and the state. The state share of education costs consists of the subsidy it provides directly to each of the higher education segments as well as the financial aid it provides to students for covering tuition. Though California had a tuition policy for several years during the late 1980s and early 1990s, it has not had a tuition policy the last few decades.
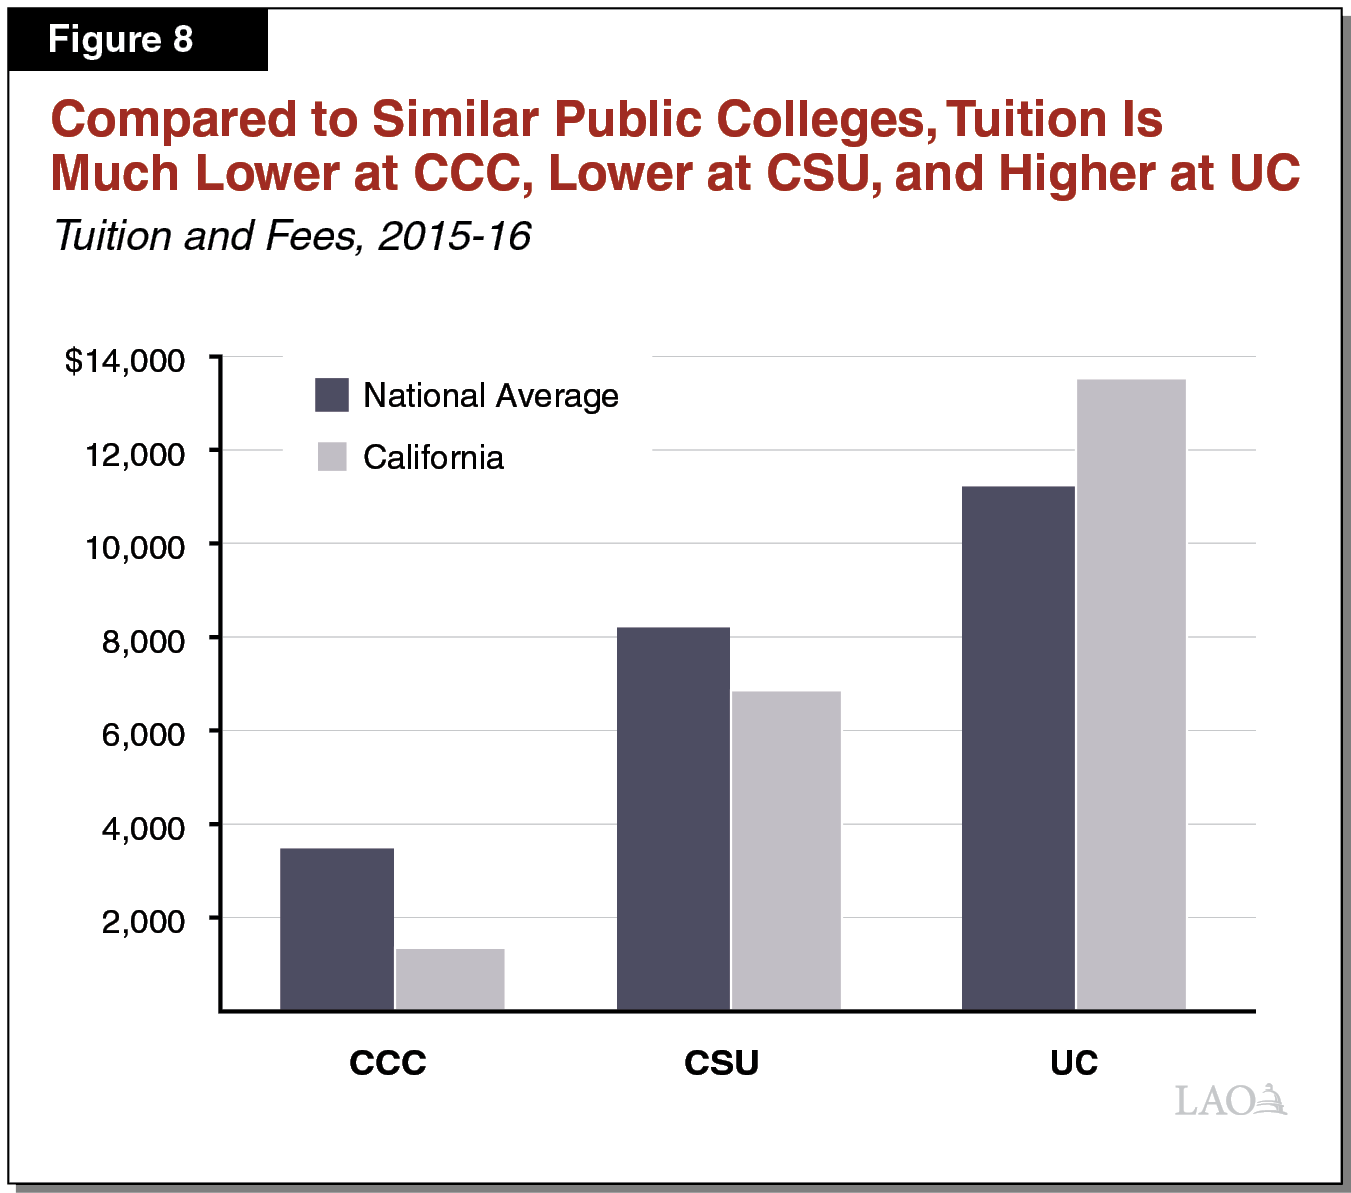
Tuition at Public Institutions Is Lower in California Than Other States. For full‑time undergraduate students, UC currently charges $12,630, CSU charges $5,742, and CCC charges $1,380 ($46 per unit for 30 units). Campuses in each system also charge fees for specific services, such as student health services. Compared to the average fee level of similar public universities in other states, UC’s tuition and fees tend to be notably higher, whereas CSU’s tend to be notably lower (see Figure 8). CCC tuition and fees are the lowest in the country compared to other public community colleges—about one‑third of the national average.
Large Share of Education Funding Comes From the State. At UC, we estimate that the state provides 62 percent of all core education funding, with tuition revenue from resident students comprising 17 percent, and other fund sources (primarily nonresident tuition revenue and endowment income) covering 21 percent. At CSU, we estimate that the state provides 68 percent of all core education funding, with resident tuition revenue comprising 26 percent, and nonresident tuition revenue covering 6 percent. At CCC, we estimate state and local revenue comprises 95 percent of core funding, with student fee revenue covering 5 percent. (These aggregate shares are not a meaningful indicator of the share covered by any particular student. A financially needy student, for example, pays no tuition at any of the public segments.)
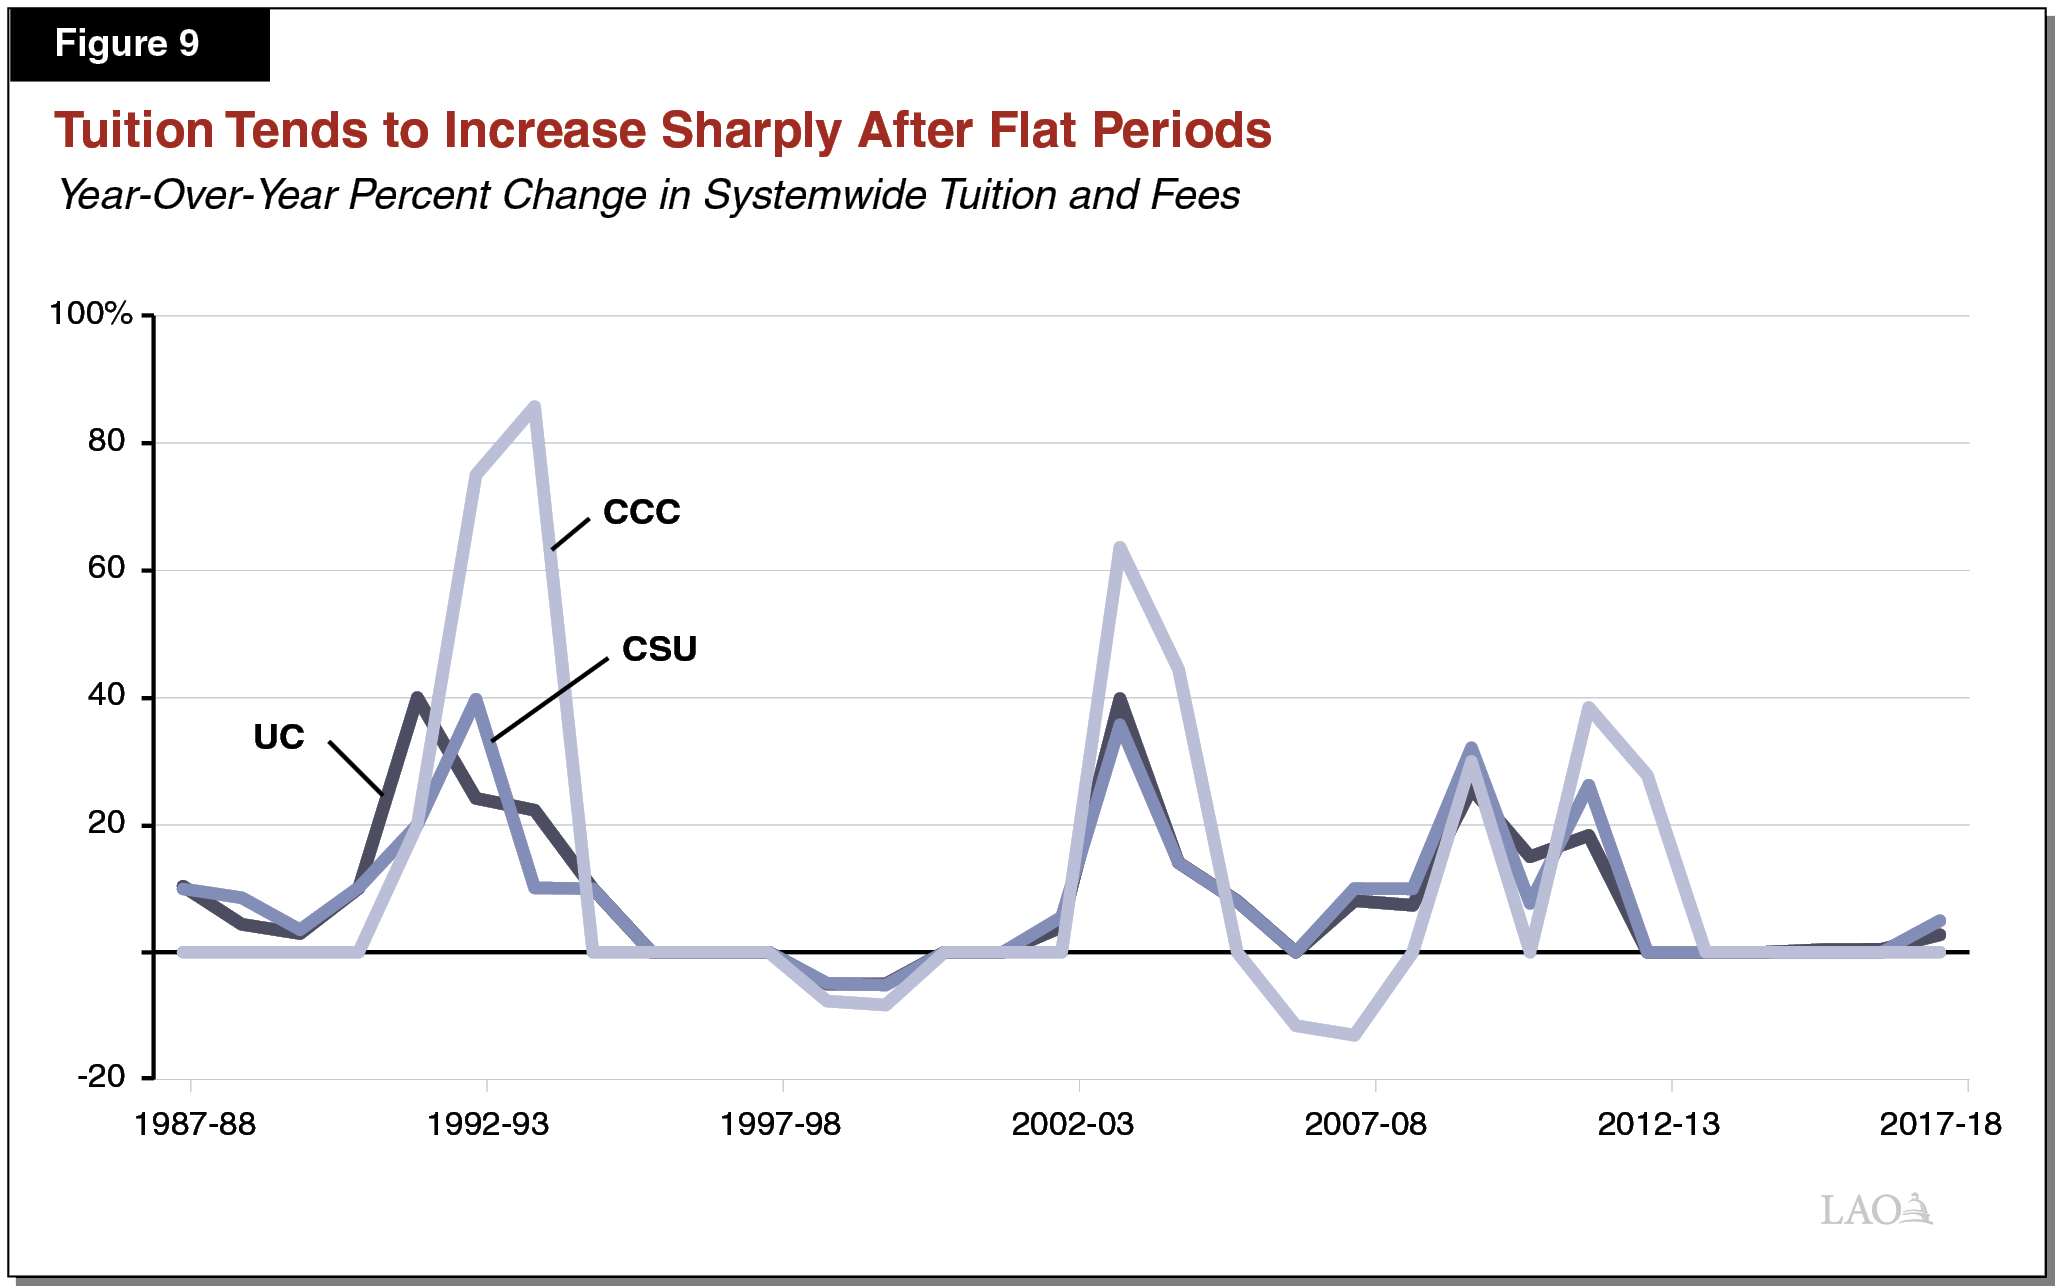
Tuition and Fees Tend to Be Volatile. Though the state provides a large share of core education funding, the state contribution varies over time, tending to increase during economic expansions and retract during recessions. Tuition and fee levels in California tend to be affected by such fluctuations. As Figure 9 shows, tuition and fee levels have had long flat periods generally corresponding to years of economic growth and increasing state contributions. These periods tend to be followed by steep increases generally corresponding to economic slowdowns or recessions, when state contributions tend to fall. Somewhat exceptional to these overall trends, in 2017‑18—a time of continued economic growth—UC increased its tuition and fees by about 3 percent and CSU increased its tuition and fees by about 5 percent. These increases came after six years of flat tuition charges at the two segments.
Living Expenses
Total Cost of Attendance Includes Both Tuition and Living Expenses. Apart from tuition (that is, direct education costs), students incur other costs to attend college, including housing, food, books and supplies, transportation, and personal expenses.
Estimated Living Expenses Vary Based on Several Factors. Each segment has its own method for estimating students’ living costs. Within each segment, costs vary across campuses, as some expenses (such as housing) vary across the state. Living costs also vary depending on whether a student lives on campus, off campus not with family, or off campus with family. Figure 10 shows how average living expenses at UC vary by living arrangement. The UC system estimates students living with family face by far the lowest costs—about 30 percent lower than other students living off campus and almost 50 percent lower than students living on campus.
Figure 10
Estimated Living Expenses Vary by Student Living Arrangement
University of California, 2016‑17a
|
On Campus |
Off Campus |
Off Campus With Family |
|
|
Rent and food |
$14,520 |
$9,769 |
$4,861 |
|
Health careb |
2,312 |
2,316 |
1,946 |
|
Transportation |
699 |
1,273 |
1,686 |
|
Otherc |
1,732 |
1,916 |
2,068 |
|
Totals |
$19,263 |
$15,274 |
$10,561 |
|
aReflects average costs across the system’s ten general campuses. bPrimarily reflects health insurance costs. Students insured through family are not required to purchase insurance. cIncludes expenses for clothing, entertainment, and recreation. |
|||
Living Expenses Higher in California Than in Other States. Compared to similar public universities in other states, living expenses for students attending CCC, CSU, and UC tend to be higher. Specifically, for students living off campus not with family, living expenses are on average about 20 percent higher in California. For students living on campus, costs are on average about 30 percent higher in California.
Financial Aid
Various Types of Financial Aid Help Students. Figure 11 shows the main financial aid programs available to undergraduates attending one of California’s public higher education segments. The aid comes from many sources—the federal government, state government, colleges, and private entities, such as philanthropic groups. Financial aid includes gift aid (grants, scholarships, and tuition waivers that students do not have to pay back); loans (that students must repay); federal tax benefits (that can reduce income tax payments or provide a tax refund); and subsidized work‑study programs (that make it more attractive for employers to hire students). Financial aid may be need based (for students who otherwise might be unable to afford college) or nonneed based (typically scholarships based on academic merit, athletic talent, or military service).
Figure 11
Majority of Financial Aid Programs for California Students Are Gift Aid
(In Millions)
|
Programa |
Coverage |
Expendituresb |
|
Gift Aid |
||
|
Pell Grant (federal) |
Some tuition and living expenses. |
$2,832 |
|
Cal Grant (state) |
Full tuition and some living expenses for students attending public and some private institutions in California. |
1,986 |
|
California College Promise Grantc (state) |
Full tuition for CCC students. |
758 |
|
UC Grant (state) |
Full tuition and living expenses for UC students. |
746 |
|
CSU State University Grant (state) |
Full tuition for CSU students. |
586 |
|
Middle Class Scholarship (state) |
Partial tuition for UC and CSU students not eligible for a Cal Grant. |
71 |
|
Supplement Education Opportunity Grant (federal) |
Some tuition and living expenses. |
65 |
|
CCC Full‑Time Student Success Grant (state) |
Some tuition and living expenses for full‑time CCC students. |
41 |
|
Subtotal |
($7,085) |
|
|
Loans |
||
|
Direct Student Loans (federal) |
Any college expense. More generous terms for financially needy students. |
$1,610 |
|
Parent PLUS Loans (federal) |
Any college expense. Available for parents of dependent students. |
402 |
|
Perkins Student Loans (federal) |
Any college expense. Typically more generous terms than other loans. |
47 |
|
Subtotal |
($2,059) |
|
|
Tax Benefitsd |
||
|
Higher education credits and deductions (federal) |
Tuition, books, and supplies. |
$1,210 |
|
Scholarshare savings plan (federal) |
Any college expense. Accounts have tax benefits. |
209 |
|
Coverdell education savings account (federal) |
Any K‑12 or college expense. Accounts have tax benefits. |
4 |
|
Subtotal |
($1,418) |
|
|
Work Study (Federal/State) |
Provides part‑time jobs. |
$74 |
|
Total |
$10,637 |
|
|
a All gift aid, work study, and Perkins Student Loans are need based. Other loans and tax credits are nonneed based. b Reflects 2015‑16 data for federal programs and 2016‑17 data for state programs. c Formerly known as the CCC Board of Governor’s Fee Waiver. d Estimated based on nationwide expenditures. |
||
Federal Formula Determines a Student’s Financial Need. Need‑based aid programs assess financial need using the federal Free Application for Federal Student Aid, or FAFSA. The FAFSA asks students/families to provide various information, such as household income, certain available assets, and number of children in college. This information then feeds into a formula that determines an expected family contribution (EFC) toward college costs. A student’s financial need is the total cost of attendance (tuition and living costs combined) at a particular campus less his or her EFC.
Many Financial Aid Programs Available to California Students. Most programs are need based and most provide gift aid. If a student qualifies for more than one program, then campus financial aid offices “package” together aid for the student. When packaging aid, campuses first prioritize awarding gift aid before moving on to awarding loans and work study. Campuses do not award tax benefits. Students and parents claim these benefits on their tax returns.
Half of Public College Students Receive Full Tuition Coverage, Some Receive Aid for Living Expenses. Most state aid programs are geared toward providing full tuition coverage for financially needy students. These programs collectively cover full tuition for around 60 percent of undergraduate students at UC and CSU. At CCC, about half of students receive full fee waivers, paying for two‑thirds of all course units taken. In addition, the federal Pell Grant program and some state programs pay for some or all of financially needy students’ living expenses. Taken altogether, gift aid for financially needy students cuts their total college costs (tuition and living expenses) in half at the universities. For full‑time students attending CCC, gift aid covers a somewhat lower portion of the total cost of attendance—about one‑third.
Lower‑Income Families Have Lower Net Price of College. Average net price is the cost of attendance after gift aid. Figure 12 shows average net price for families at various income levels. Students/families with higher‑income levels pay more toward the cost of college than lower‑income students/families.
Figure 12
Net Price Lowest for Lowest‑Income Studentsa
(2015‑16)
|
Family Income Level |
Percent of Students |
Net Price |
|
University of California |
||
|
$0 ‑ 30,000 |
36% |
$9,266 |
|
$30,001 ‑ 48,000 |
20 |
10,287 |
|
$48,001 ‑ 75,000 |
18 |
13,580 |
|
$75,001 ‑ 110,000 |
11 |
20,627 |
|
Over $110,000 |
14 |
29,290 |
|
California State University |
||
|
$0 ‑ 30,000 |
41% |
$6,851 |
|
$30,001 ‑ 48,000 |
21 |
8,244 |
|
$48,001 ‑ 75,000 |
17 |
12,099 |
|
$75,001 ‑ 110,000 |
10 |
16,607 |
|
Over $110,000 |
12 |
18,815 |
|
California Community Colleges |
||
|
$0 ‑ 30,000 |
67% |
$5,927 |
|
$30,001 ‑ 48,000 |
20 |
6,532 |
|
$48,001 ‑ 75,000 |
11 |
8,757 |
|
$75,001 ‑ 110,000 |
1 |
10,113 |
|
Over $110,000 |
—b |
12,193 |
|
aReflects average total cost of attendance less financial aid for full‑time resident undergraduates. Excludes students who did not apply for or receive federal student loans, grants, or work study. bLess than 1 percent. |
||
Student Loan Debt Relatively Low. Each year, around 40 percent of UC and CSU undergraduates take out loans, with an average annual loan amount of $5,400 per borrower. Slightly more than half of UC and CSU students have loan debt at graduation, with debt at graduation averaging $20,500. At CCC, 2 percent of students borrow each year, with an average annual loan amount of $4,500. Student borrowing in California tends to be lower than in other states. For example, about 60 percent of students at four‑year public universities nationally graduate with loan debt, with an average debt load upon graduation of $27,300. (These figures only include student loans, not other forms of debt, such as credit card debt.)
Student Loan Default Rates Low at UC and CSU, Higher at CCC. Almost all borrowing at UC, CSU, and CCC is through federal loans. For each cohort of undergraduate borrowers entering repayment, the federal government tracks the share defaulting within three years. Three‑year student loan default rates tend to be low at UC and CSU but higher at CCC. Specifically, while no UC campus has a rate greater than 3.6 percent and no CSU campus has a rate greater than 6.7 percent, the vast majority of CCC campuses have rates in excess of 10 percent. The average rate for all institutions nationally is 11.3 percent. On average, older students and students who do not complete their degrees are significantly more likely to default.
University of California
In this section, we provide an overview of the Governor’s budget proposals for UC and analyze key cost increases facing the university in 2018‑19. At the end of the section, we assess UC’s 2018‑19 capital outlay request.
Overview
Below, we first focus on the 2018‑19 budget plan for UC and then examine whether UC is likely to meet specific 2017‑18 budget conditions.
2018‑19 Budget Plan
UC Estimated to Receive $35.6 Billion From All Sources in 2018‑19. As Figure 13 shows, UC’s total budget would increase by $733 million (2.1 percent) over the 2017‑18 level. One‑quarter of total funding ($8.9 billion) consists of “core funds” (primarily state General Fund and student tuition revenue) that support the university’s undergraduate and graduate educational programs. Core funding would increase by $70 million (0.8 percent). The remainder of UC funding comes primarily from its five medical centers, sales and services (including housing, bookstores, and academic extension), and the federal government (primarily for research and financial aid).
Figure 13
University of California Funding by Source
(Dollars in Millions)
|
2016‑17 Actual |
2017‑18 Revised |
2018‑19 Proposed |
Change From 2017‑18 |
||
|
Amount |
Percent |
||||
|
Core Funds |
|||||
|
General Fund |
|||||
|
Ongoing |
$3,279 |
$3,367 |
$3,469 |
$102 |
3.0% |
|
One time |
262 |
177 |
0 |
‑177 |
‑100.0 |
|
Carryovera |
‑45 |
5 |
39 |
34 |
639.0 |
|
Tuition and feesb |
4,507 |
4,816 |
4,936 |
120 |
2.5 |
|
Lottery |
38 |
42 |
42 |
—c |
‑0.1 |
|
Other core fundsd |
353 |
405 |
395 |
‑10 |
‑2.5 |
|
Totals |
$8,394 |
$8,813 |
$8,882 |
$70 |
0.8% |
|
Other Funds |
|||||
|
Medical centers |
$10,395 |
$11,330 |
$11,670 |
$340 |
3.0% |
|
Sales and services |
6,670 |
7,134 |
7,345 |
211 |
3.0 |
|
Federal |
3,649 |
3,735 |
3,776 |
41 |
1.1 |
|
Private |
2,250 |
2,347 |
2,400 |
53 |
2.3 |
|
State |
342 |
441 |
437 |
‑4 |
‑0.9 |
|
Other |
1,031 |
1,049 |
1,071 |
22 |
2.1 |
|
Totals |
$24,337 |
$26,036 |
$26,699 |
$663 |
2.5% |
|
Grand Totals |
$32,730 |
$34,848 |
$35,581 |
$733 |
2.1% |
|
FTE Studentse |
263,957 |
272,267 |
275,267 |
3,000 |
1.1% |
|
Core Funding Per Student |
$31,800 |
$32,368 |
$32,268 |
‑$100 |
‑0.3% |
|
aOf the $262 million one time provided in 2016‑17, $45 million was unspent. UC plans to spend $5 million of the carryover in 2017‑18 and the remainder in 2018‑19. bIncludes funds that UC uses to provide tuition discounts and waivers to certain students. In 2018‑19, UC plans to provide $1 billion in such aid. cAmount is less than $500,000. dIncludes a portion of overhead funding from federal and state grants, a portion of patent royalty income, and Proposition 56 funding designated for graduate medical education. eOne full‑time equivalent (FTE) represents 30 credit units for an undergraduate and 24 credit units for a graduate student. Student counts includes resident and nonresident students. |
|||||
Governor’s Budget Provides $92 Million General Fund Base Increase. As Figure 14 shows, the main General Fund change to UC in 2018‑19 would be a $92 million ongoing unrestricted base increase. The increase would reflect a 3 percent increase to UC’s ongoing General Fund support to campuses. The Governor’s budget does not include an increase for the Office of the President (UCOP), which the Legislature began line‑item budgeting in 2017‑18. Under the Governor’s budget, UCOP remains funded at $349 million. In addition to the base increase, the Governor (1) provides $10 million ongoing to offset expiring one‑time Proposition 56 monies in the 2017‑18 budget, (2) removes $177 million in one‑time funds (primarily for UC’s Retirement Plan) provided in the 2017‑18 budget, and (3) reappropriates certain unspent one‑time funds provided in the 2016‑17 budget.
Figure 14
University of California General Fund Changes
(In Millions)
|
2017‑18 Revised Funding |
$3,549.4 |
|
Ongoing |
|
|
Provide unrestricted base increase |
$92.1 |
|
Replace one‑time Proposition 56 funds with General Fund |
10.0 |
|
Subtotal |
($102.1) |
|
One Time |
|
|
Spend 2016‑17 carryover |
$34.1 |
|
Remove one‑time funding provided in 2017‑18 |
‑176.6 |
|
Subtotal |
(‑$142.5) |
|
Total |
‑$40.4 |
|
2018‑19 Proposed Funding |
$3,509.0 |
Under Governor’s Budget, Total of $300 Million Available for Ongoing Spending. Beyond the proposed $92 million General Fund base increase, UC plans to tap an additional $208 million. This additional funding would come from various fund sources, redirections, and savings, as described below.
- $120 Million From Tuition and Fees. The increase would result from 1.1 percent enrollment growth ($71 million), a $978 (3.5 percent) increase to nonresident supplemental tuition ($35 million), and a $54 (4.8 percent) increase to the Student Services Fee ($14 million). The Governor assumes resident tuition levels remain flat year over year. Of the increase in gross tuition and fee revenues, we estimate $18.2 million would be redirected for financial aid.
- $88 Million From Anticipated Savings and Alternative Revenue Sources. This amount consists of (1) $30 million in new revenue from increased investment returns, (2) a package of $15 million in identified redirections intended to fund enrollment growth in 2018‑19, (3) $14 million from phasing out financial aid for nonresident students, (4) $10 million in savings from improved procurement practices, (5) $10 million in philanthropic donations, and (6) $9 million in savings from retiring obligations associated with a past lawsuit.
UC Likely to Prioritize Increases for Compensation and Enrollment. Though the UC Regents have not yet adopted a budget plan for 2018‑19, its draft budget prioritizes spending for compensation increases and enrollment growth. As the top part of Figure 15 shows, UC for 2018‑19 is likely to increase faculty and staff compensation by $104 million. It also is budgeting $57 million for planned enrollment growth. Additionally, UC has identified various other high priorities, including student financial aid and mental health services, that total $70 million. After funding all these high priorities, $69 million would remain available for other cost increases.
Figure 15
UC Has More Spending Priorities Than Can Be Covered by $300 Million Assumed in Governor’s Budget
(In Millions)
|
Top Prioritiesa |
|
|
Compensation |
|
|
Benefit cost increases |
$44 |
|
Faculty Merit Program |
32 |
|
Represented staff salary increases (3.6 percent) |
28 |
|
Subtotal |
($104) |
|
Other Cost Increases |
|
|
Operating expenses and equipment (2.5 percent) |
$32 |
|
Financial aid |
18 |
|
Debt service |
15 |
|
Mental health services |
5 |
|
Subtotal |
($70) |
|
Enrollment Growth |
|
|
Resident undergraduate (1,500 students) |
$28 |
|
Nonresident undergraduate (1,000 students) |
19 |
|
Graduate (500 students) |
9 |
|
Subtotal |
($57) |
|
Total Top Priorities |
$231 |
|
Remaining Priorities |
|
|
Funds Availableb |
$69 |
|
Calls on Available Funds |
|
|
Faculty and nonrepresented staff salary increases (3 percent) |
$83 |
|
Academic quality |
50 |
|
Deferred maintenance (one time) |
35 |
|
Financial aid |
27 |
|
Enrollment growth (500 resident undergraduates)c |
9 |
|
aReflects LAO assumptions of UC’s top spending priorities based on UC and state budget documents and conversations with UC staff. bReflects funding implicitly remaining under Governor’s budget. cWere UC to add these additional students, $4 million of this cost would be funded from the tuition revenue those students would pay. |
|
UC Has Many Other Calls on Remaining Funding. The UC Regent’s draft budget plan assumes significantly more funding is available than implicitly recognized in the Governor’s budget. Whereas the Governor’s budget implicitly recognizes the $300 million in new funding, UC’s draft budget assumes $437 million. The largest revenue difference between the two plans is UC’s preliminary budget assumption that it would raise tuition by 2.5 percent. The largest spending difference between the two plans is UC’s preliminary request for additional salary increases for faculty and other nonrepresented staff. Other notable spending differences include UC’s preliminary request for $50 million for academic quality initiatives and $35 million one‑time General Fund for deferred maintenance projects. The bottom part of Figure 15 shows all the calls on the $69 million remaining under the Governor’s assumed spending level.
Governor Is Not Supporting Further Tuition Increases at This Time. Though UC has been considering a potential tuition increase and built a preliminary budget assuming associated tuition revenue, the Governor has indicated that he is not in support of a tuition increase at this time. Specifically, the administration states that it is concerned about raising tuition on resident students because (1) in its view, UC could do more to reduce its overall cost structure; (2) students who do not have their tuition covered by financial aid would face additional financial burden; and (3) it indirectly would increase state costs for the Cal Grant program, which covers the cost of systemwide tuition for eligible low‑income undergraduate students. The administration calls on UC to implement further reforms before increasing tuition, though it does not specify which reforms it expects the university system to undertake.
2017‑18 Budget Conditions
Uncertain Whether UC Will Meet Every Expectation Set in Last Year’s Budget. The 2017‑18 budget conditioned $50 million on UC meeting certain expectations. As outlined in provisional budget language, the Director of Finance is to determine by May 1, 2018 whether UC has made a good faith effort to meet these expectations. Figure 16 lists these expectations. UC reports that it has completed one of them (adopting a policy prohibiting supplemental retirement payments) and is close to completing another condition (piloting activity‑based costing at three campuses). Some uncertainty surrounds whether UC will meet the remaining three conditions, as noted below.
- Budget Transparency. UC has provided greater clarity on the funding amounts and sources supporting its systemwide and presidential initiatives. Whether UC has improved its overall budget documents showing all revenues, expenditures, and carryover funds to the administration’s satisfaction is not yet clear.
- Auditor’s Recommendations. Of the ten recommendations the Auditor calls upon UC to complete by April 2018, the Auditor to date deems one as fully implemented and another as partially implemented. UC indicates that it is continuing to work on implementing all of the recommendations.
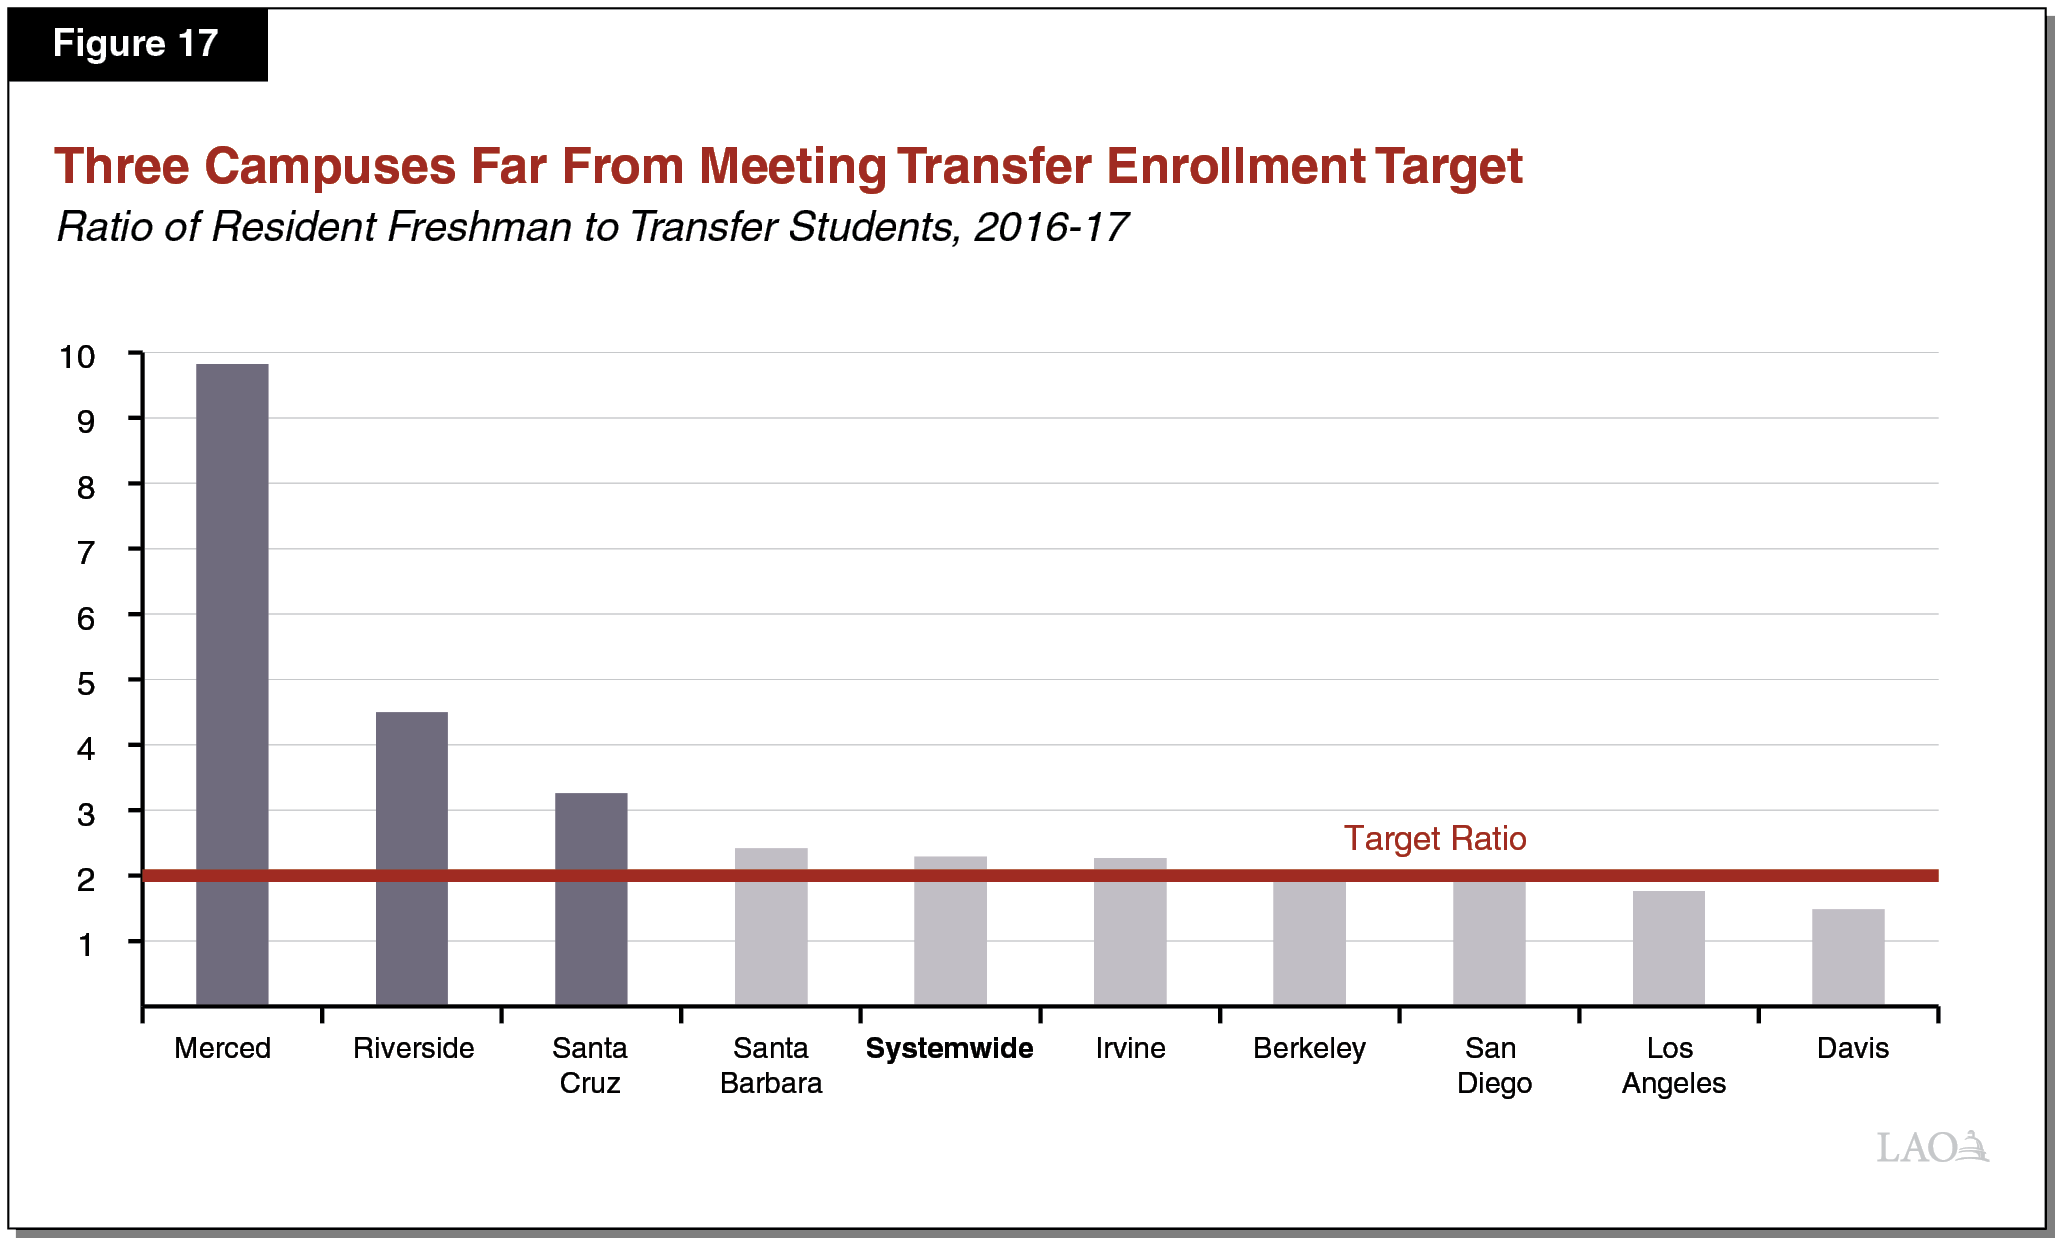
- Transfer Enrollment. Some uncertainty exists whether two campuses (Riverside and Santa Cruz) will attain the expected freshman‑to‑transfer ratio. Below, we describe the expected ratio and UC’s efforts thus far to attain it.
Figure 16
2017‑18 Budget Linked $50 Million With UC Meeting Numerous Expectations
|
By May 2018, the University of California must demonstrate it has made a good faith effort to achieve the following expectations: |
|
|
|
|
|
UC Has Had Aspirational Goal of Meeting Freshman‑to‑Transfer Ratio. Consistent with the state’s Master Plan for Higher Education, which envisions students transferring from community colleges to the universities, UC historically has aimed to enroll at least one new transfer student for every two new freshmen. (The ratio is intended to implement a recommendation in the Master Plan that no more than 40 percent of undergraduate enrollment at UC be lower‑division.) Over the past ten years UC has not attained this target, with the systemwide ratio hovering at about 1 transfer student for every 2.3 freshmen. Though the system does not meet the target, some campuses do (see Figure 17). Five of UC’s nine undergraduate‑serving campuses, however, did not meet the target in 2016‑17, with three of those campuses (Merced, Riverside, and Santa Cruz) especially far from the target.
UC Developed Plans for Santa Cruz and Riverside Campuses to Increase Transfer Enrollment. Due to concerns that the Riverside and Santa Cruz campuses would face the greatest challenge in boosting transfer enrollment to meet the 2017‑18 budget condition, each campus developed a strategic plan to attain the 2‑to‑1 ratio. The plans are similar. Both plans aim to increase outreach efforts to community colleges. Riverside, for example, plans to increase recruitment visits to its nearby community colleges as well as seven other community colleges with historically high transfer rates to UC. Riverside also plans to reach out to transfer students applying to CSU San Bernardino in an effort to reduce enrollment pressures on that campus. In addition to ramping up outreach efforts, both UC campuses plan to review their course articulation agreements with community colleges. Additionally, both campuses plan to review their transfer student admission requirements and potentially admit more lower‑division transfer applicants or certain students who have not completed all of their pre‑major course requirements.
UC Also Planning Systemwide Efforts to Better Streamline Transfer Process. These efforts include (1) establishing an agreement with the CCC Chancellor’s Office to share contact information for students deemed transfer ready, (2) increasing outreach efforts to community college counselors and students, and (3) exploring whether UC could better align its existing transfer pathways with the associate degree for transfer (ADT).
Administration Has Asked for Additional Efforts. In a December 2017 letter from the Department of Finance to UC, the department indicated that it thought UC’s plans were reasonable but additional effort was warranted. In particular, the Department of Finance noted that UC could do more to align its existing transfer pathways with the ADT. The department specifically indicated that UC could demonstrate good faith effort in this area by entering into a memorandum of understanding with the CCC Chancellor’s Office by May 1, 2018. In conversations with our office, UC indicated that it is working on implementing the recommendation.
A Couple of Options to Consider if UC Does Not Meet Transfer Condition. Were UC to fall short of achieving the 2‑to‑1 transfer ratio in 2018‑19, the Legislature could consider adopting a systemwide target next year instead of campus‑specific targets. A systemwide approach would give UC greater flexibility to increase transfer enrollment at campuses where the demand is highest. Additionally, we believe UC could continue working on simplifying the transfer process for students, especially by aligning its transfer admissions and lower‑division requirements with the ADT. Better alignment in this area would help transfer students better plan for their coursework while at community colleges and complete their upper‑division studies at UC more efficiently.
Key Cost Drivers
Legislature Has Key Decisions to Make Regarding UC Cost Increases. As we have noted in past analyses, the Legislature faces two key decisions regarding UC’s budget each year. The first decision regards which proposed cost increases are acceptable. Typically, the Legislature gives first priority to covering cost increases needed to maintain existing services. At the universities, the largest of these costs relate to compensation and enrollment. After addressing these base issues, the Legislature then typically considers proposals for program expansions or new programs.
Legislature Also Faces Key Decisions About How to Cover Those Cost Increases. After deciding which cost increases to support, the second decision regards how to fund them. Traditionally, UC cost increases have been implicitly shared between the state (through budget augmentations), resident students and their families (through tuition increases), and other fund sources (such as nonresident students). Under the Governor’s proposal, most of UC’s increase, after factoring funds from nonresident students and other redirections, would be covered by the state. Though the Legislature could choose to have the state bear the full effect of approved cost increases, it alternatively could consider sharing any cost increases about evenly between the state and nonfinancially needy students. (The state provides full tuition coverage for financially needy students.) Such an approach would recognize the notable public and private benefits of a UC education.
Legislature Faces Three Key Cost Areas. To assist the Legislature in setting its UC funding priorities for the budget year, we analyze three proposed cost increases: (1) salary increases for faculty and staff, (2) enrollment growth, and (3) UC’s plan for academic quality initiatives. Throughout our analysis, we do not assume fundamental changes to the way UC delivers instruction or runs its operations. If UC found new ways of instructing and operating that substantially reduced costs, these savings could be redirected to funding desired cost increases.
Compensation
Employee Compensation Is UC’s Largest Expense. Similar to most state agencies, employee compensation is UC’s largest cost. Compensation for faculty, staff, and administrators accounts for over 80 percent of UC’s core budget.
UC Regents Set Compensation Policies and Determine Compensation Levels. At UC, most faculty, as well as managers and other administrative staff, are not represented by employee unions. The remaining employees (such as health care workers at UC’s five medical centers; graduate student teaching assistants; and clerical, custodial, and other support staff) are represented by 13 systemwide and 14 campus‑specific collective bargaining units. Cost increases resulting from collective bargaining agreements, salary increases for nonrepresented employees, and the university’s employment benefit programs are funded from within UC’s support budget. By comparison, for most state agencies, the Legislature exerts more direct control over compensation policies and associated costs. Notably, state law provides guidance on health benefits, pension benefits, and other employment and post‑employment benefits available for state employees. State law also requires collective bargaining agreements between the state and employees to be ratified by the Legislature before going into effect.
UC Planning 3 Percent to 4 Percent Compensation Increases. UC’s preliminary budget plan assumes 3 percent general faculty salary increases ($83 million). It assumes an average salary increase of 3.6 percent across all its represented employee groups ($20 million). Additionally, UC budgets for benefit cost increases, including employee health, retiree health, and pension contributions.
UC Faculty Salaries Below Average of Traditional Comparison Institutions. Historically, UC has used compensation data from a group of eight research universities to gauge the competitiveness of its faculty compensation. The group includes four private institutions (such as Stanford and Harvard) and four public flagship institutions (such as the University of Michigan and the University of Virginia). As Figure 18 shows, average salaries for full professors at UC are below the average of these eight institutions but above the average of the four public comparison institutions. Salaries for associate and assistant professors compare similarly. In its preliminary budget plan, UC expresses concern that campuses face increasing difficulty competing with these comparison institutions to attract and retain high‑quality faculty.
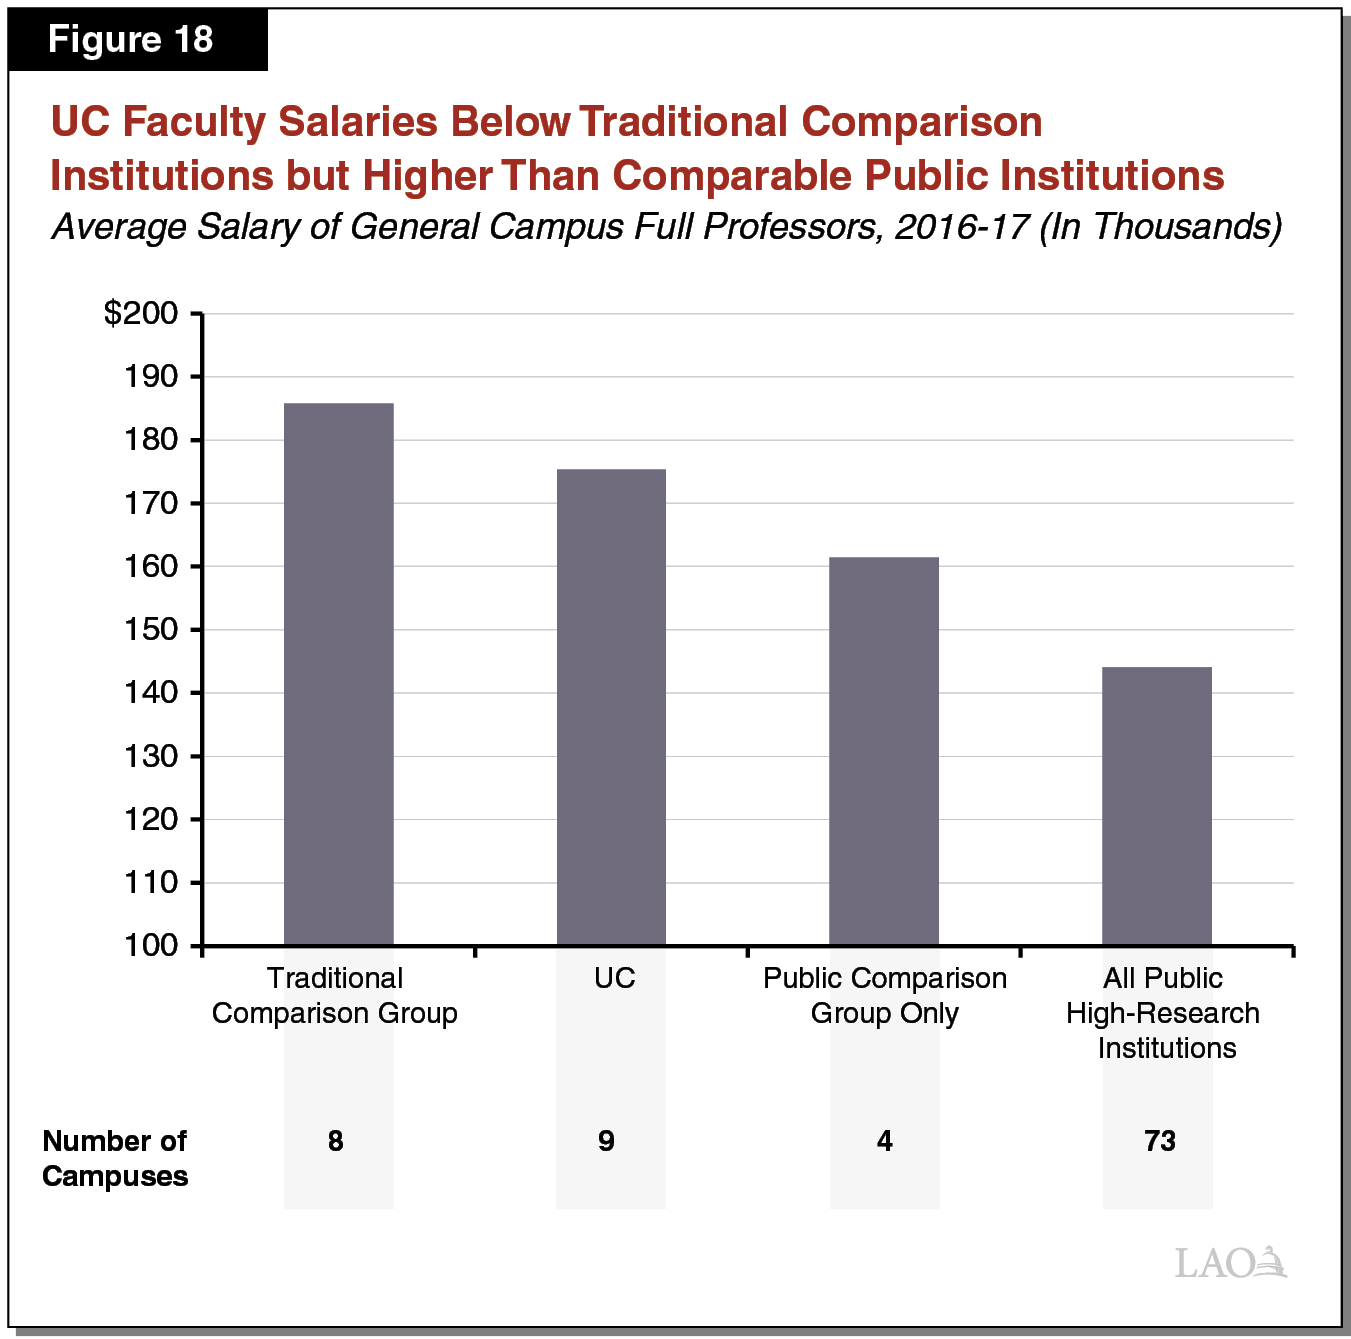
Salaries Remain Competitive Relative to Public Research Institutions. Comparing UC salaries to a small number of relatively expensive private and public research institutions may not accurately reflect the broader academic market in which UC campuses compete for faculty. To provide a broader picture of UC’s labor market, we use federal data to estimate the average salary of faculty at 73 public institutions around the country that conduct a similar level of research as UC. Figure 18 shows that UC professors make notably higher average salaries than the average across all of the 73 public institutions with intensive research.
Enrollment Growth
Last Year’s Budget Set 2018‑19 Enrollment Target. The 2017‑18 budget set an expectation for UC to enroll 1,500 more undergraduate resident students in 2018‑19 over the 2017‑18 level. In meeting this target, UC was to enroll at least one new transfer student for every two new freshmen. That is, at least 500 of the additional 1,500 students were to be new transfer students.
UC to Support Enrollment Growth From Redirected Funding. The 2017‑18 budget did not designate additional funding to support the additional enrollment in 2018‑19. Instead, the budget directed UC to report by December 1, 2017 on existing programs budgeted at UCOP from which monies could be redirected to support the enrollment growth. UC was expected to consult with legislative staff and the Department of Finance in the summer and fall regarding the possible changes. The budget also stated an expectation that enrollment costs be shared and UC’s cost structure reviewed. This process was designed to give legislative staff an opportunity to provide input on the possible programmatic reductions and allow the Legislature to finalize funding decisions in the 2018‑19 budget.
UC Identifies $15 Million That Could Be Redirected to Fund Enrollment Growth. Figure 19 shows how UC proposes to achieve the $15 million in redirected resources intended to support enrollment growth. Of this amount, $8 million would come from reductions to UCOP’s budget. The remaining funds would come from other sources, including: (1) redirected lottery funds ($3 million); (2) savings, according to UC, by providing certain systemwide programs a smaller budget increase than otherwise planned for 2018‑19 ($2.5 million); and (3) eliminating certain programs budgeted at certain campuses ($1.5 million).
Figure 19
UC’s Proposed Redirection Plan for Funding 2018‑19 Enrollment Growth
(In Millions)
|
Funding |
|
|
Reductions to Office of the President |
|
|
UC Presidential Initiatives Fund |
$2.0 |
|
Contingency budget (50 percent reduction) |
2.1 |
|
Professional services budget (5 percent reduction) |
1.5 |
|
Chancellor’s House maintenance |
0.5 |
|
Unpaid merit awards |
0.5 |
|
Administrative fund for campus chancellors |
0.4 |
|
Travel and meetings budget (10 percent reduction) |
0.4 |
|
Star Award Policy |
0.3 |
|
Outreach and membership activities |
0.2 |
|
Administrative fund for Office of the President (60 percent reduction) |
0.1 |
|
Subtotal |
($8.0) |
|
Growth in lottery funds |
$3.0 |
|
Reduced growth to campus programs |
|
|
Agricultural Experimental Stations |
$1.4 |
|
Neuropsychiatric Institutes |
0.5 |
|
Scripps |
0.4 |
|
Mental Health Teaching Support |
0.2 |
|
Medical Investigation of Neurodevelopmental Disorders (MIND) Institute |
0.1 |
|
Subtotal |
($2.5) |
|
Eliminated campus programs |
|
|
California Program on Access to Care |
$0.9 |
|
Health Initiatives of the Americas |
0.3 |
|
US‑Mexico Social Security and Tax Policy |
0.2 |
|
Graduate Fellows Program |
0.1 |
|
Subtotal |
($1.5) |
|
Total |
$14.9 |
Overall Redirection Plan Is a Reasonable Starting Point. Overall, we think UC’s proposed list is a reasonable starting point, as UC met with legislative staff throughout the fall and identified savings sufficient to support the state share of the new enrollment. While we believe the redirections are reasonable for 2018‑19, we note that the identified savings are very modest. During spring budget hearings, the Legislature may want to consider whether such a plan meets the Legislature’s intent to have the university more fundamentally revisit its cost structure.
Recommend Conforming Adjustment to UCOP Line Item. Regardless of the Legislature’s specific funding decision for enrollment growth in 2018‑19, we recommend any programmatic reductions to UCOP be reflected in the office’s line item in the budget. That is, were the Legislature to authorize UC’s proposed enrollment funding plan, we recommend it subtract $8 million from UCOP’s appropriation (bringing the line item down to $341 million) and transfer the funding to the campuses.
UC Planning for More Enrollment Growth in 2018‑19. UC’s draft budget plan assumes growth in resident undergraduate students of 2,000 FTE students—500 more than expected in the 2017‑18 budget. UC indicates that this additional growth is intended to respond to requests the Legislature made after the enactment of the budget. In addition to the higher growth in resident undergraduate enrollment, UC plans to grow graduate enrollment in 2018‑19 by 500 FTE students (both resident and nonresident) over the 2017‑18 level. To cover the costs of the resident undergraduate and graduate enrollment growth, UC assumes in its budget plan that the state provides an additional $10 million ongoing General Fund beyond the Governor’s budget.
Recommend Legislature Consider Enrollment Expectations for 2019‑20 Academic Year. The Legislature in recent years has established enrollment expectations one year after the budget year to better align the timing of budget decisions with UC’s admissions calendar. We recommend the Legislature continue this practice and focus its attention toward enrollment growth for 2019‑20. Whereas UC’s admission decisions for 2018‑19 largely have already been made, the Legislature still could influence UC’s enrollment levels for 2019‑20. In considering possible enrollment levels for 2019‑20, the Legislature likely will want to consider the results of the state’s recent eligibility study, which found UC likely is drawing from somewhat beyond its Master Plan pool.
Academic Quality
UC Cites Four Possible Uses of Academic Quality Funds. Under UC’s proposal, campuses would have flexibility to allocate a $50 million augmentation based on campus‑specific priorities. Though the funding would be unrestricted, UC cites four examples of how campuses might use these funds:
- Faculty Hiring. UC would like to hire additional faculty to reduce its student‑to‑faculty ratio. In 2015‑16, the ratio was 21 students for every faculty member. By comparison, the ratio was 19.5 in 2002‑03. According to UC, reducing the student‑to‑faculty ratio would allow campuses to offer smaller class sizes and expand course offerings.
- Faculty Start‑Up Costs. To attract its first‑choice candidates, UC campuses typically offer new faculty hires certain funds to help foster their research. These start‑up costs include equipment, staff support, and renovation of laboratory space. UC argues that campuses could use the increased funding for start‑up costs to attract these first‑choice candidates.
- Increase Graduate Student Stipends. Doctoral students typically receive financial aid to cover their tuition, fees, and all or a portion of their living expenses. The difference between a doctoral student’s total grant aid and tuition and fees is known as a “net stipend.” UC estimates that while the net stipend it offers to resident Californians is competitive to other institutions, net stipends remain uncompetitive for nonresident students. UC argues that increasing net stipends for nonresident students would allow it to better attract top graduate students.
- Increasing Undergraduate Instructional Support. In its budget plan, UC cites several areas campuses might choose to provide additional funding, including replacing instructional equipment, augmenting funding for instructional technology and libraries, and providing funding for facility maintenance.
UC Proposal Raises Concerns. Below, we summarize our key concerns.
- Student Outcomes Improving. As Figure 20 shows, freshman graduation rates—one key measure the Legislature uses to examine UC performance each year—has increased over the last two decades. Notably, graduation rates have not declined even as UC has increased its student‑to‑faculty ratio.
- Some Concerns Could Be Addressed From Other Spending Increases. In addition to the proposed $50 million for academic quality, UC’s budget plan includes $32 million for a 2.5 percent increase for general operations and equipment. These funds would be available for equipment replacement, facility maintenance, and other priorities identified by the university. The Legislature also may wish to address any concerns related to attracting and retaining faculty as part of its compensation increase decisions.
- Little Accountability Over Use of Funds. Because campuses may allocate the funds in any way they see fit, the Legislature would have little information over how these funds are actually used.
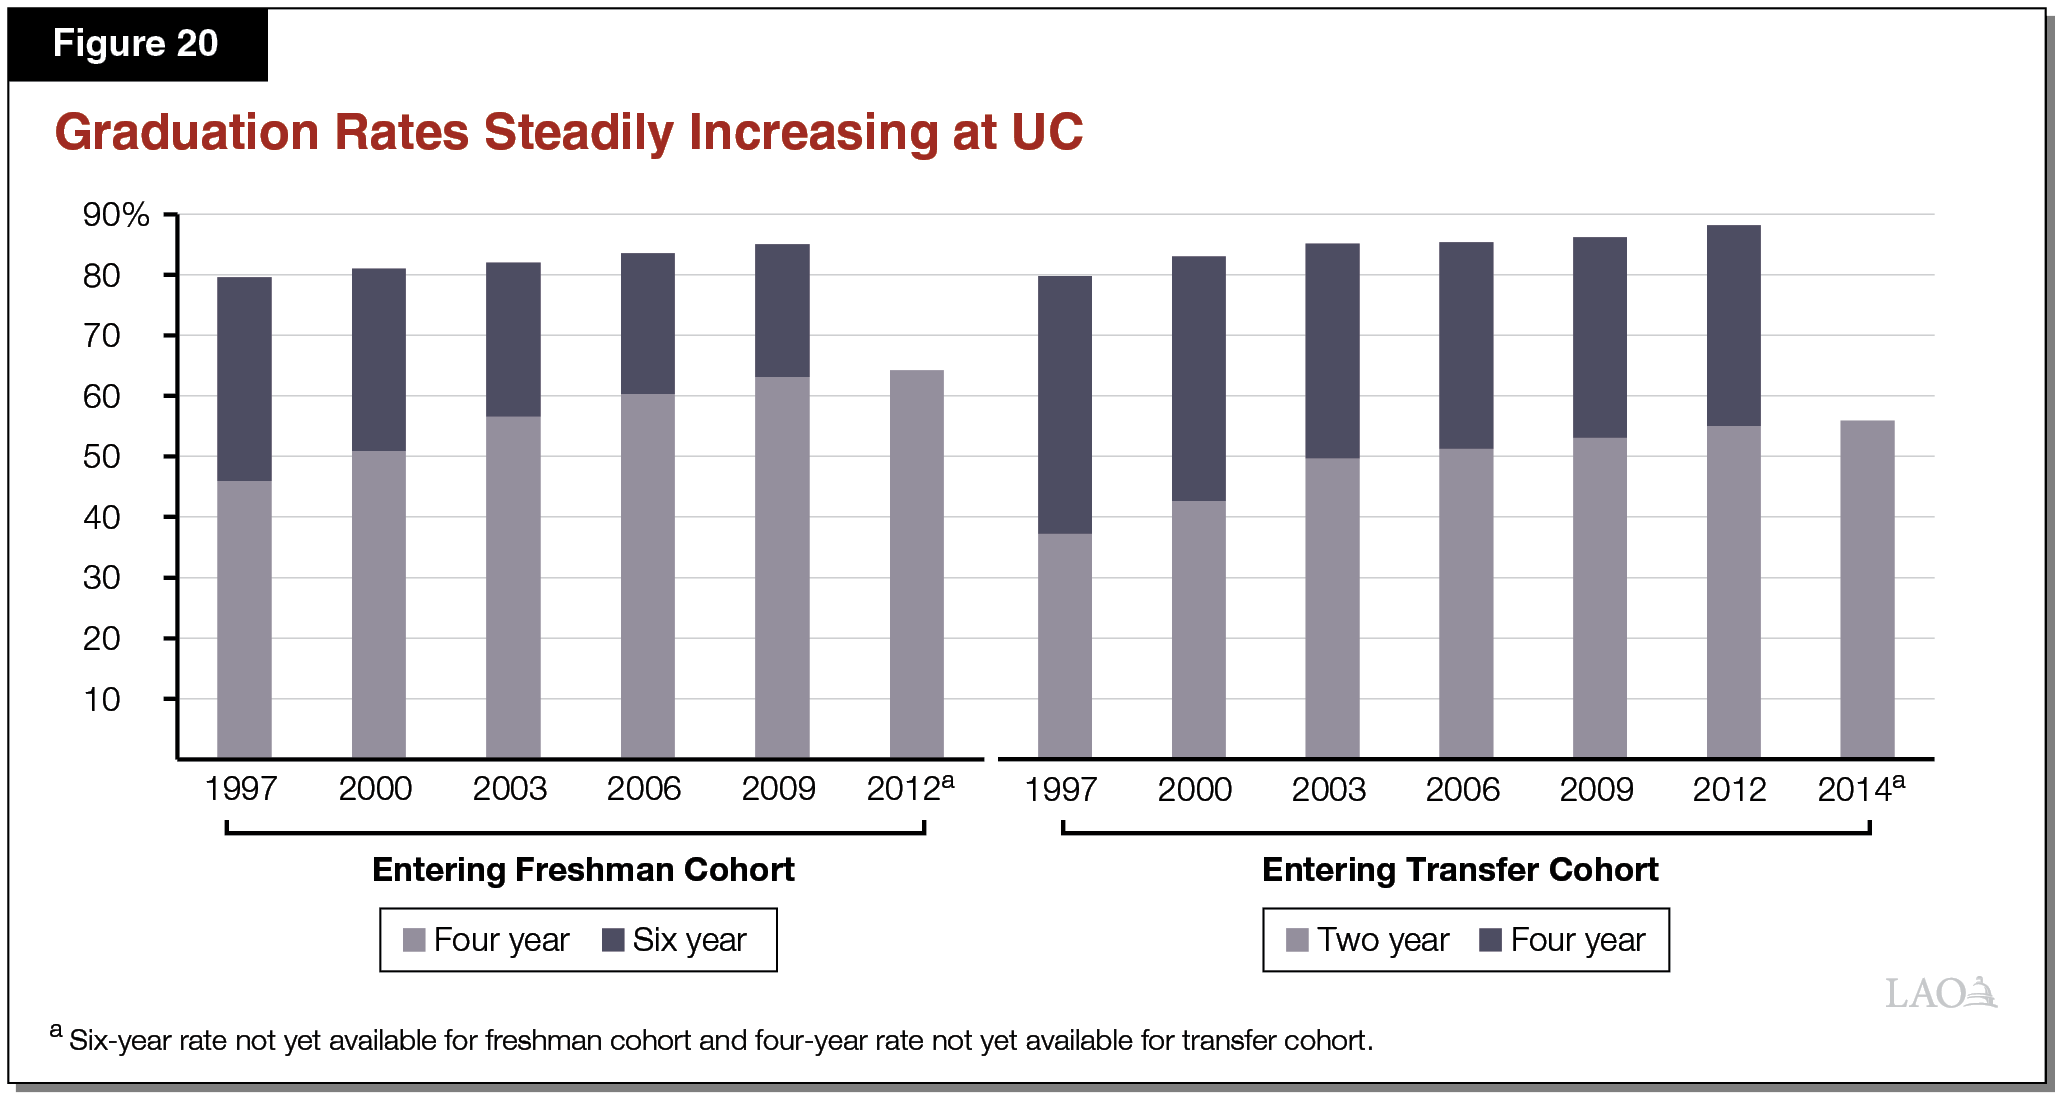
Recommend Legislature Signal Program Is a Lower Priority. Given the issues we raise above and the many other existing cost pressures facing UC and the state, we recommend the Legislature consider funds for academic quality initiatives to be a lower priority for 2018‑19. Were the Legislature interested in providing funds for more targeted purposes, we recommend the Legislature specify the use of the funding in the budget act.
Facilities
In September, UC submitted a list of nine capital outlay projects proposed for 2018‑19. Consistent with state law, UC would fund these projects by issuing bonds and paying the associated debt service from its state General Fund support. In order to use its General Fund support for debt service payments, state law requires UC to receive approval from the Department of Finance on each of the projects, following legislative review. Under the review process, the department is to submit a preliminary list of approved projects to the Legislature by February 1, with the final list submitted no sooner than April 1, 2018. The budget committees are to review the proposals during the interim. In the following section, we provide an overview of the projects and their associated costs, assess the proposals, and provide recommendations.
Overview
UC Proposes Nine Projects Totaling $301 Million in State Costs. Figure 21 lists the nine projects. In addition to bonds supported by state funds, UC would use nonstate funds to supplement funding for six of the nine projects. Accounting for all proposed state and nonstate funds, the nine projects would cost $324 million in 2018‑19 (for specified phases) and $464 million total (including all phases).
Figure 21
University of California 2018‑19 Capital Outlay Request
(Dollars in Thousands)
|
Campus |
Project |
2018‑19 |
All Years |
|||
|
Phases |
State Cost |
State Cost |
Total Cost |
|||
|
Systemwide |
Deferred maintenance |
C |
$35,000 |
$35,000 |
$35,000 |
|
|
Systemwide |
Northern Regional Library Facility, phase 4 expansion |
C,Ea |
30,000 |
30,000 |
32,500 |
|
|
San Diego |
New Ridge Walk Complex |
Ca |
50,000 |
50,000 |
117,409 |
|
|
Davis |
New Teaching and Library Complex |
Ca |
50,000 |
50,000 |
66,000 |
|
|
Riverside |
New Student Success Center |
P,W,C,Ea |
50,000 |
50,000 |
60,255 |
|
|
Santa Cruz |
New Kresge College academic building |
Wa |
2,800 |
50,000 |
53,000 |
|
|
San Francisco |
Health Sciences Instruction and Research seismic renovation |
Ca |
37,000 |
37,000 |
47,432 |
|
|
Berkeley |
Giannini Hall seismic renovation |
Cb |
35,950 |
39,200 |
39,200 |
|
|
San Francisco |
Health Sciences Instruction and Research life‑safety renovation |
Cb |
10,000 |
13,000 |
13,000 |
|
|
Totals |
$300,750 |
$354,200 |
$463,796 |
|||
|
aPrevious phases funded by nonstate funds. bPrevious phases approved and funded by state. C = construction; E = equipment; P = preliminary plans; and W = working drawings. |
||||||
Four Projects Involving New Space ($153 Million). The San Diego, Davis, Riverside, and Santa Cruz campuses each propose constructing new classrooms, faculty offices, and other academic space to accommodate enrollment growth. The mix of classroom and office space would vary at each project. At Riverside, most of the state‑supportable space would be for classrooms (89 percent). By comparison, a majority of the space at San Diego (69 percent) and Santa Cruz (60 percent) would be for faculty and staff office space. UC does not provide a specific breakdown of space for the Davis project but indicates the new building would have 2,000 classroom seats as well as study space. In addition to constructing state‑supportable space, some of the projects would construct nonacademic space, such as student recreation rooms, that would be supported by nonstate funds. In its proposals, UC notes that the San Diego, Riverside, and Santa Cruz campuses would relocate existing administrative and advising services of certain academic departments into the new buildings.
Three Projects Are for Renovations at Two Campuses ($83 Million). Berkeley proposes to make seismic corrections to one facility, and San Francisco proposes two projects to do seismic and life‑safety renovations for one building. Previous phases of two of the projects (Berkeley and the life‑safety renovations at San Francisco) were approved by the state in 2017‑18.
$35 Million for Deferred Maintenance Systemwide. UC is proposing to use bond funds to undertake $35 million in deferred maintenance projects. The budget year would mark the fourth consecutive year the state has provided or authorized funding specifically for deferred maintenance at UC. In 2017‑18, the state also approved $15 million for UC to fund a team of experts to visit each campus and assess the current condition of academic facilities. One goal of the assessment is to attain a more accurate estimate of UC’s deferred maintenance backlog.
$30 Million to Expand the Northern Regional Library Facility. The facility, which is located in Richmond, is one of two libraries (the other is in Los Angeles) that provides overflow storage to UC campuses. The two libraries together store around 14 million of UC’s 40 million volumes. The two facilities currently have combined capacity of around 15 million items. Based on historical growth of UC’s collections, UC estimates the two facilities will reach capacity sometime between 2018 and 2022. The proposed project would add 26,610 gross square feet to the northern facility, which would increase total capacity of the two regional libraries to around 18 million volumes (an increase of around 20 percent).
Projects Would Cost $22 Million in Annual Debt Service. UC estimates it would begin paying debt service on the projects in 2020‑21, with debt service costs rising to $22 million annually by 2023‑24. UC anticipates requesting authority for the construction phase of the Santa Cruz project in 2019‑20, which it estimates would have an additional debt service cost of $3.4 million annually. Including costs from previously approved projects, UC estimates its debt service costs would rise to $252 million in 2024‑25 and remain around that level in subsequent years. As a share of its General Fund support, UC estimates its debt service costs would rise to 6.3 percent. Under state law, this debt service ratio cannot exceed 15 percent. This statutory limit excludes payments UC makes annually on general obligation bond debt. Including those payments, total debt service costs at UC would be $416 million in 2024‑25, around 10 percent of what UC forecasts its General Fund support to be that year.
Assessment
UC Has Not Planned for Enrollment Systemwide. As a statewide university system that manages enrollment across all of its campuses, we believe UC should plan for enrollment systemwide when assessing need for additional space at campuses. In its justification for its four 2018‑19 expansion projects, however, UC does no systemwide analysis, instead citing locally developed campus goals as the impetus for the expansions.
Overall Facility Utilization at UC Is Below Legislative Guidelines. Before constructing new facilities, the Legislature traditionally has considered whether UC is maximizing the use of its existing facilities. The Legislature historically has gauged facility utilization according to statutory guidelines established for classrooms and teaching laboratories. (The nearby box describes these guidelines.) In fall 2016, UC systemwide used its classroom space at 86 percent of the legislative guidelines. While UC used its teaching laboratories above the legislative guidelines (105 percent), these spaces represent a small portion of instruction at UC (around 10 percent in fall 2016). As Figure 22 shows, much of the underused classroom space is located at Berkeley and Los Angeles, the campuses with the two largest student enrollments. Summer enrollment also is below legislative expectations. In the summer 2017 term, summer enrollment was 20 percent of 2016‑17 fall‑through‑spring enrollment. Under existing law, the state has established an expectation that UC attain a summer enrollment ratio of 40 percent.
Facility Utilization Guidelines
The Legislature’s facility utilization guidelines have three components: (1) how often rooms are available for use, (2) how often rooms are actually used, and (3) how often seats in a room are filled. The figure below shows the guidelines for classrooms and teaching laboratories. Classrooms are to be available for use from Monday to Friday, 8 a.m. to 10 p.m. (70 hours per week) and actually used 75 percent of that time (53 hours per week). About two‑thirds of classroom seats are to be filled throughout the week (equating to 35 seat hours per week). Teaching laboratories have lower expectations regarding seat hours per week.
Legislative Guidelines for Facility Use at UC
|
Room Category |
Room Availability |
Room Usage |
Seat Occupancy |
||||
|
Hours/Week |
Percent |
Hours/Week |
Percent |
Hours/Week |
|||
|
Classrooms |
70 |
75% |
53 |
67% |
35 |
||
|
Teaching Laboratories |
|||||||
|
Lower division |
45 |
61 |
28 |
85 |
23a |
||
|
Upper division |
45 |
49 |
22 |
80 |
18a |
||
|
a UC does not classify its laboratories as lower or upper division. It instead uses an average of the two guidelines (20 hours per week). |
|||||||
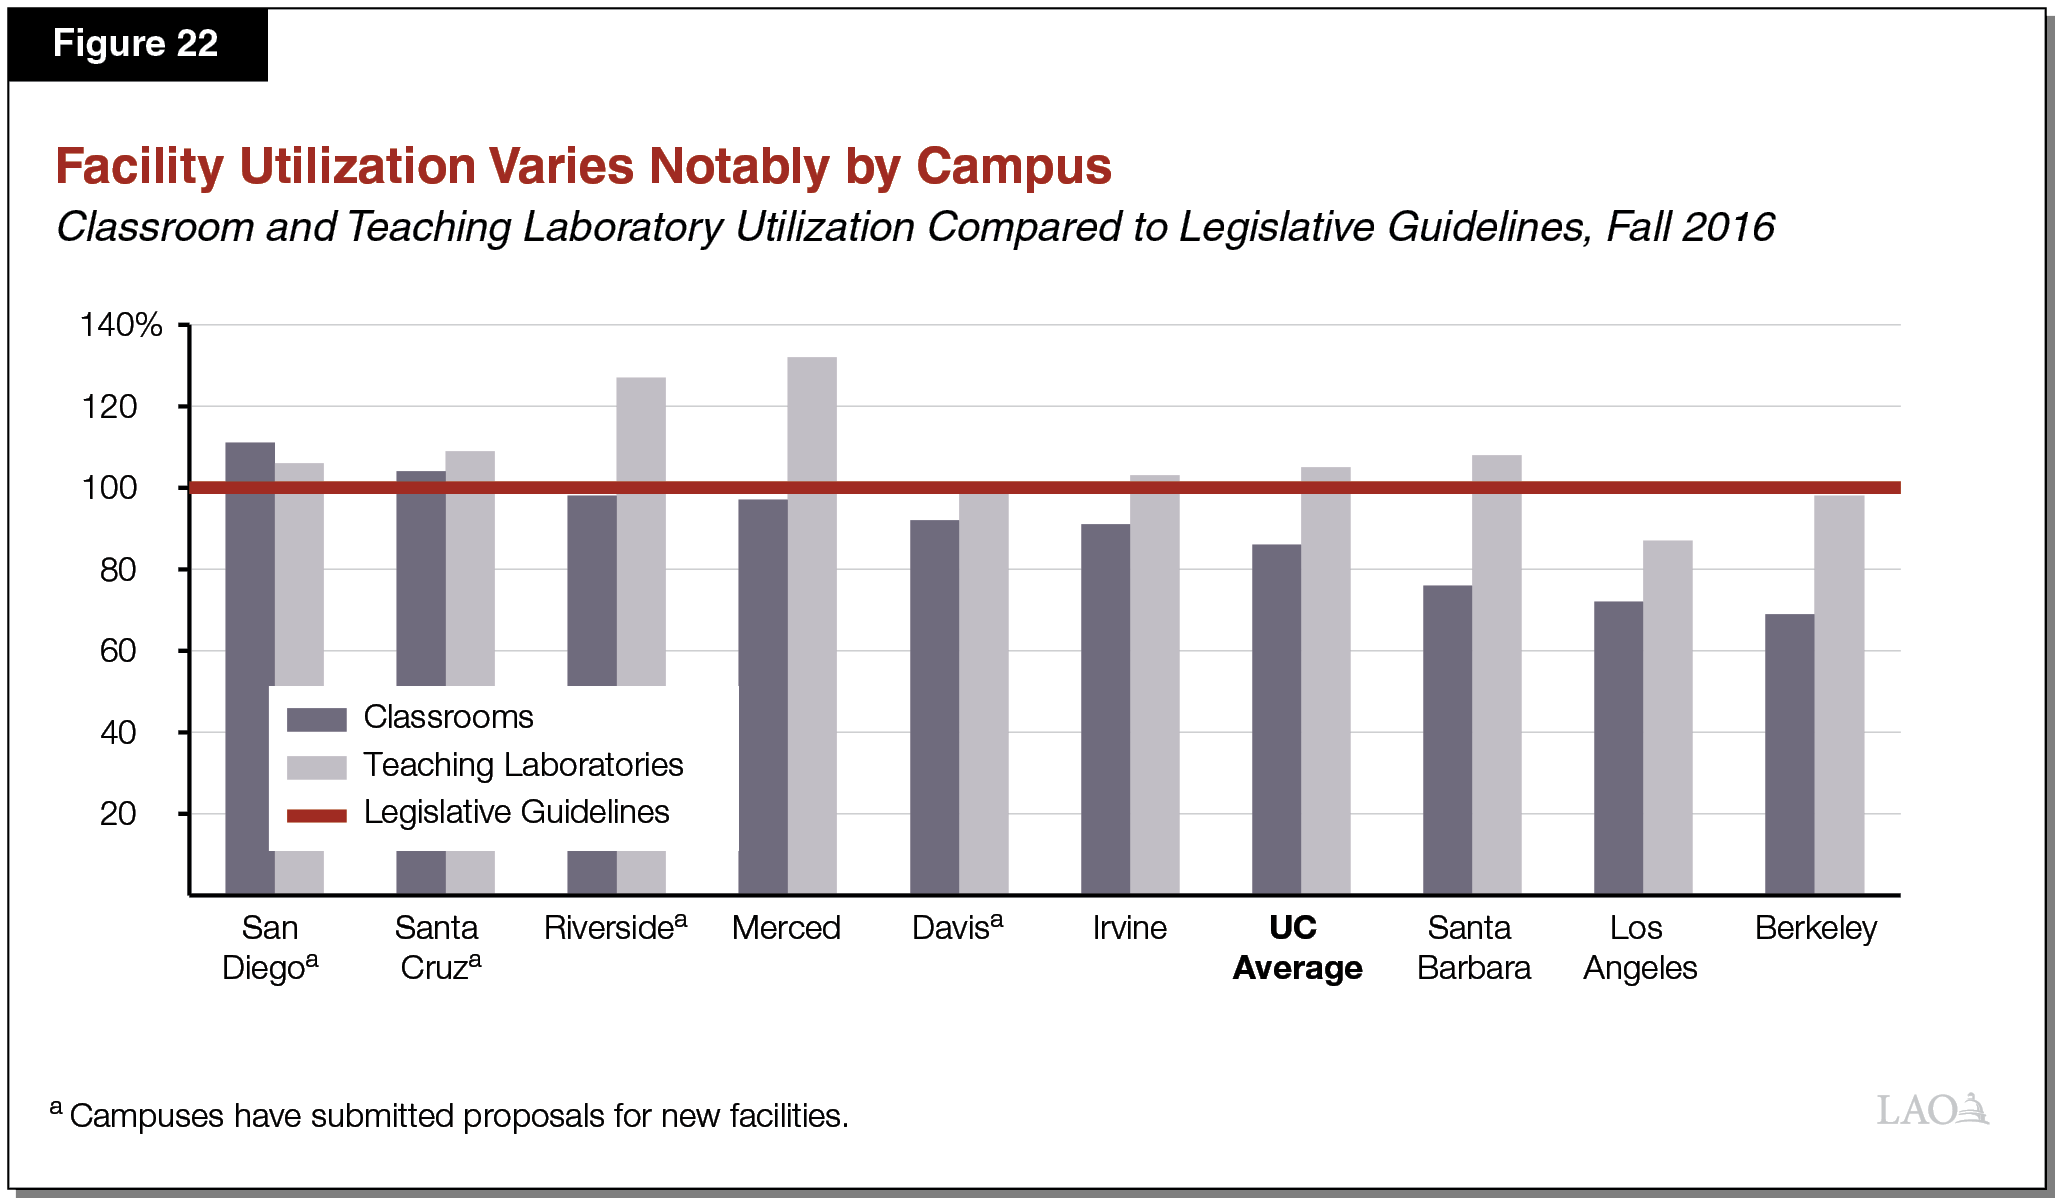
Costs Vary Notably for New Facility Projects. As Figure 23 shows, construction costs would vary from $1,400 per assignable square foot at the Santa Cruz campus to $688 per assignable square foot at the San Diego campus. Even costs for similar spaces would vary by project. Classroom space at Riverside, for example, would cost around double for that same type of space at San Diego. In conversations with our office, UC noted several general reasons why costs might differ across projects. For example, certain market conditions in a campus’s region, such as a labor shortage, could increase costs. Projects that require extensive site development tend to cost more than projects that can use a site’s existing foundation and related infrastructure. While these general concepts are reasonable, UC has not provided specific explanations regarding the wide variation in proposed project costs this year.
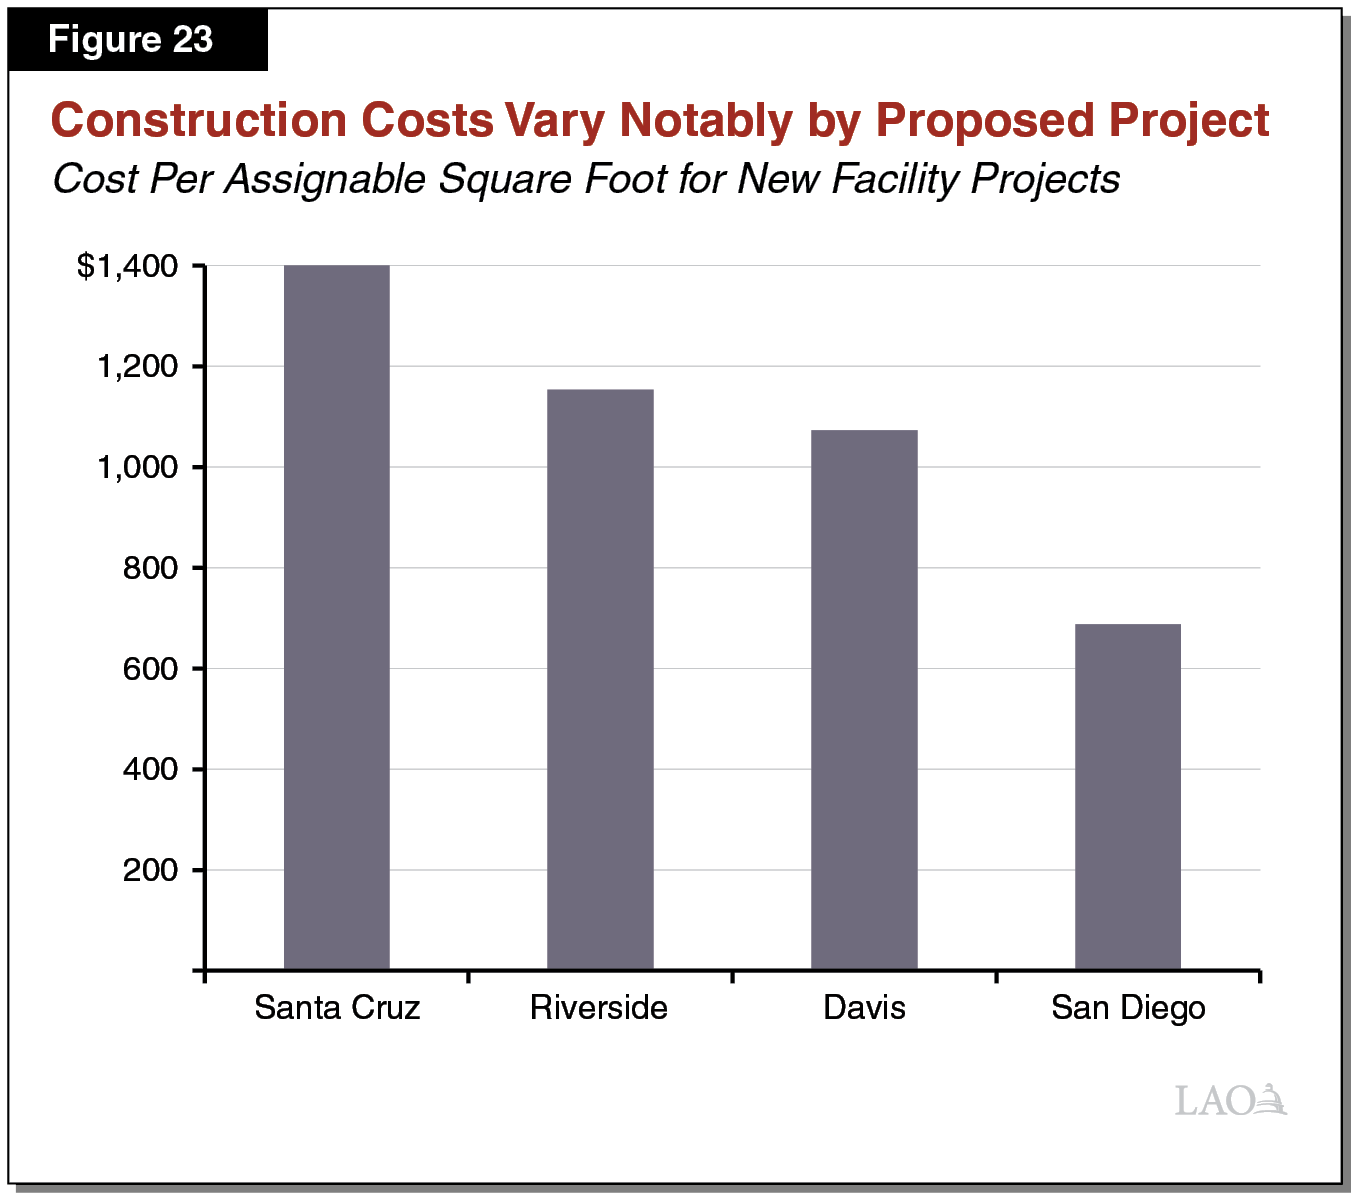
Segment Lacks Plan to Eliminate Maintenance Backlog and Improve Ongoing Maintenance Practices. Though UC is currently studying the condition of its existing facilities, we believe the university would benefit from: (1) a long‑term funding plan to retire its backlog, and (2) a review of its current scheduled maintenance practices (such as setting funds aside when new systems are installed) so as to avoid the re‑emergence of future maintenance backlogs. Without both plans in place, the Legislature cannot have confidence that UC’s capital program is being well managed and maintained.
UC Library Holdings Continuing to Grow. About every ten years, the state has provided funds to expand the Northern Regional Library to accommodate UC’s growing collections. The Legislature faces this decision again, as UC anticipates its collections will grow by 300,000 items annually over the next several years. While adding more space has been the Legislature’s traditional approach to addressing expanding library collections, opportunities now exist to store documents in a digital format rather than storing as physical volumes. In recent years, UC has tried to expand its digital holdings through the California Digital Library, a systemwide program housed at UCOP. Expanding such efforts could reduce some of the need for additional space. Furthermore, we note that such decisions are not unique to UC. For example, we raise similar questions in our analysis of capacity issues at the State Archives in our recent publication State Archives: Limited Space for a Growing Collection (2018).
Recommendations
Recommend Legislature and UC Develop Long‑Term Enrollment Plans. The Legislature faces key decisions in 2018‑19 regarding freshman eligibility at UC. These decisions will help shape enrollment growth and associated space needs for the university. We recommend the state develop eligibility policies and set enrollment expectations prior to authorizing the construction of new academic space. After making these determinations, we recommend the Legislature direct UC to develop conforming systemwide long‑range enrollment and capital outlay plans. UC’s systemwide plans should include (1) enrollment projections based on anticipated demographic changes in the state and eligibility criteria, (2) strategies to expand the use of existing facilities across the system—such as directing enrollment to campuses with additional capacity and increasing summer use—before adding new space, and (3) clear justification for the need to add space within the system.
Recommend Legislature Direct UC to Report on Cost Variation in Spring Hearings. For any UC construction project the Legislature would like to consider in 2018‑19, we recommend it direct UC to report on construction costs per square foot and explain any variation in these costs for the same type of space across campuses. To the extent UC is unable to provide sufficient justification, we recommend the state withhold authorization of the projects.
Recommend Legislature Require UC to Develop Comprehensive Maintenance Plan. To address concerns regarding maintenance practices at UC, we recommend the Legislature adopt budget language requiring UC to develop a long‑term maintenance plan. The plan should include (1) a multiyear expenditure plan for eliminating the backlog of projects, including proposed funding sources; and (2) a plan for how to avoid developing a maintenance backlog in the future.
Consider Exploring Digital Options for UC Libraries. We recommend the Legislature direct UC to report at spring hearings on its current efforts to reduce pressure for new physical library storage space. As part of its review, the Legislature could ask UC to identify current digital collections and efforts to convert physical items into digital format. The Legislature also could ask UC to do a reassessment of the need to maintain the size of its existing physical library collections.
California State University
In this section, we first describe the Governor’s budget plan for CSU and outline the basic choices the Legislature faces regarding CSU’s budget. We then assess several specific components of CSU’s budget and make associated recommendations.
Overview
Under Governor’s Proposal, CSU Budget Is $10.4 Billion From All Sources in 2018‑19. As Figure 24 shows, CSU’s total budget would increase by $93 million (0.9 percent) over the revised 2017‑18 level. Of total CSU funding, two‑thirds ($7.1 billion in 2018‑19) comes from core funds—a combination of state General Fund, student tuition and fees, and other state funds (primarily lottery revenue). CSU also receives $1.4 billion in federal funds. In addition, CSU operates various campus enterprises, such as student dormitories and parking facilities, which are estimated to generate $1.9 billion in associated revenue in 2018‑19.
Figure 24
California State University Funding by Source
(Dollars in Millions)
|
2016‑17 Actual |
2017‑18 Revised |
2018‑19 Proposed |
Change From 2017‑18 |
||
|
Amount |
Percent |
||||
|
Core Funds |
|||||
|
General Fund |
|||||
|
Ongoinga |
$3,454 |
$3,719 |
$3,856 |
$137 |
3.7% |
|
One time |
110 |
47 |
2 |
‑45 |
‑96.3 |
|
Subtotals |
($3,564) |
($3,765) |
($3,858) |
($93) |
(2.5%) |
|
Tuition and Feesb |
$3,077 |
$3,168 |
$3,168 |
— |
— |
|
Other State Fundsc |
50 |
53 |
53 |
— |
— |
|
Totals |
$6,691 |
$6,986 |
$7,078 |
$93 |
1.3% |
|
Other Funds |
|||||
|
Federal Funds |
$1,352 |
$1,400 |
$1,400 |
— |
— |
|
Other CSU Fundsd |
2,273 |
1,871 |
1,871 |
— |
— |
|
Totals |
$3,624 |
$3,271 |
$3,271 |
— |
— |
|
Grand Totals |
$10,315 |
$10,257 |
$10,350 |
$93 |
0.9% |
|
FTE Studentse |
401,706 |
403,448 |
403,448 |
— |
— |
|
Core Funding Per Student |
$16,656 |
$17,315 |
$17,544 |
$229 |
1.3% |
|
aIncludes funding for pensions and retiree health benefits. bIncludes funds that CSU uses to provide tuition discounts and waivers to certain students. In 2018‑19, CSU would provide $701 million in such aid. cIncludes lottery funds and, beginning in 2017‑18, $2 million ongoing from the State Transportation Fund for transportation research. dIncludes funds such as housing fees, parking fees, and extended education charges. eOne FTE represents 30 credit units for an undergraduate and 24 credit units for a graduate student. Includes resident and nonresident students. FTE = full‑time equivalent. |
|||||
Governor’s Budget Includes $3.9 Billion in General Fund Support for CSU in 2018‑19. As Figure 25 shows, the Governor proposes a $92 million (2.4 percent) ongoing unrestricted increase for CSU—the same dollar amount the Governor proposes for UC. In addition, the Governor’s budget provides a total of $47.1 million in earmarked funding, primarily to support increased pension costs and higher retiree health benefit costs. (In an effort to encourage CSU to consider pension costs as part of its new hiring and salary decisions, the state changed how it budgeted for CSU pension costs a few years ago. Under the new policy, the state provides direct funding for CSU’s pension costs attributed to its 2013‑14 payroll level, but CSU is responsible for funding any pension costs beyond that level using its unrestricted funds.) Of the earmarked augmentations, $181,000 (4.4 percent) is for CSU’s Center for California Studies. This increase includes (1) $100,000 in new General Fund support for the Education Policy Fellowship Program; and (2) $81,000 for a 2.5 percent cost‑of‑living adjustment to executive, legislative, and judicial fellow stipends.
Figure 25
California State University General Fund Changes
(In Millions)
|
2017‑18 Revised Funding |
$3,765.4 |
|
Unrestricted base increase (2.4 percent) |
$92.1 |
|
Pension adjustment |
24.9 |
|
Retiree health benefits adjustment |
20.3 |
|
Open educational resourcesa |
1.7 |
|
Center for California Studies |
0.2 |
|
Remove one‑time funding provided in prior years |
‑46.6 |
|
Total Changes |
$92.5 |
|
2018‑19 Proposed Funding |
$3,858.0 |
|
aFunding authorized pursuant to Chapter 633 of 2015 (AB 798, Bonilla). |
|
Governor Signals Desire for No Tuition Increases in Budget Year, Sets Expectations for CSU Spending Priorities. In the Governor’s Budget Summary, the Governor expresses a desire for CSU to reduce its cost structure and keep college affordable for students. Accordingly, the Governor’s budget does not assume any increase in tuition at CSU. The Governor’s Budget Summary also indicates the Governor’s desire for CSU to use a portion of his proposed unrestricted base increase for the Graduation Initiative. The Governor’s budget does not establish an enrollment target for CSU or earmark any new funding for enrollment growth.
At Governor’s Proposed Funding Level, CSU Would Prioritize Basic Cost Increases and Employee Compensation. CSU indicates it would use the Governor’s proposed $92 million unrestricted base increase to address two funding priorities—(1) basic cost increases (such as higher health care premiums for current employees and additional pension costs on payroll exceeding the 2013‑14 level) and (2) faculty and staff compensation increases. Contrary to the Governor’s message, CSU indicates it would not be able to increase funding for the Graduation Initiative. CSU maintains that the Governor’s proposed funding level is insufficient to cover its key cost increases, as explained in the nearby box.
CSU Requesting Far More Funding Than Proposed by Governor
Whereas the Governor’s budget includes a $92 million increase for the California State University (CSU), the system is requesting a $283 million increase—$191 million higher than the Governor’s proposed level. Of the $283 million, CSU would like $263 million to come from the state General Fund and $20 million to come from higher tuition revenue resulting from 1 percent enrollment growth. As the figure shows, the largest single component of CSU’s spending plan is $122 million for faculty and staff compensation increases. CSU also is requesting funding for its Graduation Initiative, basic cost increases, enrollment growth, and capital outlay projects.
CSU’s Spending Plan Request for 2018‑19
(In Millions)
|
Requested Increase |
|
|
Compensation |
$122 |
|
Graduation Initiative |
75 |
|
Basic costs |
31 |
|
Enrollment growth (1 percent) |
40 |
|
Facilities projects |
15 |
|
Total |
$283a |
|
aOf this amount, CSU requests that $263 million come from the state General Fund, with the remaining $20 million generated by tuition revenues from 1 percent enrollment growth. |
|
CSU Considering a Tuition Increase for 2018‑19. Given that CSU believes the funding included in the Governor’s budget is insufficient to address its budget priorities, CSU is considering a tuition increase. Under the proposal drafted by the Chancellor’s Office, tuition for resident undergraduates would increase by 4 percent. Tuition for nonresidents and resident graduate students would increase by about 6 percent. The proposed increase would generate about $70 million in additional net revenue, which, when combined with the Governor’s proposed $92 million unrestricted General Fund base increase, would allow CSU to cover $31 million in identified basic cost increases and all $122 million in compensation cost increases—leaving about $9 million for the Graduation Initiative or other CSU priorities. The Board of Trustees could vote on the tuition proposal at its May 2018 meeting. If approved, this would be the second straight year of tuition increases at CSU. (Prior to last year, tuition had been flat since 2011‑12.)
CSU Proposes to Use $13 Million in Existing Core Funds for Five Capital Outlay Projects. CSU’s 2018‑19 capital outlay request includes 27 projects totaling $1.4 billion in estimated costs ($1.2 billion from university revenue bonds and $189 million from campus reserves or other funds). CSU plans to finance five of these projects in the budget year using existing core funds. In 2016, CSU was able to “free up” $50 million from its base budget by restructuring some debt and retiring other debt from completed projects. The $50 million enables CSU to finance a total of approximately $750 million in projects over a multiyear period. In 2018‑19, CSU proposes using about $13 million of that freed‑up funding to finance $201 million in costs for its five identified projects. In addition, CSU is requesting $15 million in new state funding to finance an extra $225 million relating to five other facilities projects. CSU has no immediate plans to fund 15 of the remaining 17 projects on its 2018‑19 capital outlay list. The Chancellor’s Office indicates that the other two projects could be funded in the budget year with campus funds or other sources. Though not explicitly identified in the Governor’s budget, the administration likely will approve all or almost all of the 27 requested projects later this spring (by the statutory deadline of April 1).
Comments
Legislature Has Key Choices to Make on CSU Costs . . . As with UC, the Legislature faces key decisions each year regarding cost increases at CSU. Typically, the Legislature gives first priority to covering cost increases needed to maintain existing services. At the universities, the largest of these costs relate to compensation and enrollment. After addressing these base issues, the Legislature then typically considers proposals for program expansions or new programs.
. . . And How Those Costs Should Be Covered. After making decisions about which CSU cost increases to support, the Legislature has to decide how to cover those cost increases. In addition to state funding, student tuition constitutes an important source of funding for CSU. Similar to UC, state General Fund and student tuition revenue each makes up roughly half of CSU’s core operating budget. Absent an increase in student tuition revenue, this means that any increase in General Fund support results in an overall increase to CSU’s core budget of about half that amount. For example, a 3 percent General Fund increase equates to about a 1.5 percent overall increase in CSU’s core budget. Though the Legislature could choose to have the state bear the full effect of approved cost increases, it alternatively could consider sharing any cost increases about evenly between the state and nonfinancially needy students. (The state provides full tuition coverage for financially needy students.) Such an approach would recognize the notable public and private benefits of a CSU education.
Key Cost Drivers
Several Key Cost Drivers Affecting CSU’s Budget. To assist the Legislature in setting its CSU funding priorities for the budget year, we assess several key CSU cost drivers below. Specifically, we examine compensation, enrollment, the Graduation Initiative, and facilities. We also analyze the Governor’s proposal for the Education Policy Fellowship Program. Throughout our analysis, we do not assume fundamental changes to the way CSU delivers instruction or runs its operations. If CSU were to find new ways of instructing and operating that substantially reduced costs, these savings could be redirected to funding any desired cost increases.
Compensation
Compensation Is the Largest Component of CSU’s Core Budget. Like other state departments and agencies, salaries and benefits make up a significant share of CSU’s core budget (about 80 percent). Unsurprisingly, compensation also accounts for the largest augmentation in CSU’s spending plan request. The Legislature has several compensation‑related issues to consider.
Board of Trustees, Not the Legislature, Approves CSU Collective Bargaining Agreements. For most departments and agencies in the state, the California Department of Human Resources represents the Governor in labor negotiations between the state and its employees. The resulting agreements must be ratified by the Legislature before going into effect and the state directly funds the associated costs of the agreements. In the case of CSU, state law gives the Board of Trustees authority to negotiate collective bargaining agreements. The Chancellor’s Office represents the Trustees during these negotiations and the resulting agreements must be ratified by the Trustees before going into effect. The Trustees are expected to manage the costs of these agreements within CSU’s overall budget.
Trustees in Process of Finalizing Various Agreements. The CSU system has 13 represented employee groups. The largest group is the California Faculty Association (CFA), which represents more than 25,000 CSU faculty, librarians, counselors, and coaches. In November 2017, the Trustees ratified a contract with CFA that provides a 3.5 percent general salary increase in November 2018, followed by a 2.5 percent increase in July 2019. In January 2018, the Trustees ratified an agreement with CSU’s largest staff union (CSU Employees Union), which represents more than 15,000 employees across four bargaining units. Under the agreement, represented employees receive a 3 percent salary increase retroactive to 2017‑18 and 3 percent increases in both 2018‑19 and 2019‑20. The contract also provides each current full‑time employee with a one‑time $650 bonus (with part‑time employees receiving a pro‑rated bonus). Of the remaining eight bargaining units (which collectively represent less than one‑quarter of CSU employees), two represented groups have contracts in place through the end of 2018‑19 and six are in varying stages of negotiations or ratification by CSU. Taken together, CSU estimates that costs from all these contracts, coupled with a planned 2.5 percent salary increase for nonrepresented employees, would total $122 million in the budget year.
Recent Faculty Salary Increases Outpacing Inflation. The recently ratified CFA contract comes on the heels of a larger expiring agreement with the union. After extensive negotiations (and a near‑strike by union members), in spring 2016 the Trustees ratified a contract through June 30, 2018. Under that agreement, faculty received a cumulative 10.8 percent general salary increase effectively over a two‑year period. Between that contract and the new agreement, faculty will receive a cumulative general salary increase of 17.6 percent between mid‑2016 and mid‑2019. Over that same three‑year time period, inflation (as measured by the California Consumer Price Index) is expected to increase by about 7.5 percent. These annual salary increases generally are higher than what state workers and UC faculty are receiving.
Study Suggests CSU Faculty Salaries Are Generally Competitive With Peer Institutions and Turnover Is Relatively Low. A 2015 analysis commissioned by the Chancellor’s Office found that faculty salaries at CSU (which include tenured/tenure‑track faculty and full‑time lecturers) generally were at or slightly above the average salaries of comparison institutions in other states. Salaries for full professors, however, were about 92 percent of the average salary level at comparison institutions. In addition, the Chancellor’s Office reported that campuses generally have sufficient candidate pools and are successful in making tenure‑track hires. CSU also found that average annual faculty turnover rates are well below the national average. Given that the study was conducted before the Trustees ratified the sizeable new faculty contacts discussed above, current CSU faculty salaries likely are even more competitive with comparison institutions.
Enrollment
CSU on Track to Exceed Enrollment Target for 2017‑18. The 2017‑18 Budget Act set an expectation for CSU to increase resident enrollment by 0.7 percent (an additional 2,487 FTE students) over 2016‑17. Based on preliminary enrollment data, campuses are on track to exceed this target, with fall 2017 FTE student enrollment about 2.7 percent (10,600 FTE students) higher than the previous fall. The Chancellor’s Office is attempting to identify the reasons why growth is coming in so much higher than budgeted. The Chancellor’s Office believes one reason is that existing students are increasing their average unit load as a result of campuses adding course offerings using funds from the Graduation Initiative.
Several Factors for Legislature to Consider in Deciding on Enrollment Growth. The Legislature has at least three key factors to consider when deciding upon a CSU enrollment target:
- Growth in High School Graduates. The number of high school graduates in the state is expected to grow by 1.8 percent in 2017‑18. This means that, all other factors staying the same, enrollment demand for freshman slots in 2018‑19 would increase accordingly. High school graduates in 2018‑19 are projected to decrease slightly (0.4 percent).
- Freshman Eligibility Pool. The state’s most recent eligibility study found that CSU currently is drawing from well beyond its Master Plan target level. Specifically, the study found CSU is drawing from the top 41 percent of high school graduates rather than the top one‑third. Going forward, the Legislature will need to decide whether CSU should be permitted to continue drawing from such a large pool or whether admissions criteria should be tighten to reduce the share of students that are eligible to enroll directly as freshmen.
- Campus and Program Impaction. The past several years CSU has reported denying admission to some freshman and transfer applicants due to campus and program impaction. The nearby box provides background on this issue and recent legislative efforts to better accommodate student applicants.
Impaction—Developing Admissions Prioritization and Redirection Policies
CSU’s Regional Role Established in Practice, Not in Statute. California’s Master Plan and current law do not specifically assign CSU a regional role within the state’s public higher education system. Historically, though, CSU campuses—through their admissions policies and other practices—have tended to focus on enrolling students from surrounding areas. Over the past several years, however, a certain CSU enrollment management practice known as “program impaction” has weakened that regional role.
Program Impaction Limits Access to Place‑Bound Local Applicants. When demand exceeds available enrollment slots, CSU can declare “impaction.” CSU has two types of impaction—campus and program. Under campus impaction, all local students who meet systemwide eligibility requirements are guaranteed admission to the campus. Nonlocal students, however, must meet stricter supplemental criteria. When a campus declares program impaction, by contrast, all applicants must meet supplemental admissions criteria. In other words, impacted programs do not have a local admissions guarantee (though local students typically are awarded extra eligibility points to help make them more competitive). Whereas for decades CSU only had one campus with all programs impacted (San Luis Obispo), today six campuses have declared all (or virtually all) of their programs to be impacted. Program impaction may boost prestige at the campuses (by admitting higher‑performing nonlocal students) but can make it difficult for eligible applicants—some of whom may be place‑bound due to family or other obligations—to attend their local campus.
CSU Required to Develop New Policy on Admissions Prioritization and Redirection. During the last legislative cycle, legislators expressed concern with CSU’s program‑impaction practices. Legislators also expressed a desire for CSU to develop a process whereby all eligible but denied student applications are redirected to nonimpacted campuses or programs. (Currently, CSU only automatically redirects applicants who have an associate degree for transfer, as required by statute.) To address these issues, the 2017‑18 Budget Act contained provisional language directing the Trustees to adopt a new systemwide policy that requires campuses to provide first priority for impacted programs to local students meeting minimum systemwide qualifications. The Trustees also must develop a policy to automatically redirect applications to nonimpacted campuses if a student is denied admission to an impacted program or campus. Both of these policies must be adopted by May 2018. In January 2018, Chancellor’s Office staff presented draft proposals for both new policies. The Trustees are scheduled to vote on final policies at its March 2018 meeting.
Draft Admissions Prioritization Policy Misses the Mark. We believe the Chancellor’s Office’s draft policy on admissions prioritization for local students falls notably short of legislative intent. The draft policy would not provide first priority to local applicants with minimum systemwide qualifications. Instead, the proposal merely requires every impacted program to provide some kind of admissions advantage to local students, which already is the current policy for most impacted programs. Under this draft policy, local students still would be subjected to supplemental admissions criteria.
Redirection Policy Consistent With Legislative Intent. As regards the draft redirection policy, the current proposal appears to be much more in line with legislative intent. Under the policy, students who are not accepted at any of the campuses or programs to which they applied would be given an opportunity to select two nonimpacted campuses or programs to which to have their applications redirected. Upon receiving these alternative choices from a student, CSU would automatically transmit the application. (The draft policy is similar to CSU’s current policy for applicants with an associate degree for transfer who are redirected.)
Recommend Legislature Signal to CSU That Proposed New Impaction Policy for Local Students Is Unsatisfactory. We recommend the Legislature signal to the Chancellor’s Office that the draft admission policy for local students is unacceptable. We recommend the Legislature direct CSU to draft a new policy that is consistent with the provisional language in the 2017‑18 Budget Act. If the Legislature finds that the subsequent draft also fails to meet legislative intent, we recommend it specify in statute the new policy that campuses must follow.
We encourage the Legislature to take into account all of these factors when deciding on an overall enrollment level for CSU in the budget year. In addition, the state could benefit from providing targeted enrollment growth funding for two CSU graduate programs, as described below.
Recommend Legislature Provide Targeted Enrollment Funding to Help Address K‑12 Special Education Staffing Shortages. As we discuss in our companion report, Proposition 98 Education Analysis, California’s schools have experienced a longstanding shortage of special education staff. In addition to several types of special education teachers, certain types of specialists (most notably, occupational therapists and speech and language pathologists) are in particularly short supply. Our review finds that various state and local factors likely contribute to staffing shortages. As regards specialists, the shortage likely is due in part to the high cost of operating preparation programs and the insufficient number of CSU enrollment slots. These factors end up constraining the number of specialists that enter the field each year. To address this issue, we recommend the Legislature provide CSU with targeted enrollment funding to admit more students into its occupational therapy and speech and language pathology graduate programs. We think CSU likely could increase enrollment in these programs by about 5 percent per year (or 45 FTE students in 2018‑19), at a state cost in 2018‑19 of approximately $675,000.
Graduation Initiative
CSU Seeking to Improve Student Graduation Rates. Historically, CSU’s six‑year graduation rates for incoming freshmen have been below 50 percent and its four‑year rates have been below 15 percent. To address its low graduation rates, CSU launched the Graduation Initiative in 2009. CSU has set a goal to increase six‑ and four‑year graduation rates for first‑time freshmen to 70 percent and 40 percent, respectively, by 2025. The Graduation Initiative also seeks to increase graduation rates for transfer students. In addition, CSU has a goal to eliminate differences in graduation rates for several groups of students, including those who are low income and first generation. Figure 26 shows that CSU graduation rates have been increasing steadily over time for both first‑time freshmen and transfer students. Double‑digit achievement gaps, however, persist at CSU. For example, the latest cohort of low‑income students has a 54 percent six‑year graduation rate compared to 64 percent for non‑low‑income students.
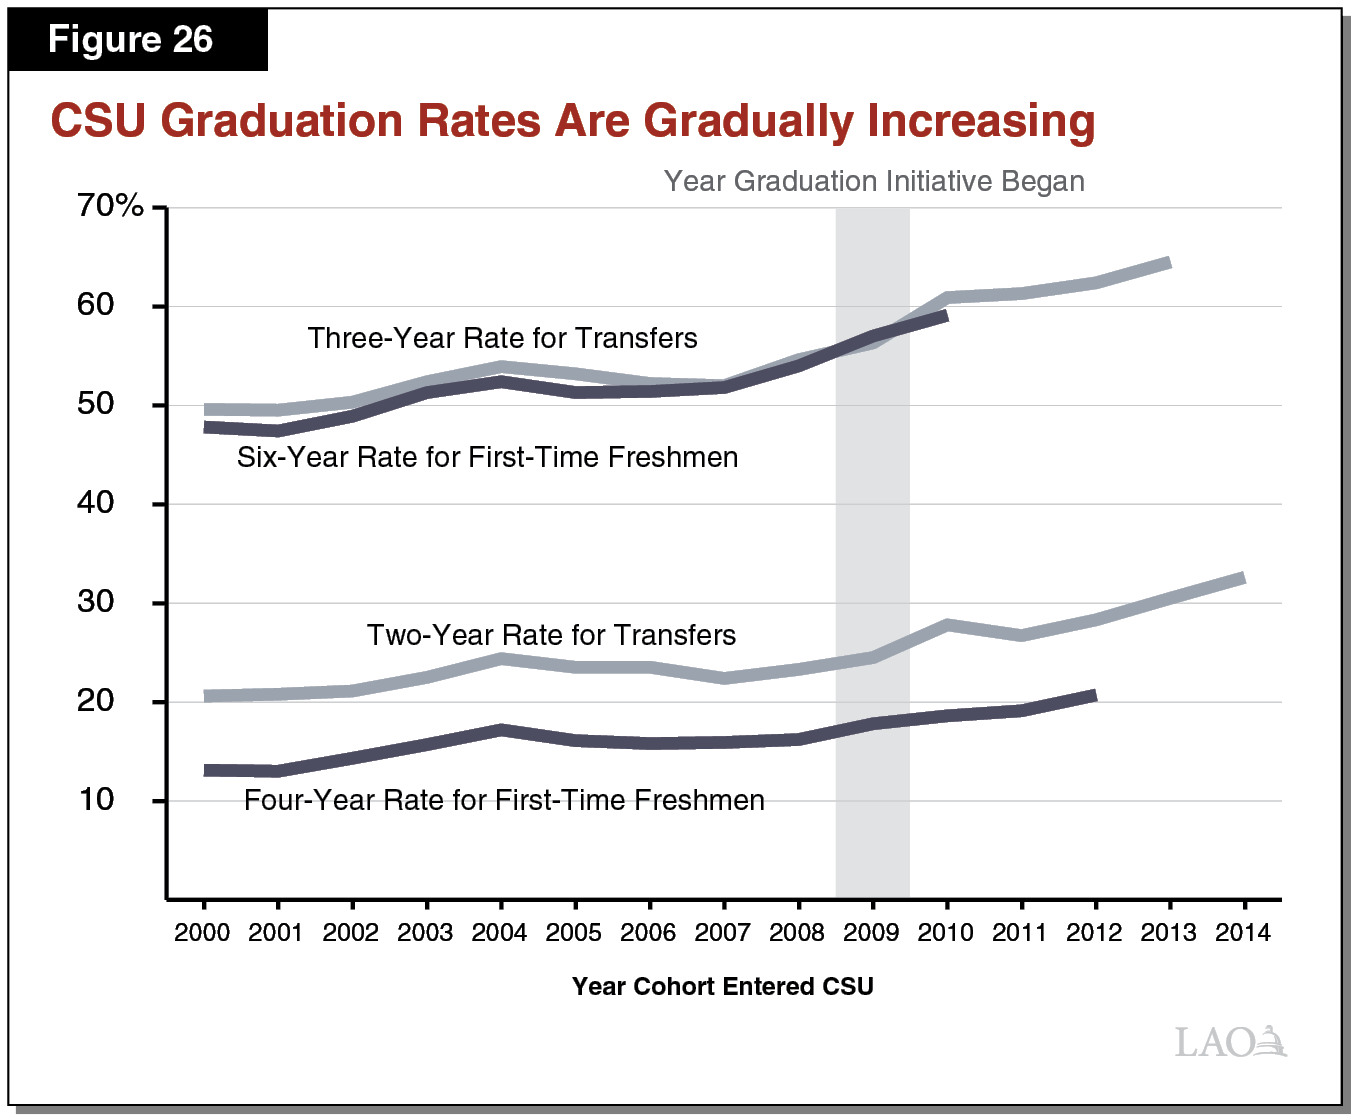
CSU Adding Faculty and Staff to Make More Courses and Support Services Available to Students. Currently, CSU is designating $123 million in ongoing funding to implement the Graduation Initiative. (The current‑year budget also provides CSU with $12.5 million in one‑time monies for the Graduation Initiative.) While the Chancellor’s Office gives campuses flexibility on how to spend this funding, the main use of the funding has been to hire more faculty and advisors to expand course offerings and support services. In a January 2018 report to the Legislature, the Chancellor’s Office estimates that campuses have added about 400 new tenure‑track faculty and more than 1,000 lecturers in the current year using Graduation Initiative funds. These new hires have enabled the system to offer more than 3,200 additional course sections in 2017‑18. CSU also expects to add about 230 academic advisors in 2017‑18, with the goal of reducing campuses’ student‑to‑advisor ratios.
CSU Revising Assessment and Remedial Policies for Incoming Freshmen. Historically, CSU has relied heavily on placement tests to assess students’ college readiness. In recent years, the Legislature has expressed concern with this practice, citing national research that suggests placement tests routinely place students in remedial math and English classes when they could have succeeded in college‑level coursework. A growing amount of research is finding that a better way to assess college readiness is to use multiple measures (including data from students’ high school records). To promote reform at CSU, the 2017‑18 Budget Act includes provisional language requiring the Trustees to adopt by May 2018 new assessment policies that include placing “significant weight” on incoming students’ high school grades in math and English. In August 2017, the Chancellor issued an executive order that requires campuses to discontinue using CSU’s math and English placement tests and instead rely on high school grades and other data (such as Smarter Balanced assessment results and SAT scores) to place students. In addition, the executive order limits the number of remedial (noncredit‑bearing) units that academically underprepared students may be required to take and requires campuses to provide students with academic support (such as targeted tutoring).
CSU Identifies Opportunities to Reduce Excess Unit‑Taking. Students who accrue more units than their degree requires generally take longer to graduate, generate higher costs for the state and themselves, and crowd out other students. Data indicate, however, that CSU continues to have a problem with excess unit‑taking by both freshman entrants and transfer students. In response, the 2017‑18 Budget Act included provisional language requiring CSU to report on opportunities for campuses to make available more course slots by reducing the number of excess units that students earn. In a January 2018 report to the Legislature, the Chancellor’s Office calculated that if every CSU graduate reduced their excess units by 1 unit, CSU could free up 1,333 additional course sections. Using this calculation, reducing excess unit‑taking by half (an average of about 10 semester units per graduate) would be the equivalent of freeing up more than 10,000 course sections—representing about 30,000 FTE students and $250 million in General Fund support for the system. The Chancellor’s Office report cites various ways to reduce excess unit‑taking, including more technology‑enhanced advising (known as “eAdvising” tools).
CSU Could Increase Cross‑Campus Online Enrollment. Another strategy CSU has identified to help achieve its Graduation Initiative targets is expanding online education. Online education—which can make course‑taking more convenient for students while minimizing demands on classroom space—is offered by all but one campus (the Maritime Academy). Another potential benefit of online education is that students can find and get credit for courses offered at other campuses, which can speed their time to graduation. CSU data indicate, however, that very few students currently enroll in online courses at other campuses. This is due in large part to students being unaware that the option exists, as well as CSU’s development of an online course catalog that is very difficult for students to use. Were CSU to streamline the process by which students find, enroll in, and transfer credits back to their home campus, campuses could improve students’ access to needed coursework and reduce their time to degree.
CSU Study Finds Several Potential Areas for Improvement at Campuses. In August 2017, the CSU Student Success Network—a state‑funded systemwide initiative facilitated by the Education Insights Center at California State University, Sacramento—released a report on campuses’ plans and efforts to improve student success. The study notes that campuses are implementing a broad set of programs and practices as part of the Graduation Initiative (including encouraging students to attend full‑time, requiring new students to attend orientation and advising sessions, and increasing internships and on‑campus employment). The study finds, however, that campuses generally lack a systematic approach to integrating these efforts into a cohesive plan. The report also found that campuses generally are in the beginning phases of scaling reform efforts to reach larger numbers of students. Campuses also generally are beginning to think more about allocating existing resources in smarter, more strategic ways (such as consolidating programs or activities).
Recommend CSU Pursue Efficiency Opportunities Before Legislature Further Augments Graduation Initiative. Despite some improvement in CSU’s graduation rates, we believe CSU has significant opportunities to improve efficiencies and more strategically allocate existing resources. In particular, we believe CSU could do more to reduce excess unit‑taking and free up thousands of course sections. We also think CSU could make enrolling in online courses at other campuses much easier for students. Additionally, campuses could focus greater efforts on ensuring their various student‑success strategies are integrated into a coherent and comprehensive plan. Given these opportunities for further reform and given the many other competing cost pressures facing CSU in the budget year, the Legislature may wish to place a lower priority on providing additional funding for the Graduation Initiative in 2018‑19.
Facilities
Under New Process, CSU Authorized to Issue Own Bonds. Historically, the state has sold bonds and paid the associated debt service to fund CSU’s capital outlay program for academic buildings. Beginning in 2014‑15, the state shifted funds for existing debt service on CSU capital outlay projects from a separate budget item to the university’s main General Fund support appropriation. In addition, the state granted CSU the authority to pledge its General Fund appropriation to issue its own bonds to build academic facilities. The university is permitted to repay the associated debt service from its General Fund appropriation. The new process limits the university to spending a maximum of 12 percent of its main General Fund appropriation on debt service and pay‑as‑you‑go academic facility projects. As of January 2017 (the most recent year for which CSU has submitted data to the Legislature), CSU was spending 6.7 percent of its main General Fund appropriation for these purposes.
Administration and Legislature Review Project Proposals. Historically, the state reviewed and approved specific CSU capital outlay projects in the annual budget act. Under the new process, CSU submits a list of capital projects to the Department of Finance for approval. CSU must continue to submit written documentation to the Legislature—commonly referred to as “capital outlay budget change proposals”—that provides detailed information on each project request (including a description of the proposed project, what problem the project is intended to address, the proposed phases to be funded in the budget year and future years, estimated costs and proposed funding sources, and alternatives that CSU considered). Legislative budget subcommittees have an opportunity to review the projects and, by April 1 of each year, signal to the administration whether to approve or reject projects. The Department of Finance must make final project approval decisions by April 1.
Overall, Project Proposals Submitted to the Legislature Have Serious Deficiencies. We reviewed the five 2018‑19 capital outlay budget change proposals that CSU would support using $13 million in base funds as well as the five proposals that CSU has indicated it would fund only if it received an associated $15 million state General Fund augmentation. Figure 27 lists these ten projects. We have four significant concerns with the package of proposals: (1) some proposals provide virtually no documentation, (2) proposals for facility additions or new buildings generally lack data or other information justifying the need for additional space, (3) some of the requests are for previously approved projects that—with little or no explanation—reappear on CSU’s 2018‑19 capital outlay list with scope changes and significantly higher costs, and (4) several proposals are unclear on costs or contain fiscal and other errors. We detail our concerns below.
Figure 27
CSU’s Top 2018‑19 Capital Outlay Prioritiesa
(Dollars in Thousands)
|
Campus |
Project |
2018‑19 |
All Years |
|||
|
Phases |
State Costsb |
State Costsb |
Total Cost |
|||
|
Tier 1 Priorities |
||||||
|
Systemwidec |
Infrastructure improvements |
Various |
$17,264 |
$17,264 |
TBD |
|
|
San Luis Obispo |
New science and agriculture teaching and research complex |
P,W,C,E |
10,000 |
10,000 |
$101,821 |
|
|
Sonoma |
Stevenson Hall renovation and addition |
S,P,W,C |
93,233 |
96,331 |
99,391 |
|
|
East Bay |
Library replacement building |
W,C,E |
79,123 |
81,392 |
90,436 |
|
|
Pomona |
Administration replacement building |
E |
1,380 |
77,926d |
79,306 |
|
|
Subtotals |
($201,000) |
($282,913) |
($370,954) |
|||
|
Tier 2 Priorities |
||||||
|
San Bernardino |
Theater building renovation and addition |
P,W,C |
TBDe |
$97,973 |
$111,102 |
|
|
Northridge |
New Sierra Annex building |
P,W,C |
TBDe |
91,084 |
99,884 |
|
|
San Luis Obispo |
Kennedy Library renovation and addition |
P,W,C,E |
50,000 |
51,296 |
55,000 |
|
|
Channel Islands |
Gateway Hall renovation |
S,P,W,C,E |
38,854 |
38,854 |
42,309 |
|
|
Maritime Academy |
Mayo Hall renovation and addition |
S,P,W,C |
17,548 |
17,548 |
18,294 |
|
|
Subtotals |
($225,000)c |
($296,755) |
($326,589) |
|||
|
Totals |
$426,000 |
$579,668 |
$697,543 |
|||
|
aCSU proposes to fund Tier 1 priorities using $13 million in freed‑up existing funds and Tier 2 priorities only if it receives an additional $15 million General Fund augmentation. bCovered using CSU systemwide revenue bonds, unless otherwise indicated. Reflects amounts as stated in CSU’s 2018‑19 proposals to the Legislature, which in some cases are inconsistent with other CSU documentation. cCSU proposes to finance a package of systemwide infrastructure improvements totaling $67.3 million in 2018‑19. Of this amount, $17.3 million would be funded under Tier 1 and $50 million under Tier 2. dConsists of $26.6 from lease revenue bonds and $51.3 from systemwide revenue bonds. eThe Chancellor’s Office has indicated that it may only proceed with preliminary plans for this project in 2018‑19 but has not made a final decision. P = preliminary plans; W = working drawings; C = construction; E = equipment; S = study; and TBD = to be determined. |
||||||
Some Proposed Projects Have Virtually No Documentation. For example, Maritime Academy’s full proposal for the Mayo Hall renovation and addition project consists of a mere five‑sentence summary description and estimated costs for each project phase. The proposal fails to provide standard information such as why the project is needed, how the project would further the campus’ programmatic goals, and what alternatives (including their associated costs) were considered. Similarly, CSU requests authority to use systemwide revenue bonds to purchase equipment for the Pomona campus’ administrative replacement building. The proposal, however, does not provide a justification as to why new equipment is needed for a replacement building. Moreover, our office requested from CSU the list of equipment proposed for this project, along with an itemized breakout of costs. As of this writing, CSU has not provided the list. Without this information, the Legislature has no way to review whether the equipment request is reasonable.
Proposals for New Buildings or Additions Do Not Justify Need for Additional Space. According to standard budget practice, departments seeking to construct a new building or otherwise add space must provide in their proposals basic information, including current space utilization rates, the specific types and amounts of space requested, and the extent to which the requested new space would alleviate identified constraints or address other problems. Our review of CSU’s six projects that involve requests for new space generally finds a lack of such justification and detail. For example, the proposal for San Luis Obispo’s science and agriculture teaching and research complex indicates that the new facility would provide undergraduate and graduate student research labs, faculty offices, student “interaction space,” and lecture space to accommodate 336 FTE students. The proposal does not include, however, information on what specific size and type of lecture space would be constructed (such as classrooms or large lecture halls), what current utilization rates are for those learning spaces, and why additional faculty offices are needed. Without this data, the Legislature is unable to evaluate the need for this project. Similarly, San Luis Obispo’s Kennedy Library renovation and addition project indicates it would add 566 FTE students in lecture space without providing any further detail.
Previously Approved Capital Projects Reappear on CSU’s 2018‑19 Priority List With Scope Changes and Significantly Higher Costs. Five projects on CSU’s 2018‑19 list were approved by the state as part of the 2017‑18 budget process, but CSU opted not to fund them in the current year. The Chancellor’s Office has resubmitted these projects for approval in 2018‑19. Figure 28 shows that for three of these projects, the proposed scope has changed and total estimated costs are now significantly higher than what the state approved in 2017‑18. Moreover, the proposals generally lack an explanation as to why the projects have changed so significantly in such a short period of time. For example, the Northridge campus’ 2017‑18 proposal for Sierra Hall identifies a renovation—with an estimated cost of $57 million—as “the most cost effective and least disruptive to the University operations and physical environment.” It is unclear why CSU has returned in 2018‑19—just months after the state approved the 2017‑18 renovation project—with a significantly different project proposal (a new building) at a significantly higher cost ($100 million).
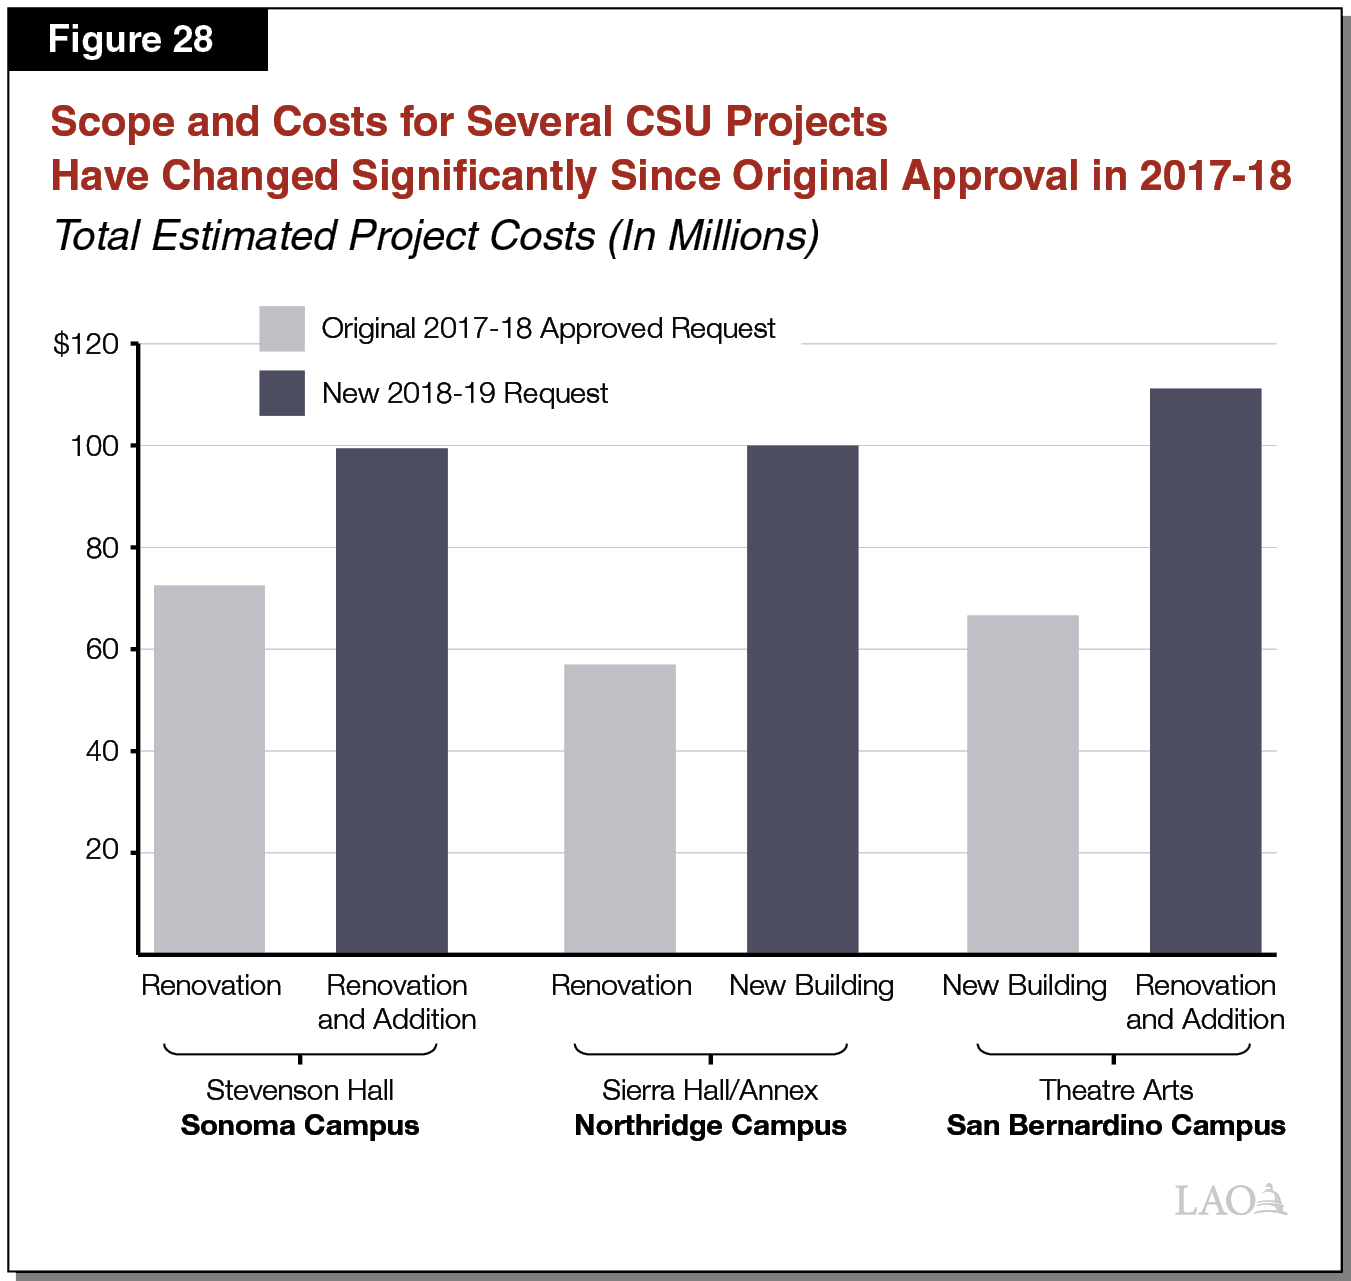
CSU Proposals Suffer From a General Lack of Quality and Clarity. Not only do most proposals lack standard documentation and adequate justification, the little information that is contained in them tends to be unclear and contain errors. This too makes reviewing these proposals difficult for the Legislature. The top page of one proposal that has cost information by phase, for example, is labeled with the name of a different project at the campus. In the “Alternatives” section of San Bernardino’s 2018‑19 theater arts proposal, the proposal appears to prefer a less expensive alternative (a new theater facility that, the proposal states, would “keep the budget to the $60 million range”). Yet, the proposal ends up recommending a $111 million renovation‑and‑addition project. The justification for this preferred solution remains unknown to the Legislature, however, because that section of the proposal is incomplete. In addition, cost‑related information conflicts on certain proposals, which creates further unnecessary confusion for the Legislature in reviewing these proposals. For example, the same San Bernardino proposal states that $6 million in future costs for equipment will be covered by campus funds. CSU’s 2018‑19 capital outlay program, which the Trustees approved in November 2018, however, states that statewide revenue bonds will pay for the equipment. Similarly, in 2017‑18, the state approved CSU’s request for East Bay to use campus funds for preliminary plans on its library project. CSU’s 2018‑19 proposal, however, states that systemwide revenue bonds paid for East Bay’s preliminary plans. As of this writing, the Chancellor’s Office has been unable to clear up these discrepancies.
Recommend Legislature Direct CSU to Resubmit Proposals. Our review has identified varying degrees of problems with virtually all of CSU’s project proposals. We recommend the Legislature direct CSU to rewrite and resubmit its 2018‑19 project requests by early March. Doing so would give the Legislature some time to review these proposals by the April 1 statutory deadline. Should CSU fail to provide an acceptable and compelling set of new proposals in time, we recommend the Legislature remove $13 million from CSU’s base budget and redirect the funds for other legislative priorities.
Recommend Legislature Direct CSU to Include Standard Information in All Future Proposals. Going forward, we recommend the Legislature signal to CSU the importance of submitting complete and accurate project proposals. Each future proposal should provide standard information, including (1) a clear statement of the problem, (2) pros and cons of alternative approaches that were considered (including at least one project involving lower costs), (3) an explanation of why the recommended project is superior to the other available alternatives, (4) any known risks involved with the project, and (5) how the proposed project is linked to CSU’s programmatic needs and the state’s priorities. Renovation project proposals also should specify the deficiencies in the existing building, identify what led to these deficiencies, and state why such deficiencies need to be addressed now. In addition, if a proposal requests authority to add space, it should include what specific type of space is required (and how much space by type) as well as current and projected utilization rates and how those rates compare to legislative standards. In addition, such proposals should include a description of possible strategies the campus could instead use to reduce demand or need for a new facility, including expanding hybrid or fully online courses or increasing facility usage during the summer.
Education Policy Fellowship Program
New Policy Fellowship Program Is Aimed at Professionals Working in the Education Field. Since 2016, CSU’s Center for California Studies (CCS) and the Education Insights Center, which are both housed at the Sacramento campus, have administered the Education Policy Fellowship Program. The purpose of the program is to strengthen the state’s education policymaking process by providing professional development and networking opportunities to working professionals. Program participants include government education analysts, K‑12 and higher education practitioners, researchers, advocates, and other education professionals working throughout the state.
Cohorts of 20 Fellows Convene and Collaborate Throughout the Year. Fellows who are accepted into the program agree to attend three weekend‑long meetings over the course of one year. These meetings typically are held at conference centers or other meeting sites in northern and southern California. At these meetings, fellows learn about and discuss policy issues related to education. Throughout the year, fellows work together on research projects and attend optional local and national meetings. The program’s first cohort of 20 fellows began in 2016‑17. The program is currently in its second year with a new cohort of 20 fellows. CCS and the Education Insights Center intend to begin recruiting a 2018‑19 cohort within a few months. CCS and the Education Insights Center report that a recent survey found that over 75 percent of first‑year fellows rated the program as either above average or excellent.
Most Program Costs Have Been Covered by Foundations. The program’s total annual budget is about $250,000, which covers staff time to administer the program as well as travel, lodging, meals, and other expenses for fellows and meeting facilitators. Since its inception, the program has received the vast majority of its funding from philanthropic organizations (including the William and Flora Hewlett Foundation and College Futures Foundation). Fellows are asked to pay $875 in program fees, which the fellows’ employers typically cover. These fees cover about 5 percent of program costs.
Governor’s Budget Proposal. The Governor proposes to provide $100,000 in ongoing General Fund support for the program. The Governor’s intent is that CCS and the Education Insights Center would continue to seek philanthropic funding to cover most of the remaining annual program costs. Though not explicit in the proposal, our understanding is that program fees would continue to be charged.
Assessment and Recommendation. While we think educational programs such as these can be useful, we do not believe that providing support for a program that serves highly educated working professionals is a sufficiently high state priority in 2018‑19. We also note that the program is very expensive to operate, with an average cost of about $10,000 per fellow—much of which supports travel, lodging, and food costs for the fellows and meeting facilitators. For these reasons, we recommend the Legislature reject the Governor’s proposal.
California Community Colleges
In this section, we first provide an overview of the Governor’s budget for the CCC system. We then describe, assess, and offer recommendations relating to his major CCC proposals. Specifically, we cover his largest proposals—those relating to community college apportionments, enrollment growth, a new online college, and financial aid programs. We also discuss a few other notable proposals—those relating to apprenticeship programs, deferred maintenance, and innovation awards. Lastly, we discuss CCC facility proposals. (We discuss changes in the Proposition 98 minimum guarantee and the Governor’s overall K‑14 spending package in our Proposition 98 Education Analysis.)
Overview
Total CCC Budget Reaches $15.4 Billion Under Governor’s Budget. The largest funding sources for community colleges are Proposition 98 General Fund and property tax revenue (see Figure 29). In addition, the state provides non‑Proposition 98 General Fund for certain purposes, including CCC general obligation bond debt service, teacher retirement costs, and Chancellor’s Office operations. Altogether, these Proposition 98 and non‑Proposition 98 funds comprise about two‑thirds of CCC funding. The remaining one‑third of funding comes primarily from student enrollment fees, other student fees (such as nonresident tuition, parking fees, and health services fees), and various local sources, including community service programs and facility rentals.
Figure 29
California Community Colleges Funding by Source
(Dollars in Millions Except for Funding Per Student)
|
2016‑17 Actual |
2017‑18 Revised |
2018‑19 Proposed |
Change From 2017‑18 |
||
|
Amount |
Percent |
||||
|
Proposition 98 |
|||||
|
General Funda |
$5,473 |
$5,682 |
$6,066 |
$384 |
6.8% |
|
Local property tax |
2,809 |
2,972 |
3,141 |
169 |
5.7 |
|
Subtotals |
($8,283) |
($8,654) |
($9,207) |
($553) |
(6.4%) |
|
Other State |
|||||
|
Other General Fund |
$404 |
$469 |
$509 |
$40 |
8.6% |
|
Lottery |
233 |
231 |
231 |
— |
‑0.1 |
|
Special funds |
141 |
146 |
152 |
6 |
4.3% |
|
Subtotals |
($777) |
($846) |
($892) |
($46) |
(5.5%) |
|
Other Local |
|||||
|
Enrollment fees |
$458 |
$459 |
$413 |
‑$45 |
‑9.9% |
|
Other local revenueb |
4,538 |
4,537 |
4,553 |
16 |
0.3 |
|
Subtotals |
($4,997) |
($4,995) |
($4,966) |
(‑$29) |
(‑0.6%) |
|
Federal |
$285 |
$285 |
$285 |
— |
— |
|
Totals |
$14,342 |
$14,780 |
$15,350 |
$570 |
3.9% |
|
Full‑Time Equivalent (FTE) Students |
1,134,809 |
1,135,081 |
1,136,813 |
1,732 |
0.2% |
|
Proposition 98 Funding Per FTE Student |
$7,299 |
$7,624 |
$8,099 |
$475 |
6.2% |
|
Total Funding Per FTE Student |
$12,638 |
$13,021 |
$13,503 |
$481 |
3.7% |
|
aIncludes between $500 million and $526 million each year for the Adult Education Block Grant, of which more than $400 million goes to school districts for their adult education services. bPrimarily consists of revenue from student fees (other than enrollment fees), sales and services, and grants and contracts, as well as local debt‑service payments. Amounts are estimates and do not include federal and state student financial aid for nontuition costs or bond proceeds for capital outlay. |
|||||
Governor Proposes to Increase Proposition 98 Funding by $553 Million (6.4 Percent) Over Revised 2017‑18 Level. As Figure 30 shows, the Governor’s budget increases Proposition 98 funding for the community colleges to $9.2 billion in 2018‑19. Most notably, the budget includes $212 million for a new high school career technical education (CTE) initiative, $175 million for transition to a new funding formula, $161 million for an apportionment COLA, $120 million for a new online community college, and $81 million for deferred maintenance and instructional equipment. In addition to the deferred maintenance funding listed in the figure, the Governor’s budget package includes $195 million in other one‑time funding for deferred maintenance, bringing total funding to $275 million. We discuss the proposed high school CTE initiative in our Proposition 98 Education Analysis. We discuss all others proposals later in this next section.
Figure 30
California Community Colleges Proposition 98 Spending Changes
(In Millions)
|
2017‑18 Revised Spending |
$8,654 |
|
Technical Adjustments |
|
|
Remove one‑time spending |
‑$380 |
|
Other technical adjustments |
‑59 |
|
Subtotal |
(‑$439) |
|
Policy Adjustments |
|
|
Fund high school CTE initiative through Strong Workforce program |
$212 |
|
Hold districts harmless for transition to new apportionment funding formula |
175 |
|
Provide 2.51 percent COLA for apportionments |
161 |
|
Fund new online college ($100 million one time, $20 million ongoing) |
120 |
|
Fund deferred maintenance and instructional materials (one time)a |
81 |
|
Fund 1 percent enrollment growth |
60 |
|
Fund AB 19 fee waivers for first‑time full‑time students |
46 |
|
Fund consolidated financial aid program |
33 |
|
Provide 2.51 percent COLA for selected student support programsb |
33 |
|
Provide additional funding for prior‑year Apprenticeship costs (one time) |
31 |
|
Fund Innovation Awards (one time) |
20 |
|
Increase funding for Apprenticeship Programs |
14 |
|
Fund adult education data system alignment |
5 |
|
Fund certified nursing assistant program (one time) |
2 |
|
Subtotal |
($992) |
|
Total Changes |
$553 |
|
2018‑19 Proposed Proposition 98 Spending |
$9,207 |
|
aBudget appropriates a total of $275 million for this purpose, including $184 million in 2017‑18 funds and $11 million in settle‑up funds. bApplies to Apprenticeship Programs, Extended Opportunity Programs and Services, Disabled Students Programs and Services, CalWORKs student services, Mandates Block Grant, and campus child care support. Includes a 4.1 percent COLA for the Adult Education Block Grant. CTE = career technical education and COLA = cost‑of‑living adjustment. |
|
No Proposed Change to Enrollment Fee, Many Students Have Fee Waived. State law currently sets the CCC enrollment fee at $46 per unit (or $1,380 for a full‑time student taking 30 semester units per year). The Governor proposes no change to this fee, which has remained flat since 2011‑12. The Board of Governors Fee Waiver (recently named the California College Promise Grant) waives enrollment fees for about half of students, accounting for two‑thirds of credit units taken at the community colleges. In 2018‑19, grants for financially needy students are estimated to cost a total of $758 million. Beginning in 2018‑19, the state is set to expand the fee waiver program to students who do not demonstrate financial need. The program, known as AB 19 after its authorizing legislation, provides funding and allows, but does not require, colleges to offer fee waivers for all resident first‑time, full‑time students during their first year of college. We discuss this proposal later in this section.
Apportionments
Below, we provide background on community college apportionment funding, describe the Governor’s major apportionments proposals, analyze those proposals, and offer associated recommendations.
Background: Community College Funding
Apportionment Funding Comprises Almost Three‑Fourths of CCC Proposition 98 Funding. Community college districts primarily receive their revenues through general purpose apportionment funding. The 2017‑18 budget includes $6.2 billion for apportionments, representing 72 percent of all Proposition 98 CCC funding.
Current Apportionment Formula Allocates Funding to Districts Based on Student Enrollment. Apportionment funding is allocated primarily based on per‑student rates. In 2017‑18, community colleges received $5,151 per credit and enhanced noncredit FTE student and $3,050 per regular noncredit FTE student. (Enhanced noncredit instruction consists of courses relating to career development and college preparation. Instruction includes some basic skills courses, English as a Second Language courses, and CTE courses.) The state allows districts to claim the higher of their current‑year or prior‑year enrollment levels—effectively a one‑year hold harmless provision. District apportionments also include a base allocation determined by the number of colleges, state‑approved centers, and total enrollment in the district.
Colleges Must Spend Half of Apportionment Funding on Instruction. Current law requires districts to spend at least 50 percent of their general operating budget on salaries and benefits of faculty and instructional aides engaged in direct instruction. Spending on other instruction‑related staff, such as academic counselors and librarians, is not counted as instructional costs. Costs for staff that provide services such as campus safety, facilities maintenance, and information technology services also are excluded, as are operating costs for such things as insurance and utilities. Districts that fall below the 50 percent mark can be subject to financial penalties by the Board of Governors.
Remaining CCC Funding Is Provided Through Restricted Categorical Programs. Each of these categorical programs has its own allocation formula and associated restrictions and spending requirements. The largest categorical program, the Adult Education Block Grant, distributes $500 million to consortia of community colleges and school districts that decide how funds are to be used to serve adult learners in their areas. The next two largest categorical programs are the Student Success and Support Program (SSSP), which received $306 million in 2017‑18, and the Strong Workforce Program, which received $248 million. The SSSP provides various orientation and counseling services. The Strong Workforce Program requires consortia of community college districts to develop and operate workforce programs based on their regional labor markets.
Many Categorical Programs Designed to Help Low‑Income and Less‑Prepared Students. Several notable categorical programs are targeted for students that historically have had less success at the community colleges. For example, the state provides $160 million for colleges to develop student equity plans that analyze and identify strategies for closing enrollment and achievement gaps among historically underrepresented groups. The state also provides $117 million for Extended Opportunity Programs and Services, which provides supplemental services for low‑income and academically underprepared students. In addition, the state provides $45 million for the CalWORKs Student Services program, which provides child care, career counseling, subsidized employment, and other supplemental services to community college students receiving CalWORKs assistance. These services are in addition to those provided to all CalWORKs recipients by county welfare departments.
Districts Required to Develop Educational Master Plans. Every community college district is required to adopt an educational master plan and submit the plan for approval to the Chancellor’s Office. The exact content of the plan is determined by the local governing board but commonly consists of a profile of the district, the core values of the district, overarching district goals, and measures to track progress towards meeting those goals. Although statute does not specify how frequently plans must be updated, districts typically update plans every 3 to 5 years.
Background: Student Success Efforts
Several Recent Initiatives Undertaken to Improve Student Outcomes. Although the CCC system provides open access to anyone interested in improving their education, it historically has had low levels of student persistence and completion as well as sizeable achievement gaps. Over the last several years, the state has adopted many initiatives to address concerns regarding these poor CCC outcomes. Some of these initiatives have been larger comprehensive reforms, while others address specific issues. The next six paragraphs highlight major student success initiatives.
Student Success Task Force. Chapter 409 of 2010 (SB 1143, Liu) directed the Board of Governors to adopt and implement a comprehensive plan for improving student outcomes. To help develop the improvement plan, the legislation required the board to create a task force. In 2011, the Student Success Task Force released a report containing 22 recommendations designed to improve student outcomes. Some of the task force recommendations required state policy and budget actions, some required new regulations, and others involved individual colleges taking certain actions, such as disseminating best practices.
Student Success Act. Chapter 624 of 2012 (SB 1456, Lowenthal) codified four key recommendations from the task force report. Specifically, Chapter 624: (1) required the Board of Governors to establish policies around mandatory assessment, orientation, and education planning for incoming students; (2) authorized the board to set a time or unit limit for students to declare a major or other specific educational goal; (3) authorized the board to establish minimum academic standards for financially needy students who receive enrollment fee waivers; and (4) established requirements for colleges to have SSSP and student equity plans.
Transfer Reform. In an attempt to reform the transfer pipeline from CCC to the CSU system, the state enacted Chapter 428 of 2010 (SB 1440, Padilla). The legislation required community colleges to create two‑year (60 unit) degrees known as associate degrees for transfer (ADT) that are fully transferable to CSU. These degrees require students to complete (1) an approved set of general education requirements and (2) a minimum of 18 units in a major or area of emphasis. Though students with an ADT are not guaranteed admission to a particular CSU campus or into a particular degree program, they receive priority admission to a CSU program that is “similar” to their major or area of emphasis. Once admitted, students need only to complete two additional years (an additional 60 units) of coursework to earn a bachelor’s degree.
Basic Skills Reform. For the past decade, the state has provided a mix of one‑time and ongoing funding for colleges to transform how they serve students who are not prepared for college‑level math or English courses. Beginning in 2015‑16, colleges were encouraged to adopt various evidence‑based strategies to improve student outcomes. These strategies include (1) using multiple measures (including high school course taking and grades) to determine student placement and (2) compressing remedial course sequences to get students into college‑level courses more quickly. In the fall of 2017, the state enacted Chapter 745 of 2017 (AB 705, Irwin), which prohibits a college from placing students into remedial coursework unless placement research indicates they otherwise would be unlikely to succeed in college‑level coursework.
Institutional Effectiveness. Established in 2014‑15, this ongoing initiative provides technical assistance and professional development to colleges seeking to improve student outcomes and overall operations. The Chancellor’s Office oversees the initiative and contracts with two districts (Santa Clarita Community College District and Chabot‑Las Positas Community College District) to coordinate teams of CCC experts to consult with campuses, organize regional workshops, and perform other activities. To help identify institutions that may need assistance, the Chancellor’s Office has developed a set of effectiveness indicators. Statute requires colleges to develop, adopt, and publicly post goals and actual results each year using these indicators.
Guided Pathways. The 2017‑18 budget provided $150 million one‑time Proposition 98 funding to help colleges implement guided pathways, an initiative that provides comprehensive support for students to improve student outcomes. Four key elements of guided pathways are (1) academic program maps (which set forth course sequences required to achieve specified educational objectives), (2) an intake process that helps students clarify their college and career goals as well as develop an academic plan, (3) proactive support services aligned with student progress, and (4) institutional and program‑specific student learning expectations.
Recent Initiatives Have Tied Funding to Specific Activities. To implement the variety of initiatives listed above, the state has increased categorical funding for specified activities intended to improve student outcomes. For example, the state has increased funding for the SSSP and student equity plans by $417 million over the last five years to encourage districts to increase support services for students. The state also has provided one‑time funding for implementing guided pathways and basic skills reforms. In many cases, funding was not distributed to all districts statewide but instead was available only to districts that agreed to implement specific changes.
Board of Governors Recently Adopted Vision for Success. In July 2017, the Board of Governors adopted the Vision for Success, a document that sets specific goals in a number of key student performance areas and identifies key commitments of the Chancellor’s Office to assist colleges in meeting those goals. The document was developed in collaboration with community college leaders and stakeholders across the state. Specifically, the Vision for Success sets goals in six areas: (1) number of degrees, certificates, and credentials issued; (2) transfers to UC and CSU; (3) number of units accrued upon associate degree completion; (4) employment in a related field; (5) equity gaps among student groups; and (6) achievement gaps among regions in the state. The goals set in the Vision for Success generally are aligned to the goals of the Legislature in improving the CCC system.
Modest Improvements in Student Outcomes in Recent Years. Using the most recent data available, community colleges have made little progress with respect to program completion. The six‑year completion rate for the most recent cohort (students who began college in 2010‑11) is 48 percent, 1 percentage point lower than the completion rate for the 2006‑07 cohort (49 percent). Statewide performance, however, has improved in several other areas. For example, the most recent data show modest improvements in the proportion of students who complete a college‑level course after being initially placed in remedial classes, complete a transfer‑level math or English course within their first two years, and complete 30 units of coursework within six years.
Governor’s Proposals
Increases Apportionment Funding by $396 Million. Of the total increase, $175 million is for holding districts harmless for the shift to a new funding formula, $161 million is for a 2.51 percent apportionment COLA, and $60 million is for 1 percent enrollment growth. We analyze the new funding formula below, then turn to the enrollment growth proposal.
Creates New Apportionment Formula Based on Three Components. The Governor proposes moving away from the almost entirely enrollment‑based apportionment funding model to one that not only accounts for overall enrollment but also accounts for low‑income student enrollment and student performance. The Governor has two main objectives in proposing the new formula. He wants to (1) place less emphasis on seat time and more on program completion and (2) place more emphasis on the additional cost entailed in serving low‑income students. As Figure 31 shows, the new formula would include three components: (1) enrollment‑based funding, (2) funding based on a district’s number of low‑income students, and (3) performance‑based funding. The administration proposes using current‑year data for calculating the enrollment‑based component of the formula and prior‑year data for calculating the other two components.
Figure 31
Components of Proposed Funding Formula
|
Base Grant ($3.2 Billion) |
|
|
|
|
Supplemental Grant ($1.6 Billion) |
|
|
|
Student Success Incentive Grant ($1.6 Billion) |
|
|
|
Includes Hold Harmless Provision for Per‑Student Funding. The Governor’s proposal includes a hold harmless provision relating to overall per‑student apportionment funding. For 2018‑19 only, districts would receive the greater of (1) the amount calculated based on the new funding formula or (2) the amount of apportionment funding they received in 2017‑18. For 2019‑20 and future years, districts would receive the greater of (1) the amount calculated based on the new funding formula or (2) the district’s FTE enrollment in that year multiplied by its 2017‑18 per‑student funding rate. That is, the hold harmless would ensure districts received no less on a per‑student basis than they did in 2017‑18.
Includes Hold Harmless for Supplemental and Performance Funding. The proposal also includes separate hold harmless provisions for each of the two elements of the supplemental grant and three elements of the performance grant. Specifically, if the amount calculated for any element of these grants is lower than the amount the district received in the previous year, the district would receive the amount calculated the previous year. These adjustments essentially provide districts with a one‑year delay in reductions related to these elements of the formula.
Includes Planning Requirements. As a condition of receiving supplemental and performance grants, districts would be required to align the goals in their educational master plans with the systemwide goals set forth in the Vision for Success. Districts also would be required to measure progress towards meeting those goals. In addition, districts would be required to align their budgets to their revised master plans by a date that would be determined by the Chancellor’s Office.
Requires Low‑Performing Districts to Receive Technical Assistance. If a district is identified as needing assistance to make progress towards meeting its goals, the Chancellor’s Office could require a district to use up to 3 percent of its apportionment funding for technical assistance and training.
Requires Chancellor’s Office to Monitor Implementation. The Governor’s proposal requires the Chancellor’s Office to develop processes to monitor the implementation of the funding formula. Perhaps most importantly, the Chancellor’s Office is required to develop minimum standards for the types of certificates and awards that count towards the performance grant.
Requires Chancellor’s Office to Report on Progress in Meeting Vision for Success Goals. The proposal also requires the Chancellor’s Office to submit a report to the Legislature and Department of Finance by July 1, 2022 on the progress colleges have made in advancing the Vision for Success goals. The report also is to include an overview of any technical assistance or other actions the Chancellor’s Office has taken to help districts improve outcomes for historically underrepresented populations.
Tasks Chancellor’s Office With Developing Proposal to Consolidate Categorical Programs. In the Governor’s Budget Summary, the administration states its expectation that the Chancellor’s Office consult with stakeholders over the next few months to develop a proposal to consolidate existing categorical programs and provide greater flexibility for districts. The proposal would be submitted for possible consideration in the May Revision.
Assessment
Current Enrollment‑Based Funding Approach Has Certain Drawbacks. The state has used an enrollment‑based funding formula in part because it is simple to administer and generally tracks with district costs. Such a funding model, however, has several key drawbacks. The model does not have incentives for colleges to ensure students meet their educational goals and finish with a certificate or degree in a timely manner. An enrollment‑based approach also discourages districts from adopting innovative approaches that help students if such changes result in fewer units taken. For example, districts are unlikely to implement competency‑based programs, which require upfront spending and typically result in fewer units taken, as they would receive less funding.
Performance‑Based Funding Would Tie More Funding to Legislature’s Goals for System. The Legislature has implemented a variety of initiatives over the last several years with the ultimate goal of increasing the number of CCC students attaining a degree or certificate, decreasing time to completion, and better serving low‑income students. These goals are very similar to the measures the Governor proposes to use for the performance component of the new formula. Allocating some funding based on performance could help expedite progress in core areas and further strengthen districts’ fiscal incentives to improve student outcomes.
Many States Have Some Type of Performance‑Based Funding Formula. More than 30 states have at least a portion of their higher education funding allocated based on performance. State funding formulas, however, have notable differences. The portion of funding tied to performance varies significantly, from less than 1 percent to almost 100 percent. The types of measures used and weight given to each measure also vary. Some states, for example, include interim performance measures, such as persistence rates and remedial‑course completion rates, whereas other states focus only on final performance results, such as degree completion. Some states also provide greater weight to outcome measures for low‑income students and other historically underrepresented groups or for high‑priority areas such as CTE.
Nationwide Research Finds Performance‑Based Formulas Can Change Institutional Behavior. Whereas enrollment‑based formulas encourage colleges to increase enrollment, research finds that performance‑based formulas affect institutional behavior in other ways. In states switching from enrollment‑ to performance‑based funding formulas, the switch was found to correlate with colleges adopting basic skills reforms, improving course articulation and transfer, increasing the number of academic advisors, providing additional support for students at risk of dropping out, and increasing availability of tutoring and supplemental instruction. In many cases, these institutional changes were being made as other statewide reforms in these areas were being implemented, such that isolating the effect of the performance‑based formula is challenging. In addition, despite encouraging these types of institutional changes, studies to date have not found improvements in student performance after shifting to performance‑based funding.
Proposed Formula Has Several Key Incentive Problems. Several components of the Governor’s performance‑based funding formula raise concerns. In particular, the proposal does not provide additional incentives for colleges to help low‑income students complete a certificate or degree. Although the formula creates an incentive to enroll low‑income students, it does not create incentives for colleges to help these students reach their educational goals. Additionally, by providing the same amount of outcome‑based funding for any degree or certificate, the proposal creates incentives for colleges to offer shorter, less expensive programs that lead to a degree or certificate. This could discourage colleges from offering more expensive CTE programs. Research on performance‑based funding models also identifies concerns related to the possibility of weakening academic standards. Specifically, a formula based on performance could create incentives for faculty to inflate grades to ensure student completion.
Hold Harmless Provisions May Dampen Effect of Shifting to Performance‑Based Formula. By incorporating several hold harmless provisions, the Governor’s proposal provides stability during the transition to a new formula. Such stability, however, could diminish the changes in behavior that the administration is hoping will occur. In particular, districts whose allocations under the new funding formula are far below their hold harmless levels would have no financial incentives to focus on improving student outcomes.
Supplemental Funding and Many Categorical Programs Serve Same Purposes. The Governor’s proposal distributes a quarter of apportionment funding based on the number of low‑income students. This component of the formula acknowledges the higher costs involved in serving low‑income students (who are less likely to be prepared for college‑level coursework, less likely to persist, and less likely to complete their programs). Acknowledging these higher costs and responding to these issues is the same rationale underlying many existing categorical programs. How the supplemental grant under the Governor’s proposal would complement existing programs is unclear, as is the rationale for having both types of grants. Moreover, the structure of the supplemental grant is very different than the structure of existing student support grants, with the Governor’s proposed grant having no restrictions or reporting requirements and the existing grants typically having many restrictions and reporting rules.
Recommendations
Allocate Less Funding Based on Enrollment. Given the concerns with poor incentives created by the enrollment‑based funding model, we recommend the Legislature consider reducing the share of CCC apportionment funding that is based on enrollment. We think the Governor’s proposal to allocate about half of apportionment funding based on enrollment seems reasonable.
Allocate Some Funding Based on Performance. In tandem with allocating less funding based on enrollment, we recommend the Legislature consider allocating some portion based on performance. To ensure sufficiently strong incentives to focus on performance, we recommend basing at least 20 percent of CCC funding on student outcomes. A larger share of funding based on performance likely would produce greater changes in institutional behavior. We think the Governor’s proposed performance measures (program awards, three‑year completion rates, and associate degrees for transfer) are reasonable. We recommend, however, providing higher levels of funding for the outcomes of low‑income students and expensive programs the Legislature considers a high priority (such as some CTE programs). These adjustments would help ensure colleges focus on improving outcomes for low‑income students and maintain expensive programs that serve student needs.
Consider Supplemental Funding and Categorical Programs Together. Given the supplemental grant component of the Governor’s proposal and many existing CCC categorical programs are intended to benefit low‑income students, we recommend the Legislature consider these pots of funding in tandem. We recommend the Legislature collapse these fund streams into one larger pot of funding intended to benefit these students. In doing so, one critical decision for the Legislature would be determining how much funding to provide for this purpose. Another key decision would be what spending requirements, if any, to place on this pot of funding (discussed below).
Recommend Coupling Planning With Flexibility in Serving Low‑Income Students. Given our recommendation that the new funding model provide greater weight to outcomes for low‑income students, we further recommend attaching few strings to the supplemental pot of funding. We think colleges could benefit from having flexibility in deciding exactly how best to serve these students. The Legislature could require districts, however, to document clearly in their annual budgets how they intend to serve low‑income students. Additionally, the Chancellor’s Office could monitor and report the performance of low‑income students by college and offer institutional effectiveness support when colleges do not meet their goals.
Monitor Implementation to Determine if Negative Outcomes Emerge. Consistent with the Governor’s proposal, we recommend the Legislature task the Chancellor’s Office with monitoring key aspects of implementation to identify if any problematic trends result from using the new funding model. In addition to monitoring the approval of new program awards (to ensure minimum standards are met), we recommend requiring the Chancellor’s Office to also monitor data related to grades (to monitor for grade inflation) and changes in the types of degree and certificates awarded (to ensure districts do not shift to cheaper and lower‑value certificates as a way to maximize funding). Tracking this information would help inform future legislative decisions regarding if the funding model should be modified or new laws should be passed to prevent these problems from reoccurring.
Enrollment
Below, we provide background on CCC enrollment funding, describe the Governor’s enrollment proposals, and provide our assessment of those proposals.
Background
State Considers Several Factors When Making CCC Systemwide Enrollment Decision. Each year, the state projects enrollment growth systemwide based on population changes, the economy (specifically, an add‑on if the unemployment rate is high), and prior‑year enrollment demand. It then examines whether any districts have experienced recent enrollment declines or “restorations.” After one year of enrollment decline, the state lowers base funding for the affected districts but gives those districts three years to earn back (restore) funding. Each year, some of these districts earn restoration funding. Technically, districts receive restoration funding first, then any new enrollment growth funding.
Chancellor’s Office Sets Enrollment Growth Target for Each District. After the state sets the overall CCC enrollment target, the Chancellor’s Office sets an enrollment target for each district. A few years ago (as part of the 2014‑15 budget package), the Chancellor’s Office was tasked with developing a new district allocation formula. The purpose of the new formula is to direct a larger share of enrollment funding to high‑need districts. Whereas previous district allocations largely were based on year‑to‑year changes in the local high school graduation and adult population rates, the new formula instead considers local educational attainment, unemployment, and poverty rates, as well as recent enrollment trends.
Governor’s Proposals
Reduces Enrollment Funding in Prior and Current Years to Reflect Updated Data. The Governor’s budget package reduces enrollment funding by $73.7 million in 2016‑17 and $17 million in 2017‑18 to account for the latest enrollment estimates provided by the colleges.
Funds Enrollment Growth for 2018‑19. After adjusting base funding, the Governor proposes $60 million for 1 percent CCC enrollment growth (an additional 11,300 FTE students). The Governor’s budget also makes adjustments for districts experiencing enrollment declines and restorations. Altogether, the Governor’s budget funds a net increase of 0.2 percent (about 1,700 FTE students) compared to the revised 2017‑18 level.
Assessment
Systemwide, CCC Continues to Fall Short of Meeting Enrollment Targets. Over the last three years, actual enrollment growth has been consistently lower than the amount assumed in the state budget. For example, while the 2015‑16 Budget Act assumed net enrollment growth of 2.2 percent, actual net enrollment growth was 0.8 percent. Similarly, the 2016‑17 Budget Act assumed 1.6 percent net enrollment growth, while actual enrollment declined 0.2 percent. The Governor’s budget also reduces his net enrollment growth estimate for 2017‑18—from 0.2 percent to being virtually flat. Given these enrollment trends, the CCC system is unlikely to need enrollment growth funding in 2018‑19.
Use Updated Information in May to Make Final Enrollment Decisions. By the time of the May Revision, the Chancellor’s Office will have received updated 2017‑18 attendance reports from districts. These data will show the extent to which districts are meeting, exceeding, or falling short of their enrollment targets in the current year. At that time, the Legislature will have better information to assess the extent to which colleges will use the 2017‑18 enrollment growth funds and be able to grow in the budget year. If the Legislature decides the full amounts are not justified for the current and budget years, it could use any associated freed‑up funds for other Proposition 98 priorities.
Online Community College
Below, we provide background on the state’s efforts to provide online instruction at the community colleges, describe the Governor’s proposal to create a new online college, provide an assessment of that proposal, and lay out some issues for the Legislature to consider in evaluating it.
Background
Community Colleges Systemwide Provide 13 Percent of Instruction Online. As Figure 32 shows, 13 percent of 2016‑17 instruction occurred in online courses. (CCC defines an online course as one in which more than half of instruction is online.) The vast majority of these courses are conducted asynchronously—that is, an instructor provides online course sessions that students can access any hour of the day. A small share of online courses (about 1 percent of all instruction) is provided synchronously, meaning that faculty and students communicate with each other in real time. The share of instruction provided online has increased notably in the last ten years, increasing from 5 percent in 2006‑07. Although some colleges run fully online degree or certificate programs (48 colleges report offering at least one fully online program), community college students typically take the bulk of their courses in person and a minority of courses online.
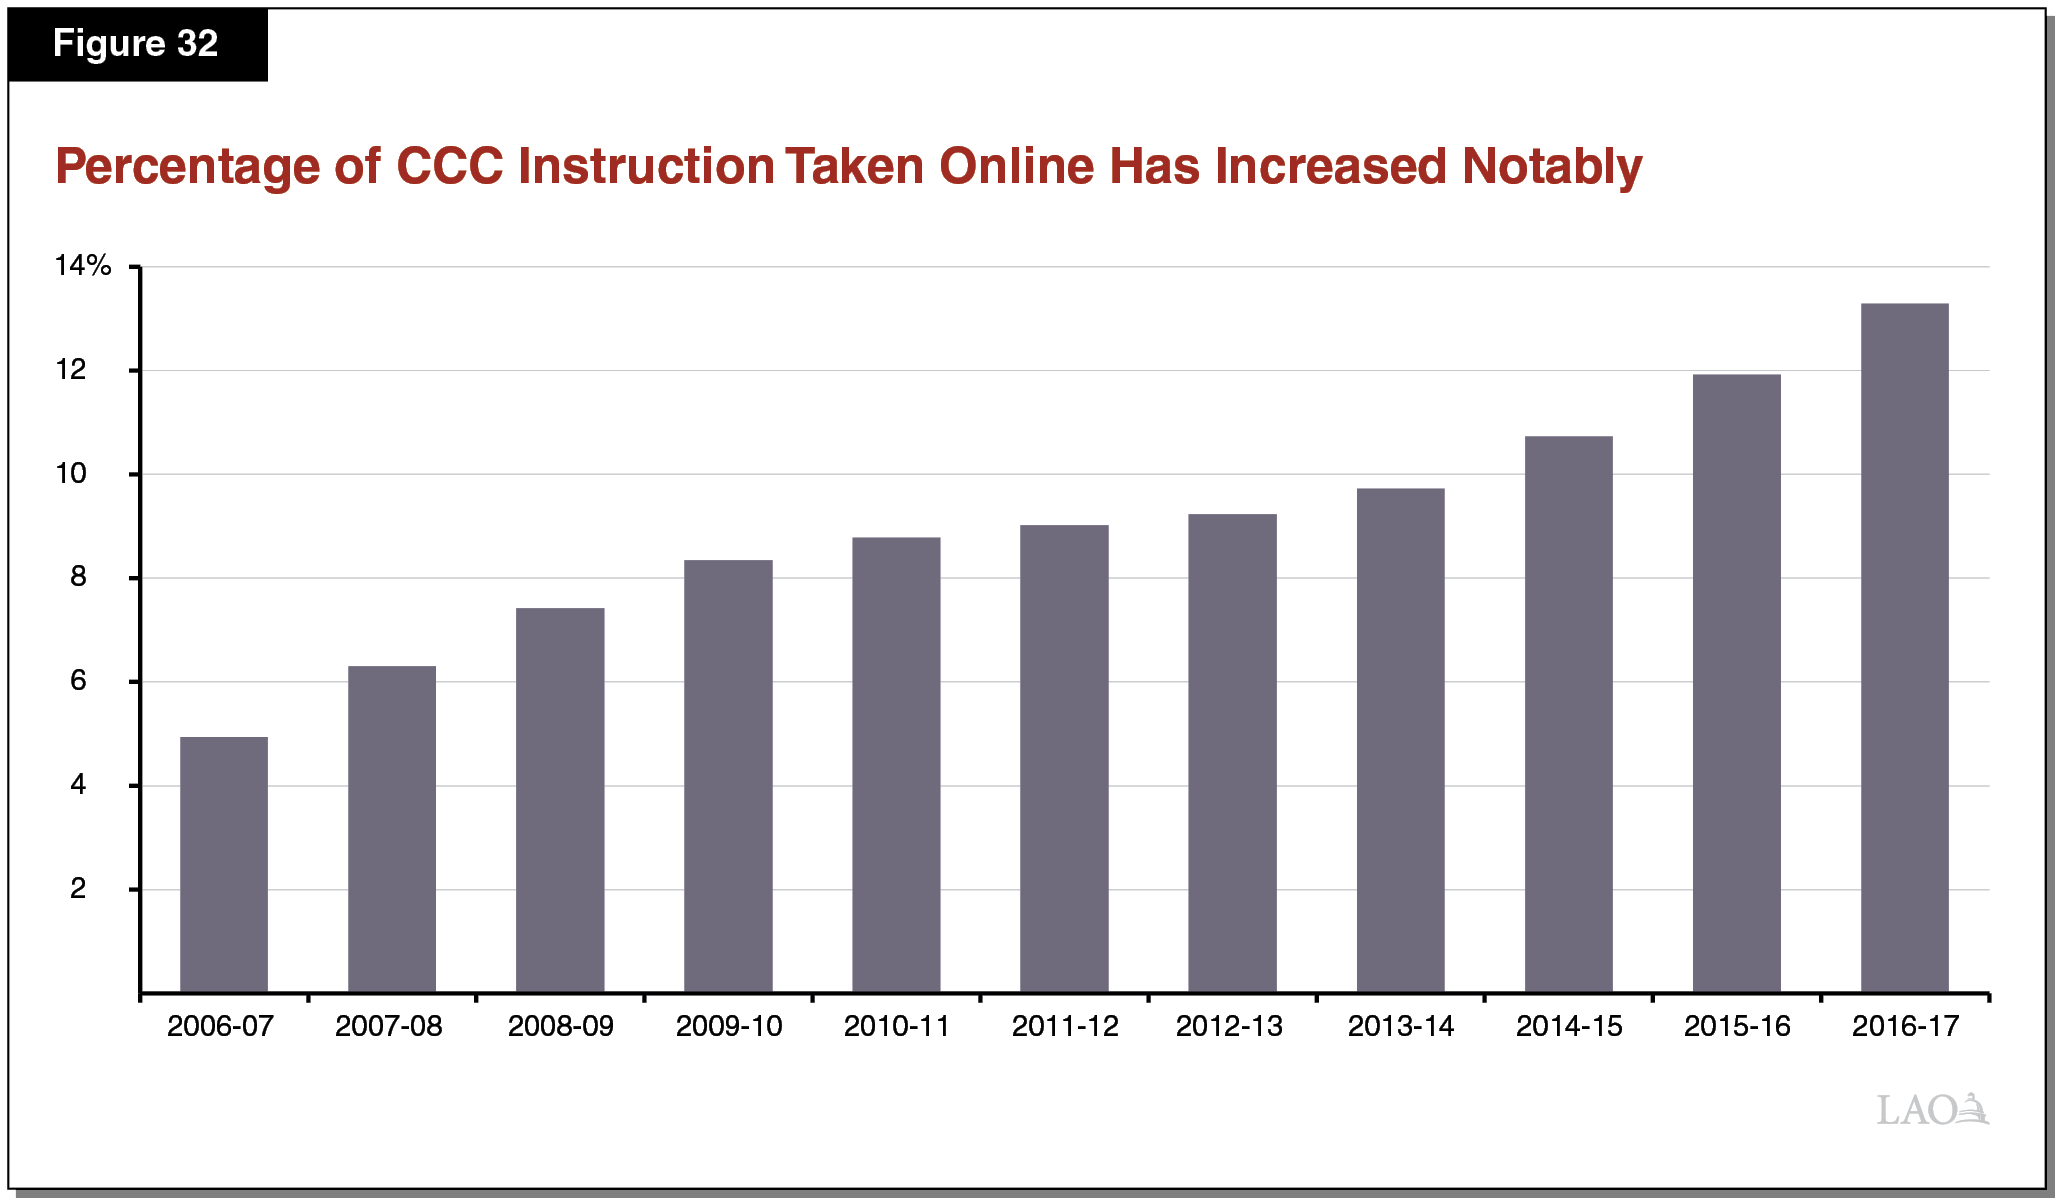
Decisions Regarding Online Course Offerings Are Made by Districts. As with other decisions regarding course and program offerings, colleges determine the number of online courses and programs they will offer. Online offerings vary by district, with some districts offering only a few online courses and 12 districts reporting more than 20 percent of their instruction is online.
Online Education Initiative (OEI) Launched in 2013 to Enhance Online Instruction. Most notably, OEI makes a common course management system available to all community colleges. The course management system allows faculty to post information about a course (including its syllabus), instructional content (such as video presentations and text‑based lectures), assignments, and other material. Students use the system to perform functions such as submitting their assignments, taking tests, and participating in online discussions with classmates. The OEI also provides training and resources for faculty interested in developing online courses and online tutoring for students. In addition, OEI runs a course exchange, which creates a more streamlined process for students at participating colleges to take online classes from other participating colleges. Currently six colleges participate in the course exchange.
To Date, Notable Shortcomings With Systemwide Efforts to Increase Online Offerings. Although many districts have increased their online offerings since 2013, efforts to give students access to online courses outside of their home districts have not had much success. Three main problems (discussed in the next three paragraphs) have limited systemwide expansion of online offerings.
Enrolling in Online Courses Outside of Home District Is Difficult. Although CCC students interested in taking an online course at another district in the system can search for options online, registering for these courses can be cumbersome. To enroll in courses outside of their home district, students have to apply separately for admission to each college offering a course of interest, receive new student identification numbers and passwords, and register for each class separately.
Campuses Are Reluctant to Participate in Course Exchange. To address some of the concerns with the existing cumbersome enrollment process, the OEI course exchange is intended to provide a more streamlined process for students to enroll in online courses offered by other colleges in the exchange. The OEI currently automates various components of the application process to allow students to enroll more quickly in online courses offered outside of their home district. (Recent changes in state law will allow greater streamlining of this process.) Course offerings in the exchange, however, are limited. Currently, only 45 courses are available. Though campuses might have various reasons for being reluctant to participate, one of the main reasons appears to be concern with losing enrollment funding to other campuses in the exchange. Enrollment funding for each course a student takes is scored to the college in the exchange running that course. This means colleges only have a fiscal incentive to participate in the exchange if they believe they can “win” more students than they “lose.”
No Systemwide Coordination of Course Offerings. Because decisions regarding online course offerings are made by districts, little coordination exists systemwide to monitor online offerings and determine whether these options are meeting the needs of students statewide. In some types of courses, such as transfer‑level general education courses, many online courses are available. In other areas, however, little online content exists.
Lower Success Rates in Online Courses, Though Gap Is Closing. As Figure 33 shows, CCC students perform somewhat worse in online courses compared to in‑person courses. In 2016‑17, students successfully completed 65 percent of online courses, compared with 72 percent for in‑person courses. This gap, however, is smaller than in prior years. In 2011‑12, 59 percent of online courses were completed successfully, compared with 70 percent of in‑person courses. These outcomes are similar to trends in other higher education systems across the country. Improved performance in online courses is likely due to a number of factors, including improvements in the quality of online content, the growing expertise of faculty in teaching them, and better support services (such as online tutoring). Colleges also have developed online learner readiness modules to help students understand how an online course differs from an in‑person course and determine whether they are well suited to taking online courses.
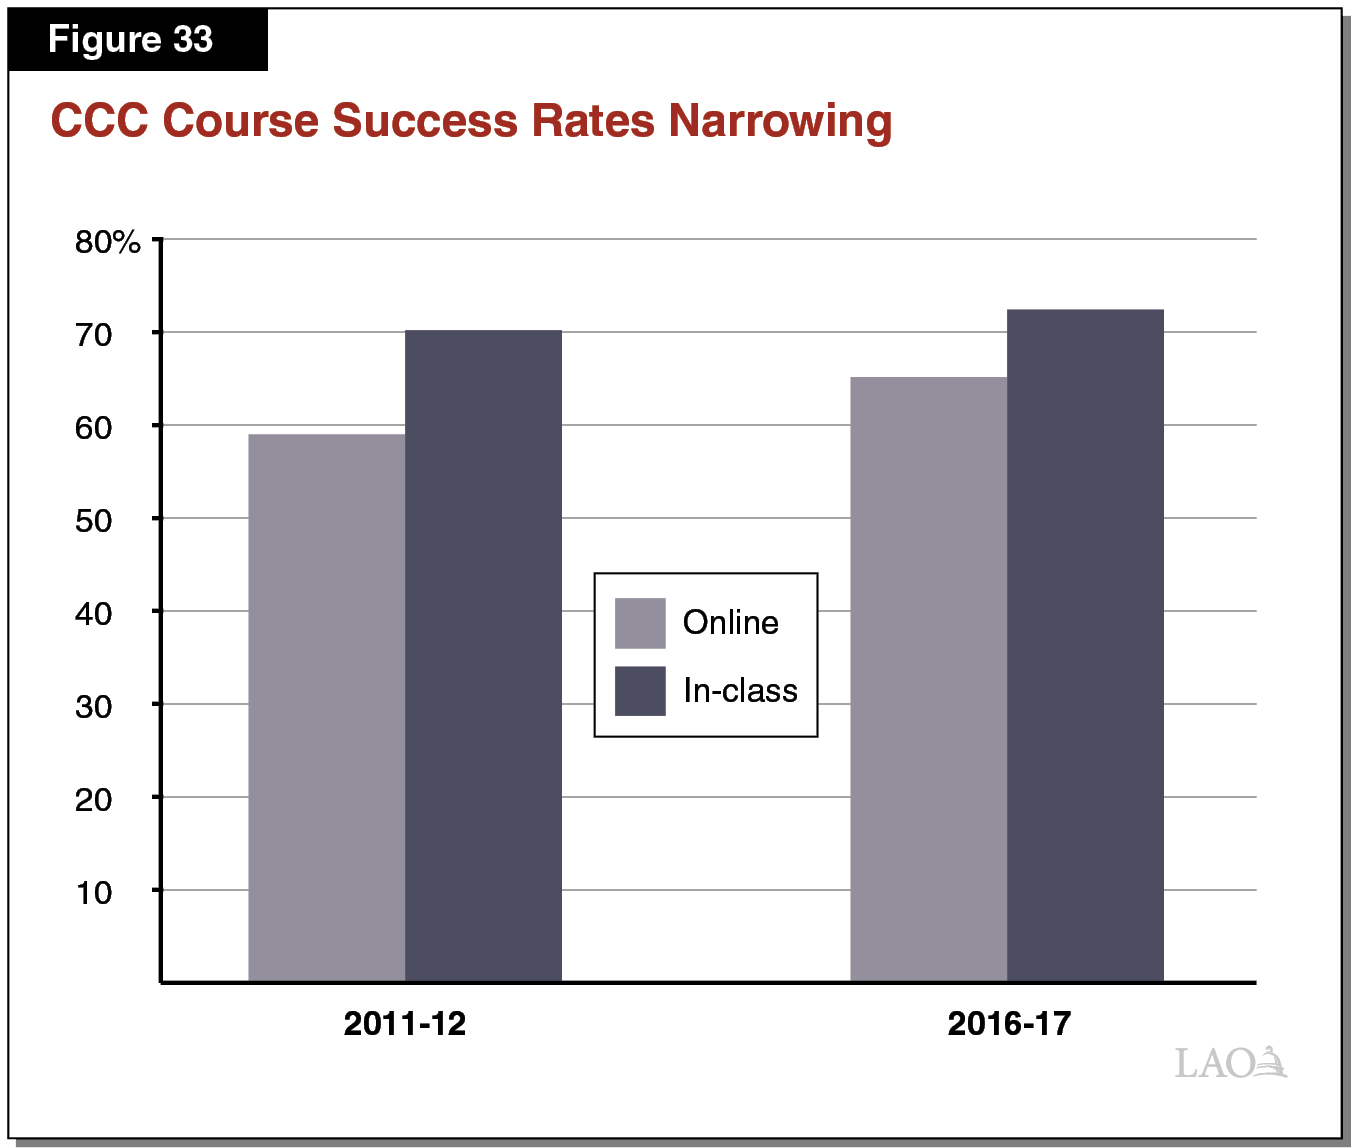
Success in Online Courses Varies by Student Type. Although students overall perform somewhat worse in online courses, the gap between in‑person and online performance varies by type of student. Various studies find older adults, students with higher GPAs, and women have higher completion rates for online courses than other types of students.
Governor’s Proposal
Creates New Online College Within CCC System. The Governor’s budget proposes to create a new online college with an explicit statewide focus. Initially, the college would be run by the CCC Board of Governors. The board either could hire a Chief Executive Officer or give authority to the Chancellor to administer the college. By July 2025, the college would be required to have its own board consisting of five voting members (three appointed by the Governor, one appointed by the Speaker of the Assembly, and one appointed by the Senate Rules Committee) and two non‑voting members appointed by the Governor.
Provides $100 Million for Startup and $20 Million for Ongoing Operations. The startup funding could be spread over a seven‑year period and used for technology, building space, and business plan development, among other things. The funding for ongoing operations could be used for the salaries and benefits of staff, staff training, and technology licensing and maintenance. When the college begins enrolling students, it would begin receiving apportionment funding similar to all other community college districts. The apportionment funding would be in addition to the base $20 million ongoing allocation.
Initial Program Offerings Would Target Working Adults, Focus on Short‑Term Pathways. The Governor’s proposal provides broad discretion for the online community college to identify the programs and credentials it would offer. Initially, the college is intended to focus on short‑term programs. Over the next three years, the college would be required to develop at least three short‑term program pathways linked with industry needs. The administration’s goal is to focus on attracting working adults ages 25‑34 with no postsecondary education credentials. This target group could include those with a high school diploma but no postsecondary experience, some college credits but no degree, and other adults, such as incarcerated and formerly incarcerated individuals and recent immigrants, presumably without a high school diploma. The administration indicates that not all programs would be fully online. In pathways where hands‑on experience is needed, the college intends to partner with other entities (such as libraries, other community colleges, and industry) to provide such experiences. The college also could establish partnerships with these or other types of entities to provide support services, such as tutoring.
Programs Intended to Accelerate Student Time to Completion and Improve Affordability. The administration indicates the online community college is to focus on developing programs that reduce time to completion and are affordable for students. To that end, the college is intended to use existing industry certifications, competency‑based learning, and prior learning assessments to reduce the amount of additional courses students need to complete their pathway. (Both competency‑based programs and prior learning assessments allow students to more quickly complete a program if they can demonstrate they already have mastered some of the content.) To the extent possible, the college is to use open educational resources, which are available to students at no cost.
Proposal Sets Several Milestones and Reporting Requirements for College. As Figure 34 shows, the Governor proposes the new college meet certain program, administrative, and accreditation milestones within the first seven years. Most notably, the Governor’s proposal requires the online community college to begin enrolling students by the last quarter of 2019, with at least 13 program pathways designed and validated by July 1, 2023.
Figure 34
Specific Milestones for New Online Community College
|
The online community college is to meet the following milestones by the specified dates: |
|
By July 1, 2020 |
|
|
|
|
|
|
|
|
|
By July 1, 2021 |
|
|
|
By July 1, 2023 |
|
|
|
By July 1, 2025 |
|
|
In Long Run, College Would Seek Accreditation. The Governor’s proposal requires the online community college eventually to be accredited by an accreditor recognized by the U.S. Department of Education. Without accreditation, students may be wary of enrolling in the college, students would be unable to transfer credits earned at the online community college to other community colleges, and students would be unable to access federal financial aid. Although the proposal includes no specific deadline for attaining accreditation, the new college must develop an accreditation plan by July 1, 2020.
College Exempt From Some Requirements. Initially, the online community college would be exempt from collective bargaining requirements. Instead, the college would be required to “meet and confer” with faculty to discuss salaries, benefits, and employment practices. The proposal includes no specific deadline for when collective bargaining would need to occur. In addition, the college would have flexibility with regard to setting its academic calendar and establishing an alternative student fee structure. The online community college would be subject to most other rules and regulations that apply to existing community colleges. Most notably, the college would be required to spend at least 50 percent of its general operating budget on salaries and benefits of faculty and instructional aides engaged in direct instruction. The college also would be required to have its program and courses reviewed and approved by the Chancellor’s Office.
Assessment
Governor’s Problem Statement and Proposed Solution Are Not Well Defined. In its description of the proposal, the administration identifies many key problems a new online community college could address: greater educational options for working adults lacking postsecondary credentials, greater access to online courses, innovation at the community colleges (such as incorporating competency‑based components and measuring prior knowledge), and providing cheaper alternatives to for‑profit colleges. The proposal for a new online community college, however, does not identify which of these problems is the administration’s primary concern. The administration also does not provide a clear rationale for why a new community college is needed to address these problems, rather than making systemwide improvements through existing community colleges. We describe more specific concerns with the proposal below.
Unclear If Providing Online Offerings Will Solve Key Barriers for Target Student Group. One of the proposal’s goals is to increase educational attainment for adults who currently have no postsecondary credentials. Although this is a laudable goal, the administration has not provided any evidence that an online community college will address the key barriers for this potential student group. Although an online program can increase convenience, working adults may not be pursuing additional education for a number of reasons. The administration also has not provided evidence that those working adults who are interested in more education cannot access it through existing online or in‑person community college programs.
Unclear if Target Student Group Is Well Suited for Online Approach. Studies find that individuals with a lower track record of academic success (as measured by GPA) have a larger drop‑off in online courses compared to in‑person courses. Given the target students under the Governor’s proposal consist of those who have no postsecondary experience and may not have graduated high school, an online setting likely is not the most effective instructional approach for them. The online community college could address this concern by paying particular attention to counseling and support services, online readiness assessments for students, and access to online tutors. The proposal, however, lacks detail on how the college would provide such support.
Unclear How Statewide Industry Partnerships Would Be Developed. Identifying industry partners would be critical for the success of the Governor’s proposed college. These partnerships would be necessary for identifying program pathways with high‑industry demand and providing the hands‑on experience students will need to complete the pathways. The administration’s proposal, however, lacks detail regarding how it will develop these partnerships, especially how it will develop them statewide given the regional nature of many industries. Without partnerships in all areas of the state, students may not have access to hands‑on experiences critical to program completion.
Creating a New College Has Significant Drawbacks Compared to Working Within Existing System. Compared to funding new initiatives within the existing CCC system or improving upon existing CCC initiatives, creating a new college requires much greater upfront spending. It also has the disadvantage of taking longer until students can access the new course offerings. The college would have to hire staff and develop key business practices before developing programs. By starting a new college, initial programs also would not be accredited. Students enrolled in the college’s programs prior to accreditation would be unable to receive federal financial aid and would not be able to transfer credits to other colleges.
Eventually, a New College Would Have Its Own Constraints. The administration has indicated that, by starting with a completely new organization, the online community college would be better positioned to implement innovative new programs. Without having programs that are already based on the traditional academic calendar, for example, the college could more easily use a competency‑based education model that allows students to advance at their own pace. Although the college initially may be more nimble, the college eventually would face many of the same constraints that existing community colleges face. Most notably, the college eventually would be expected to collectively bargain and would have to spend 50 percent of its budget on instructional salaries from the start. In the long run, these restrictions could result in the online college having the same types of constraints existing community colleges have in making major programmatic reforms.
Issues for Consideration
Elements of Proposal Could Have Benefits for Some Students. Some elements of the Governor’s proposal could have statewide benefits. Greater access to online education can provide increased opportunities for students to access required courses, thereby potentially speeding their time to graduation and reducing total cost of attendance. Also, by aggregating geographically separated students into online courses, programs can be run more efficiently. Additionally, creating competency‑based programs and recognizing prior learning can help students complete programs more quickly with a lower cost of attendance.
Explore Changes to Make Systemwide Improvements. Rather than creating a new college to implement key reforms, the Legislature could consider statutory changes that would help implement reforms within the existing CCC system. If interested in expanding access to online courses, the Legislature could incentivize districts to participate in the existing course exchange and improve students’ intercampus access to online courses. If the Legislature is interested in increasing the number of programs that incorporate competency‑based elements or recognize prior learning, it could modify the existing apportionment‑based funding model that currently creates a fiscal disincentive for colleges to pursue these options. If the Legislature is interested in having a particular set of programs available in an online format, the Legislature could have the Chancellor’s Office run a competitive grant application for colleges to develop such programs. Additionally, the Legislature could fund more training for faculty willing to teach those particular online programs and staff willing to support the students taking them. The Legislature also could consider using the CCC Strong Workforce Program to build additional industry partnerships to help link online coursework with hands‑on job experience. These options could address many of the administration’s current concerns and could be implemented immediately and at lower initial cost.
No Urgency If Interested in Creating an Online Community College. Ultimately, the Legislature may still want to pursue an online community college. Creating a new online college, in tandem with various other community college reforms, could significantly improve access and program options systemwide. Given the many important decisions involved in creating a new online college, we encourage the Legislature to take its time to review the Governor’s specific proposal and consider alternatives. As part of this examination, we encourage the Legislature to gather more information about what underlying problems exist, what are the root causes of those problems, how a new online college could be designed to respond to those issues, and how a new college could be funded and held accountable for meeting its objectives.
Financial Aid
In this section, we first describe and analyze the Governor’s proposal relating to enrollment fee waivers. We then describe and analyze the Governor’s proposal to consolidate two grants for living expenses. In regards to this latter proposal, we offer the Legislature an alternative to consider.
Enrollment Fee Waivers
Below, we provide background on the state’s longstanding enrollment fee waiver program as well as the new fee waiver program the Legislature authorized last year. Next, we describe and assess the Governor’s proposal to fund implementation of the new fee waiver program.
Background
State Has Long Waived Enrollment Fees for All Financially Needy Students. At CCC, financially needy students have their fees waived under the California College Promise Grant (formerly known as the Board of Governor’s Fee Waiver program). In 2017‑18, the per‑unit enrollment fee was $46, equating to an annual fee for a full‑time student (taking 15 units per term) of $1,380. In 2016‑17, the state spent $758 million on fee waivers. Half of students received fee waivers, accounting for two‑thirds of all course units taken. Financially needy students get all fees waived regardless of the number of course units they take. That is, both part‑time and full‑time students receive awards covering all their enrollment fee costs.
AB 19 Expanded Eligibility for Fee Waivers. Chapter 735 of 2017 (AB 19, Santiago) expanded the fee waiver program to students who do not demonstrate financial need. Specifically, it authorizes fee waivers for all resident first‑time, full‑time students during their first year of college. (Though the cost of the expanded program is calculated assuming all these students obtain fee waivers, the legislation allows colleges to use their program allotments for other purposes, such as providing more student support services.) To receive funding, colleges must meet various requirements, such as participating in the Guided Pathways program.
Governor’s Proposal
Provides Funding for AB 19 Fee Waivers. The Governor’s budget includes $46 million to fund the expansion of the California College Promise Grant program. The estimate is based on 2016‑17 data of the number of first‑time, full‑time students enrolled at CCC who did not receive a fee waiver. The Governor’s budget also includes $758 million to fund need‑based fee waivers.
Assessment
No Concerns With Basis of Governor’s AB 19 Cost Estimate. The Governor’s estimate of the cost of the AB 19 fee waivers is based on the best available data. Though the data underlying the estimate comes from 2016‑17, enrollment growth in 2017‑18 and 2018‑19 is likely to be negligible.
Estimate Does Not Account for Behavioral Changes. The Governor’s cost estimate, however, does not consider the potential behavioral effects that the proposal could have on students. For example, the proposal could result in more CCC first‑time students taking more units during their first year. To the extent this were to happen, the cost of the fee waivers would be higher. The program also could entice more students who otherwise might not have gone to college to enroll at CCC, which would increase state costs for CCC apportionments. The program also might entice nonneedy students who otherwise would have gone to CSU to complete their lower‑division coursework at CCC, thereby saving themselves the tuition cost at CSU. If students responded in this way, the state potentially could see a reduction in CSU enrollment costs. Though these types of behavioral effects are possible, they also are difficult to estimate.
Perennial Tension Between Access and Achievement. An ongoing tension exists between prioritizing funding for improving student access to higher education, particularly for students who otherwise could not afford college, and improving student achievement once students get to college. On a longstanding basis, state (and federal) financial aid programs have focused primarily on providing college access for financially needy students. In recent years, financial aid efforts have shifted to focus more on student achievement, with the intent of using financial aid to improve student outcomes. When making its financial aid spending decisions, the Legislature each year has to weigh these priorities.
Financial Aid for Living Costs
Below, we provide background on financial aid programs that cover living costs for community college students. We then describe the Governor’s proposal to consolidate two of these programs. Next, we assess those proposals and end by offering an alternative for the Legislature to consider.
Background
State Has Long Provided Aid to Cover Some Nontuition Expenses for Low‑Income Students. In addition to waiving enrollment fees for many community college students, the state traditionally has provided aid to cover a portion of some students’ living costs. Specifically, the California Student Aid Commission (CSAC) administers two Cal Grant awards that provide nontuition coverage for certain financially needy community college students. The state funds both types of Cal Grant awards with non‑Proposition 98 General Fund. The two types of awards are:
- The Cal Grant B Nontuition Award. This award provides low‑income students with $1,672 annually to cover living expenses. The majority of Cal Grant B nontuition awards are given to students who enroll in college within a year of graduating high school. Whereas these students are entitled to awards, older students compete for a fixed number of awards each year. In 2016‑17, about 74,000 community college students received entitlement awards and about 33,200 older students received competitive awards.
- The Cal Grant C Nontuition Award. This award provides low‑income students enrolled in CTE programs with $1,094 for materials and other nontuition expenses. Students of any age can receive the grant, but the state caps the number of awards offered annually. In 2016‑17, about 5,200 community college students received these awards.
Federal Government Also Has Long Provided Aid to Cover Some Nontuition Expenses. Community colleges administer the federal Pell Grant program, which provides financially needy students up to $5,920 annually, if enrolled in 12 or more units. The award amount is pro‑rated downward for part‑time students. As financially needy community college students get their enrollment fees waived, they may use their Pell Grants for living expenses. In 2016‑17, 450,000 community college students received Pell Grants.
Legislature Recently Created Two Programs to Cover Additional Nontuition Costs for Full‑Time Students. Due to concerns with low completion rates at CCC, the Legislature recently created two programs administered by the community colleges to provide more aid for students’ living costs if they enroll in more units. In 2015‑16, the Legislature created the Full‑Time Student Success Grant (Full‑Time Grant). The Full‑Time Grant provides students who receive a Cal Grant B award with an additional $1,000 annually if they enroll in 12 or more units per term. Enrolling in 12 units per term typically would lead to graduation in 2.5 years. In 2017‑18, the Legislature created the CCC Completion Grant. The Completion Grant provides an additional $2,000 annually to students receiving the Full‑Time Grant if they enroll in 15 or more units per term. Enrolling in 15 units per term typically would lead to graduation in 2 years. The state funds both programs with Proposition 98 General Fund. In 2016‑17, about 78,000 students received a Full‑Time Grant. Data are not yet available on the number receiving a Completion Grant.
In Total, Full‑Time Students Can Qualify for More than $10,000 Annually for Living Costs. As Figure 35 shows, CCC students enrolled in 15 units per term currently may qualify for one federal grant and three state grants to help them cover living expenses. In total, they may qualify for about $10,600 annually if meeting the Cal Grant B eligibility criteria and almost $10,000 annually if meeting the Cal Grant C eligibility criteria. By comparison, CCC students enrolled in 12‑14 units per term may qualify for about $8,600 annually if meeting the Cal Grant B eligibility criteria and almost $8,000 annually if meeting the Cal Grant C eligibility criteria.
Figure 35
Several Programs Help Financially Needy Students Cover Living Expenses
Reflects Annual Awards, 2017‑18
|
15 Units Per Term |
12‑14 Units Per Term |
|
|
Cal Grant B Students |
||
|
Pell Granta |
$5,902 |
$5,902 |
|
Completion Grant |
2,000 |
— |
|
Cal Grant B |
1,672 |
1,672 |
|
Full‑Time Grant |
1,000 |
1,000 |
|
Total Maximum Aid |
$10,574 |
$8,574 |
|
Cal Grant C Students |
||
|
Pell Granta |
$5,902 |
$5,902 |
|
Completion Grant |
2,000 |
— |
|
Cal Grant C |
1,094 |
1,094 |
|
Full‑Time Grant |
1,000 |
1,000 |
|
Total Maximum Aid |
$9,996 |
$7,996 |
|
aAssumes student has sufficient financial need to qualify for maximum award amount. Students with incomes under $50,000 typically qualify for an award. |
||
Living Costs Vary Based on Students’ Living Situations. About half of financially needy students enrolled in 12‑15 units live at home. We estimate that these students have on average $11,000 in annual nontuition costs. Of the students enrolled in 12‑15 units who do not live at home, we estimate that about 60 percent are dependent students and about 40 percent are independent students. (Students generally are considered independent if they are 24 years or older.) We estimate average annual living costs of about $15,700 for students who do not live at home. These estimates are based on averages, with any particular student potentially incurring notably higher or lower living costs.
Governor’s Proposal
“Consolidates” Two CCC Aid Programs and Increases Funding by $33 Million. The Governor proposes to create a new program called the Community College Student Success Completion Grant that replaces the rules underlying the existing Full‑Time Grant and Completion Grant. Instead of two tiers of funding based on the number of units a student takes per term, the new grant program would have four tiers. The maximum annual grant would be $1,000 for Cal Grant B recipients enrolled in 12 units per term, with incremental increases for recipients enrolled in 13 and 14 units, and a maximum of $4,000 for recipients enrolled in 15 units per term (see Figure 36). The proposal includes language that funding must not exceed a student’s demonstrated financial need (as calculated under the federal methodology). The Governor’s intent is to provide more funding to certain CCC students such that they could complete their degree more quickly by not working as much. He indicates that the program is meant to simplify financial aid programs by consolidating two programs. The Governor estimates that the cost of the grant program would total $124 million in 2018‑19, a $33 million increase over the combined cost of the Full‑Time Grant and Completion Grant programs in the current year.
Figure 36
Comparing Grant Amounts Under Existing and Proposed Rules
Reflects Annual Awardsa
|
Units Per Semester |
Current Grant Amount |
Governor’s Proposed Grant Amount |
|
12 |
$1,000 |
$1,000 |
|
13 |
1,000 |
1,250 |
|
14 |
1,000 |
1,900 |
|
15+ |
3,000 |
4,000 |
|
aA student would need to be enrolled full time in both fall and spring semesters to qualify for the amounts shown in the figure. Governor’s proposed amounts reflect maximum amounts, as awards could not exceed students’ financial need. |
||
Program Would Have Annual Reporting Requirements. The proposal requires CCC to report by April 1, 2020 on outcomes for the first year of the program, including information about the number of grant recipients and their college goals, their GPAs, and how many are on track to complete college in 2 or 3 years.
Assessment
Various Factors Are Correlated With Higher Completion Rates and More Timely Completion. Research suggests that several key factors contribute to more timely completion rates. Younger students and students that enroll in college immediately or soon after high school are likely to complete college at higher rates than students who are older or enroll later in life. In addition, research suggests that providing aid for students’ living expenses can induce low‑income students to work fewer hours and enroll in more units, which can lead to more timely completion. Research also suggests, however, that students working between 10 and 20 hours per week during the academic year do not have worse educational outcomes than nonworking students.
Governor’s Proposal Provides Additional Funding for a Subset of Full‑Time Community College Students. The Governor proposes to cover a larger share of living expenses for the 60,000 Cal Grant recipients at the community colleges enrolled in 13‑15 units per term. (Funding for living expenses for students enrolled in 12 units would remain the same.) Beyond these students, more than 200,000 additional financially needy community college students enroll in 12 or more units per term but do not receive a Cal Grant. This usually is because they graduated high school more than a year prior to entering community college. The Governor’s proposal would continue to exclude these students from receiving additional aid for living expenses.
Governor’s Goal to Simplify Aid Programs Has Merit, but Proposal Does Not Simplify. The Governor’s goals to simplify and consolidate financial aid programs are laudable. His approach, however, has notable shortcomings. Although it combines two programs in name, it makes the underlying award rules more complicated by introducing four award tiers rather than the existing two. When financial aid programs are overly complicated, students might not understand them, so the programs might not have their intended effects on student behavior. In addition, complicated financial aid programs can be difficult for administrators to understand and convey to students. Lastly, overly complicated approaches to financial aid can result in policymakers being unable to identify the specific factors contributing to program outcomes, such that knowing how best to refine those programs is especially challenging.
Governor’s Award Structure Could Be More Closely Linked to Financial Need and Living Costs. The Governor’s proposal does not link grants specifically with financially needy students’ unmet living costs. It also does not take into account how unmet need is likely to vary at different unit loads. For example, the proposal provides $250 more annually to students enrolled in 13 rather than 12 units per term. The Governor provides no rationale for why $250 is an appropriate amount to provide for a student enrolled in 1 more unit. If taking 12 rather than 13 units per term, a student could work for the 3 hours a week he/she otherwise would have spent in class and on homework. At minimum wage, that student could earn over $1,000 more in the course of an academic year by working rather than receiving the grant to take 1 extra unit. The Governor’s proposal, therefore, could be more closely linked to the incentives that students consider when deciding whether to work or take a higher course load.
Recommendations
Recommend Rejecting Proposal and Thinking More Holistically. Though we believe the Governor has a worthwhile objective to improve time to degree at the community colleges, particularly among low‑income students, we also believe the Legislature has better ways to achieve this objective. Thus, we recommend the Legislature reject the Governor’s approach, taking a more straightforward alternative approach. The alternative approach would be to consolidate all existing aid programs covering nontuition costs for financially needy community college students. We recommend funding the consolidated program using Proposition 98 funds (consistent with virtually all other CCC operational funding) and having the CCC Chancellor’s Office administer the consolidated program. Specifically, we recommend collapsing funding from the community college Cal Grant B nontuition award ($158 million non‑Proposition 98), the Cal Grant C nontuition award ($5 million non‑Proposition 98), the Full‑Time Grant, and the Completion Grant (at the Governor’s higher combined proposed funding level of $124 million Proposition 98). Thus, a total of $287 million would be available. As explained below, the Legislature has various issues to consider in implementing the new program.
Consider Living Costs Then Apply Reasonable Expectations. When considering how to award funding under a new program, we recommend the Legislature consider community college students’ living arrangements as well as their expected family contributions and federal aid. We also recommend applying a reasonable work expectation. Though any expectation between 10 and 20 hours per week would be reasonable given research findings, we ran program estimates assuming 15 hours per week. After applying a work expectation of 15 hours per week, an average family contribution, and an average Pell Grant award, we estimate that financially needy dependent students who live at home and enroll full time on average already have their living costs covered. For full‑time dependent students not living at home, we estimate average unmet living costs of $2,700 annually, after applying the same work, family contribution, and Pell Grant expectations. For full‑time independent students not living at home, we estimate unmet living costs of $4,300 annually, after applying the same expectations. For all financially needy full‑time students across all living arrangements, we estimate covering unmet living costs would total about $500 million annually. This cost is significantly higher than current program costs because all financially needy full‑time students’ unmet living expenses would be covered.
Link Living Grant With Unmet Living Costs. Under the new program, we recommend the Legislature make grants equal to whatever amount of unmet living costs a student has after factoring in all the above expectations. For example, two financially needy dependent students living not at home and enrolled full time would each have expected annual living costs of $11,000. Both students would be expected to work 15 hours per week and earn $7,848 annually. One student, however, might have a lower expected family contribution and therefore more unmet need. The living grant for this student would be larger. The program would work similarly for full‑time students with other living arrangements.
Consider Ways to Prioritize Awards Given Available Funding. As the $287 million for the new program would be insufficient to cover all unmet living costs for financially needy community college students enrolled full time, the Legislature could consider various options to prioritize available funding. A common way the Legislature prioritizes funding is based on financial need. Under this approach, the financially neediest students would get all their unmet living costs covered, then students with slightly less financial need would receive coverage, until all available funds were spent. Alternatively, the Legislature could pro‑rate awards downward, covering a portion of unmet living costs for all financially needy students. Another option would be to prioritize dependent students, then independent students, as research generally finds that younger students are more likely to complete college than older students. Rather than rationing, the Legislature could consider shifting funding from other Proposition 98 programs to cover the full estimated cost of the program. Yet another option would be to develop a statutory plan for gradually increasing funding until full program costs were covered, using any of the above rationing options during the interim.
Our Recommendations Would Simplify Messaging and Administration. Taking our approach would simplify messaging to low‑income community college students. Rather than needing to understand the rules of multiple state programs, students would need to understand only one. The rules for the one program would be more straightforward—financially needy dependent students that work 15 hours a week and enroll in 12‑15 units would receive aid sufficient to cover their unmet living costs. Under our approach, the process of receiving and delivering aid also would be less confusing and more efficient for community college students and administrators. Students would receive all of their state and federal aid from their campus, with campus aid administrators packaging the aid directly.
Our Recommendations Likely Would Result in Better Student Outcomes. Our approach has the potential to change student behavior because the message of the program would be clearer for students (and administrators and policymakers). By potentially improving both completion and time to degree, the program also could improve the efficiency of the system and lower costs per completion. In addition, our approach would allow policymakers to determine more easily whether students were reacting to the program’s incentives to complete and complete more quickly.
Apprenticeship Programs
In this section, we first provide background on apprenticeships. We then describe and assess the Governor’s two proposals relating to the state’s apprenticeship programs. We end by making associated recommendations.
Background
Nearly 80,000 Registered Apprentices in Various Trades. In 2016‑17, California had nearly 80,000 registered apprentices in more than 50 trades, ranging from glazing to motion picture work. The most common apprenticeships are in the construction trades, making up about 70 percent of apprentices in the state. These apprenticeships include training for carpenters, plumbers, and electricians, among others. The second most common apprenticeships are in public safety, primarily for correctional workers and firefighters. Apprenticeship programs typically are sponsored by businesses and labor unions that design and support the programs and recruit apprentices. The sponsors must find a school district or community college that will affiliate with them. To become a state‑approved program, the sponsors and affiliated education agency submit their apprenticeship program plans to the Division of Apprenticeship Standards (DAS) in the California Department of Industrial Relations. The DAS reviews the curriculum and certifies that the programs meet industry standards.
State Workforce Plan Has Goal of Significantly Increasing Apprenticeships Over Next Few Years. The federal Workforce Innovation and Opportunity Act requires each state to submit a plan for addressing its workforce needs. California’s state plan sets a goal of doubling apprenticeships in the state by 2027—from roughly 80,000 apprentices to 160,000. Research indicates that the apprenticeship model is an effective way to train people for jobs with relatively high earnings potential.
Apprenticeships Combine On‑the‑Job Training With Coursework. Apprenticeships differ from other CTE because they are paid work programs that pair adult students with skilled workers for supervised, hands‑on learning. Apprenticeships last from two to six years and typically result in job placement. In tandem with on‑the‑job training, apprentices take classes relevant to their trade. Classroom time is known as related supplemental instruction (RSI). Usually these classes are held on weekends or evenings to accommodate apprentices’ work schedules. Most apprenticeship programs have stand‑alone training centers that provide these classes, but school districts and community colleges provide some apprenticeship classes on their campuses. The required mix of on‑the‑job training and coursework varies by industry, but the on‑the‑job training component typically entails more hours than the coursework component. Carpentry apprentices spend a minimum of 3,600 hours on the job and 432 hours in RSI over three years, for example, while air conditioning and refrigeration apprentices must complete 7,500 hours on the job and 1,080 hours in RSI over five years.
State Now Has Two Apprenticeship Programs. The state’s longstanding Apprenticeship program focuses on traditional apprenticeship fields. In 2017‑18, the state provided $39.9 million for the program. In 2015‑16, the state created the California Apprenticeship Initiative, which provides $15 million annually for nontraditional apprenticeship programs (such as healthcare, advanced manufacturing, and information technology) and pre‑apprenticeships (programs that prepare students for an apprenticeship). Figure 37 shows state funding for each of these programs over the past five years. Total state funding for apprenticeships is almost two‑and‑a‑half times greater today than five years ago.
Figure 37
Apprenticeship Funding Has Grown Significantly Over Time
(In Millions)
|
Apprenticeship |
California Apprenticeship Initiative |
Total |
|
|
2013‑14 |
$23 |
— |
$23 |
|
2014‑15 |
23 |
— |
23 |
|
2015‑16 |
37 |
$15 |
52 |
|
2016‑17 |
39 |
15 |
54 |
|
2017‑18 |
40 |
15 |
55 |
State Subsidizes Portion of Coursework Costs at “Regular” Noncredit Rate. The bulk of state Apprenticeship funding is for RSI. State funding helps support some costs of RSI by providing $5.90 for every hour of instruction. This rate equates to the hourly rate for community college regular noncredit instruction. Apprenticeship programs indicate that sponsors typically fund more than half of RSI costs. To access state funding, apprenticeship programs submit a record of the number of hours of instruction their apprentices have completed to DAS, which certifies the hours. Those hours are then reimbursed at the end of the year by the sponsor’s affiliated school district or community college. These education agencies take a portion of the funding off the top before passing through the rest as RSI reimbursement. The portion held back is larger when programs use school districts or community college classroom space. The state has increased the RSI rate every year since 2014‑15, rising from $5.04 that year to $5.90 in 2017‑18.
Number of Approved Apprenticeship Hours Has Increased in Recent Years. The number of certified RSI hours has increased significantly in recent years (see Figure 38). This is likely due to the state’s economic recovery. Growth in apprenticeship hours has been widespread across industries but especially pronounced in the construction trades.
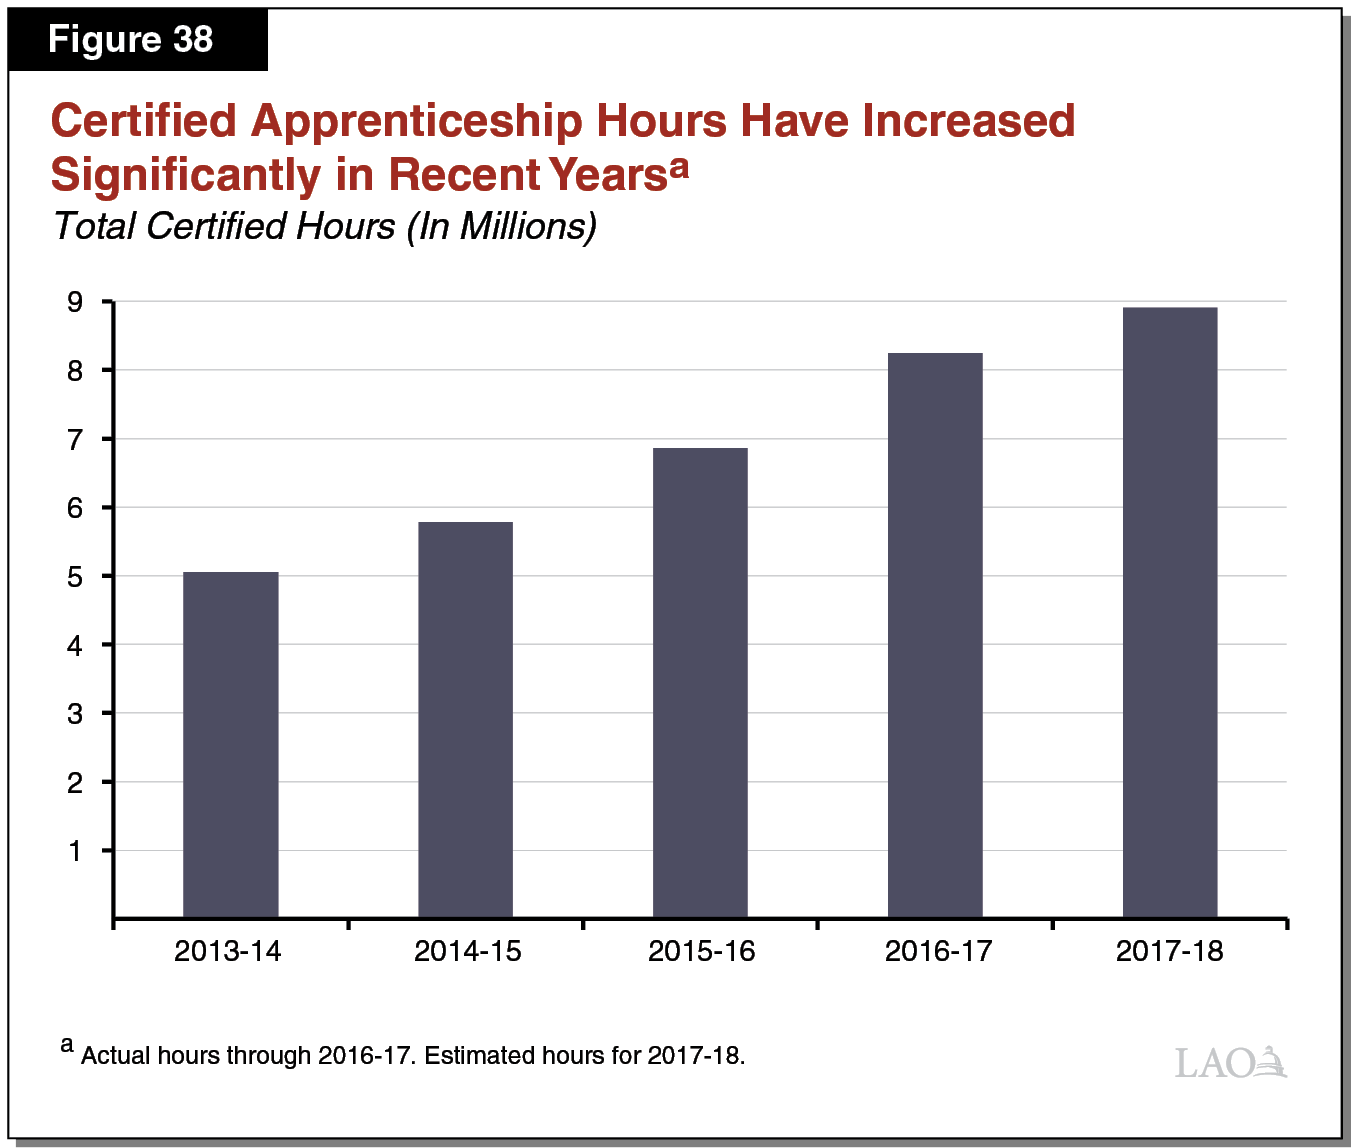
If Funding for RSI Falls Short, the RSI Is Pro‑Rated Down. In recent years, the amount of funding the state has budgeted for RSI has fallen short of covering all certified instructional hours for traditional apprenticeship programs. When funding is not sufficient to reimburse all hours at the specified RSI rate, the rate is adjusted downward. In each of the past five years, the state has made pro‑rata reductions (see Figure 39). Because school district and community college apprenticeship programs have different line items in the state budget, their pro‑rata reductions have been different. In recent years, the pro‑rata reductions for apprenticeship programs affiliated with school districts have been greater, largely because they have grown more rapidly than community college‑affiliated apprenticeships.
Figure 39
Apprenticeship Reimbursement Rate Has Been Prorated Down in Recent Yearsa
Hourly Rate
|
Statutory Rate |
Pro‑Rata Reductiona |
Effective Rate |
|
|
2013‑14 |
$5.04 |
‑10% |
$4.53 |
|
2014‑15 |
5.04 |
‑22 |
3.95 |
|
2015‑16 |
5.46 |
‑1 |
5.38 |
|
2016‑17 |
5.71 |
‑18 |
4.68 |
|
2017‑18b |
5.90 |
‑24 |
4.48 |
|
aReflects average of school district and community college pro‑rata reductions. bPro‑rata reduction and effective rate are estimates. |
|||
Some Apprenticeship Coursework Offered for Credit. About 90 percent of apprenticeship courses that are affiliated with community colleges are offered for credit. Apprenticeship instructors, rather than community college faculty, typically teach these classes at apprenticeship training centers. These apprenticeship courses generally are degree applicable, though the programs alone do not culminate in an associate degree. Despite being offered for credit, the courses are funded based on the regular hourly noncredit rate. Comparable apprenticeship programs run through school districts generally are not offered for college credit. Regardless of whether offered for college credit, all apprenticeship programs culminate in industry certifications.
Governor’s Proposals
Provides $31 Million One Time to Make Up for Pro‑Rata Reductions in Prior Years. The Governor’s budget includes $31 million one time to reimburse the traditional Apprenticeship program for pro‑rata reductions that occurred from 2013‑14 through 2017‑18. Though apprenticeship hours for 2017‑18 have not yet been certified, the Governor’s budget assumes an average 32 percent pro‑rata reduction would occur absent the proposed augmentation. The amount provided is based upon the total number of certified hours over this period and the pro‑rata reductions. Of the $31 million, the bulk is associated with 2017‑18 ($10 million), with the remaining $21 million spread over the rest of the period. The proposal allocates the funds proportionally—effectively undoing the prior‑year pro‑rata reductions. The majority goes to programs affiliated with school districts ($25 million). The proposal does not place restrictions on the use of funds.
Provides $17.8 Million Ongoing for Traditional Apprenticeship Program. Of this amount, $13.8 million is associated with more RSI hours and $3.9 million is associated with increasing the RSI rate up to the new noncredit hourly rate of $6.49. As the state has not adjusted the base number of RSI hours it reimburses since 2015‑16, the Governor’s proposal effectively trues up to the 2017‑18 level and holds that level flat in 2018‑19. Although the Governor expects growth in apprenticeship hours in the budget year, he holds hours flat because he believes that growth would be offset by his companion proposal to allow apprenticeships at community colleges to start earning the credit funding rate and generating apportionment funding. We describe this proposal in the next paragraph.
Proposes Allowing Colleges to Earn Credit Funding Rate for Apprenticeship Programs. The Governor proposes to allow colleges to generate the credit funding rate rather than the RSI rate for apprenticeship courses it offers for college credit. The Governor’s proposed 2018‑19 credit rate is $5,453 per student. This equates to $10.38 per hour—60 percent higher than the proposed 2018‑19 RSI rate, which would apply to all other apprenticeship programs. The Governor indicates that this proposal could (1) incentivize more colleges to offer apprenticeships and (2) lead to more students receiving college credit for apprenticeships, which eventually could lead to more associate degrees or stackable credentials. He indicates the credit rate is justified because credit‑bearing programs could be more expensive if taught at community college campuses rather than at training centers. The administration has neither provided data on the projected number of courses that likely would start to earn the credit funding rate in 2018‑19 nor estimated the additional associated apportionment cost.
Assessment
No Compelling Justification for Retroactive Reimbursements. During the years that state apprenticeship funding fell short of demand, apprenticeship sponsors covered more of the costs of instruction. State law makes clear that if funding is insufficient to cover all certified hours, the administering agencies are to make adjustments to stay within the annual budget allocation. Though anticipating what the effective reimbursement rate will be in any given year likely is challenging for participating businesses and unions, the state’s Apprenticeship program has worked this way for many years. Moreover, apprenticeship hours have continued to grow at a remarkable pace even though participating businesses and unions have known that the reimbursement rate is very likely to be pro‑rated downward, as such adjustments have been made for five consecutive years.
Ongoing Augmentation Would Better Align Funding With Apprenticeship Hours. Though we believe providing retroactive reimbursements serves no compelling state purpose, we believe aligning state funding with projected apprenticeship hours moving forward is reasonable. Trying to avoid a notable pro‑rata reduction in the budget year would make planning easier for participating businesses and unions. Moreover, we do not have concerns that increasing the effective RSI rate will result in too many apprenticeships. This is because apprenticeship sponsors cover the majority of program costs and thus have incentives not to overproduce apprentices.
No Evidence Raising Apprenticeship Funding Rate Even Further Is Warranted. Given how quickly the number of apprenticeships has been growing in recent years, the state likely is on track to meet its goal of having 180,000 registered apprentices by 2027. Based on recent trends in certified hours, employers clearly are willing to cover a large share of RSI costs. Increasing the reimbursement rate even further—to the community college credit rate—appears unnecessary. Eventually, raising the rate to especially high new levels could result in less employer buy‑in, effectively having state funding supplant funding from businesses and unions.
Community Colleges Already Offer Apprenticeship Instruction for Credit. The vast majority of students attending apprenticeships through the community colleges already earn credits that they can apply toward an associate degree or other credential. We see no reason to increase the funding rate for these courses by 60 percent on the chance that the higher rate might spur slightly more credit instruction.
Proposal Would Result in Different Rules for Apprenticeship Program Providers. The Governor’s proposal further complicates the Apprenticeship program by proposing a higher funding rate for certain community college apprenticeship programs and not for other community college and school district apprenticeship programs. Moreover, the Governor’s proposal could result in inconsistencies in apprenticeship instructor qualifications. The minimum qualifications for apprenticeship instructors currently are different from community college faculty, even if the apprenticeships are taught in affiliation with community colleges. Under the Governor’s proposal, the impact on apprenticeship instructors is unclear. Potentially these instructors could have to meet new requirements merely because of the new funding mechanism. (The administration has provided no evidence that the quality of apprenticeship instructors is poor.)
Recommendations
Reject Retroactive Reimbursements. We recommend the Legislature reject the Governor’s proposal to provide reimbursements to apprenticeship programs for prior year costs that exceeded the budgeted allocation. Program sponsors continued to cover these costs during this time and the program continued to grow rapidly.
Approve $23.6 Million Ongoing Augmentation ($5.8 Million More Than Governor’s Budget). We recommend the Legislature provide an augmentation of $23.6 million to cover all projected RSI hours in 2018‑19. We estimate 10 percent growth in 2018‑19 based on average annual growth over the past five years. In addition, we recommend the Legislature readjust the amount of RSI hours it funds annually so that the hours the state reimburses moves up and down with the economy and the demand for apprentices.
Reject Governor’s Proposal to Allow Colleges to Earn Credit Funding Rate for Apprenticeship Programs. We recommend rejecting the Governor’s proposal to allow colleges to claim credit funding for apprenticeship programs. Apprenticeship instruction already can be offered for credit. Moreover, apprenticeships continue to increase even at the current hourly noncredit funding rate.
Other Proposals
Below, we discuss the Governor’s proposals relating to deferred maintenance and awards for colleges to implement innovative improvement strategies.
Deferred Maintenance
CCC Maintains Inventory of Facility Conditions. Community college districts jointly developed a set of online project planning and management tools in 2002. The Foundation for California Community Colleges, with assistance from San Joaquin Delta Community College District, operates and maintains this system on behalf of districts. The Foundation employs assessors to complete a facility condition assessment of every building at districts’ campuses and centers on a three‑ to four‑year cycle. These assessments, together with other facility information entered into the system, provide extensive data on CCC facilities and help districts with their local planning efforts. All 72 districts pay annual fees to the Foundation to support the facility condition assessments and the online management system.
CCC Reports Sizeable Maintenance Backlog. From the districts’ facility condition assessments, the CCC system has identified $6.6 billion in scheduled and deferred maintenance projects over the next five years. The system has narrowed down the list to identify a more feasible maintenance plan of $1.2 billion in top priority projects to be completed over this period. Of this amount, the Chancellor’s Office identified $611 million in projects to undertake the next two years.
State Has a Categorical Program for CCC Maintenance. This categorical program also funds the replacement of instructional equipment and library materials, hazardous substances abatement, architectural barrier removal, and water conservation projects. Historically, budget language for this program has required a one‑to‑one match (with districts meeting the local match using apportionments, local bond monies, or other general purpose funds), but no match has been required since 2013‑14. To use this categorical funding for maintenance, districts must adopt and submit to the CCC Chancellor’s Office a five‑year plan of maintenance projects. Districts also must spend at least 0.5 percent of their current operating budgets on ongoing maintenance and at least as much on maintenance as they spent in 1995‑96 (about $300 million statewide) plus what they receive from the categorical program. In addition to categorical funds, districts fund scheduled maintenance from their apportionments and other general purpose funds (for less expensive projects) augmented by local bond funds (for more expensive projects).
State Has Provided Substantial Funding for CCC Maintenance Over Past Few Years. Over the last four years, the state has provided $551 million for the CCC maintenance categorical program. Historically, this program has received large appropriations when a large amount of one‑time Proposition 98 funding is available and no appropriations in tight budget years. The budget has typically allocated half of the program’s funding for deferred maintenance and half for replacement of instructional equipment and library materials. In 2014‑15, the budget removed this split, leaving associated allocation decisions up to districts. Data are not available on how much of the funding community colleges have spent on each of the allowable uses. Data also are not available on how much the colleges expect to spend from their apportionments and bond funds on maintenance.
Governor Proposes $275 Million One Time for CCC Maintenance Categorical Program. Under the Governor’s budget, one‑time funding for this categorical program would come from several sources. Specifically, $184 million is 2017‑18 funds, $81 million is 2018‑19 funds, and $11 million is Proposition 98 settle‑up funds. Consistent with recent practice, the Governor proposes no matching requirement and no required split between using the funds for maintenance or equipment and materials.
Recommend Adopting Governor’s Proposal. The proposed funding would help address CCC’s large maintenance backlog and help update instructional equipment and materials. In addition, by dedicating $80 million in 2018‑19 Proposition 98 funding to one‑time purposes, the proposal would provide a corresponding cushion against potential revenue declines and drops in the Proposition 98 minimum guarantee in the future. For these reasons, we recommend adopting the Governor’s proposal. To the extent the Legislature rejects the Governor’s other one‑time CCC proposals or prefers to provide community colleges with a larger amount of one‑time funding, we recommend the Legislature further increase funding for this categorical program.
Innovation Awards
First Awards Funded in 2014‑15. The 2014‑15 budget provided $50 million in one‑time funding to promote innovative models of higher education at UC, CSU, and CCC campuses. Campuses (or teams of campuses) that had undertaken initiatives to increase the number of bachelor’s degrees awarded, improve four‑year completion rates, or ease transfer across the segments could apply for awards. Because awards were based on initiatives already implemented at the campuses, they functioned more like prizes or rewards than grants for specified future activities. A committee of seven members—five Governor’s appointees (one each representing the Department of Finance, the three segments, and the State Board of Education) as well as two legislative appointees selected by the Speaker of the Assembly and the Senate Rules Committee—made award decisions. The committee approved 14 of 57 applications, including 6 from community colleges. The winning applications were for strategies that included improving K‑12 alignment with higher education expectations, redesigning curriculum and teaching practices to improve outcomes, and using technology to expand access to courses. Each winning applicant received from $2.5 million to $5 million in award funds. Award recipients are to report on their strategies by January 1, 2018 and January 1, 2020. As of this writing, the January 2018 compiled reports had not yet been released.
Second Round of Awards Funded in 2016‑17. After rejecting the administration’s proposal for more awards in 2015‑16, the Legislature accepted a revised proposal the following year. The 2016‑17 awards program, funded with $25 million one‑time Proposition 98 funds, differed from the 2014‑15 program in three ways: (1) only community college districts could apply for awards; (2) awards were based on proposed activities instead of initiatives applicants already had implemented; and (3) the Governor had more discretion in selecting his appointees to the awards committee. The program that year authorized awards for curriculum redesign (such as the implementation of three‑year bachelor’s degrees), competency‑based programs (such as efforts to award credit for military education and training), and financial aid access (such as increasing the number of students applying for aid). The program gave preference to projects that focused on improving outcomes for students from underrepresented groups or using technology in ways that are not common in higher education. In the spring of 2017, the committee awarded funds to 14 colleges, with 11 awards of $2 million each and 3 awards of $1 million each.
Third Round of Awards Funded in 2017‑18. The 2017‑18 budget provided $20 million one‑time Proposition 98 funding for a third round of innovation awards. Like the 2016‑17 awards, the 2017‑18 program focuses on innovations at the community colleges, with awards for addressing specified groups of underrepresented students and using technology to improve instruction and support services. The 2017‑18 program is different, however, in that it eliminates the award committee appointed by the Governor and Legislature and tasks the Chancellor’s Office with making award decisions directly. The Chancellor’s Office is to submit interim and final reports on these awards by January 1, 2020 and 2022, respectively. Applications for these awards are due March 19, 2018, with winners to be announced by May 14, 2018.
Governor Proposes Fourth Round of Innovation Awards. The Governor’s budget includes $20 million one‑time Proposition 98 funding for an additional round of innovation awards to community colleges. As with the awards funded in 2017‑18, the Chancellor’s Office would set award criteria and select winners. The 2018‑19 awards are to focus on innovations that reduce regional achievement gaps across the state and gaps for students from traditionally underrepresented groups. In particular, the proposal emphasizes interest in closing gaps related to degrees and certificates awarded, the number of excess units taken by students attaining associate degrees, and the number of CTE students who become employed in their field of study.
Potential Statewide Benefits Unclear. One of our most significant concerns with the proposal is that the awards might provide relatively large sums to a small number of community colleges to implement local initiatives that would not necessarily have statewide impact. This is because the proposal does not provide for dissemination of innovations to other colleges across the state nor does it do anything to promote buy‑in among other colleges to implement the innovations.
Award Program Further Fragments Efforts to Improve Student Outcomes. We also are concerned that the awards add yet another program to the state’s numerous existing efforts to improve CCC student outcomes. The current plethora of student support and success initiatives is already challenging for colleges to coordinate. Moreover, these existing initiatives, as well as the proposed changes to the CCC apportionment funding formula, are designed to have much broader statewide impact. Rather than funding another round of generous awards to a small number of colleges, we believe the state should focus on effectively implementing systemwide CCC initiatives.
Reject Governor’s Proposal to Provide $20 Million for CCC Awards. For these reasons, we recommend the Legislature reject this proposal. The Legislature could instead target the funding to other priorities, like deferred maintenance, that are one time in nature.
Facilities
In this section, we provide background on state funding for CCC facilities and discuss the Governor’s proposal to authorize five new community college projects.
Background
State Primarily Funds Community College Facilities Through General Obligation Bonds. The state typically issues general obligation bonds to help pay for community college facility projects. A majority of voters must approve these bonds. From 1998 through 2006, voters approved four facility bonds that provided a total of $4 billion for community college facilities. Virtually no funding remains from these facility bonds.
New State Bond Approved in 2016. After a ten‑year gap, voters approved Proposition 51 in November 2016. It authorizes the state to sell $2 billion in general obligation bonds for community college projects (in addition to $7 billion for K‑12 school facilities projects). The funds may be used for any CCC facility project, including buying land, constructing new buildings, modernizing existing buildings, and purchasing equipment.
Community College Facility Projects Recommended by Chancellor and Approved in Annual Budget. To receive state bond funding, community college districts must submit project proposals to the Chancellor’s Office. The Chancellor’s Office ranks all submitted facility projects using the following five criteria adopted by the Board of Governors (in order of priority):
- Life‑safety projects, projects to address seismic deficiencies or risks, and infrastructure projects (such as utility systems) at risk of failure.
- Projects to increase instructional capacity.
- Projects to modernize instructional space.
- Projects to complete campus build‑outs.
- Projects that house institutional support services.
In addition, projects with a local contribution receive greater consideration. (Districts raise their local contributions mainly through local general obligation bonds.) Based on these criteria, the Chancellor’s Office submits capital outlay project proposals to the Legislature and Governor as part of the annual state budget process.
2017‑18 Budget Provides Planning Funds for 15 Projects. In the fall of 2016, the Chancellor’s Office recommended 29 projects to be included in the 2017‑18 budget. The 2017‑18 budget included $17 million for the preliminary planning phase of 15 of the 29 projects. Total state costs for these projects (all phases) are estimated to be $441 million. Total project costs including local contributions are estimated to be $676 million.
Chancellor’s Office Recommended 15 Projects for 2018‑19. Of the 15 projects, 13 projects were proposed but not funded last year and 2 projects were newly approved in the fall of 2017. Of the projects, the Chancellor’s Office ranked two in the highest‑priority category, four in the second highest‑priority category, five in the third category, and four in the fourth category. The 15 projects are estimated to have total state costs of $282 million.
Governor’s Proposals
Governor Proposes Funding Five New CCC Projects for 2018‑19. The administration proposes to fund five of the 15 projects submitted by the Chancellor’s Office. As Figure 40 shows, the Governor’s budget includes $4.7 million in Proposition 51 funds for initial planning costs. Total state costs for the five projects (including construction) are estimated to be $131 million. Of the five projects, one is in the highest‑priority category, two are in the second highest‑priority category, and two are in the fourth category. The project in the highest‑priority category, at College of the Redwoods, includes no local match. According to the administration, the remaining four projects were selected because they addressed priority issues and, in some cases, included a sizeable local match.
Figure 40
Governor’s Proposed CCC Capital Outlay Projectsa
(In Thousands)
|
College |
Project |
2018‑19 |
All Years |
|||
|
Phase |
State Cost |
State Cost |
Total Cost |
|||
|
Mount San Antonio College |
New Physical Education Complex |
P |
$1,634 |
$51,978 |
$65,284 |
|
|
College of the Redwoods |
Arts Building replacement |
P |
1,319 |
24,268 |
24,268 |
|
|
Golden West College |
Language Arts Complex replacement |
P |
763 |
23,740 |
46,870 |
|
|
Laney College |
Learning Resource Center replacement |
P |
761 |
24,699 |
76,480 |
|
|
Merritt College |
Child Development Center replacement |
P |
209 |
6,151 |
20,092 |
|
|
Totals |
$4,686 |
$130,836 |
$232,994 |
|||
|
aReflects only new projects entering the planning phase. Apart from the College of the Redwoods project, the other replacement projects appear to increase available space. P = preliminary plans. |
||||||
Budget Includes $55 Million for Previously Approved Projects. Of that amount, $40 million is Proposition 51 funding related to the cost of projects approved in 2017‑18. For 14 of the 15 projects approved last year, the appropriation reflects the cost of developing working drawings. For one project, which will be constructed using a design‑build approach, the budget includes the cost of both design and construction. The budget also includes $14 million in 2006 bond funds for the construction of an instructional building at Compton College. The project was initially approved by the state in 2014‑15 but has had delays in the design and review process.
Assessment
Proposed Projects Address Notable Problems. The project in the College of the Redwoods replaces a building currently located on an active fault. Two of the projects—at Coast Community College and Mount San Antonio College—replace buildings with foundation or seismic issues. The two remaining projects—at Laney and Merritt colleges—replace facilities at the end of their lifespans. These latter two projects would be primarily funded with district funds—another reason for their high prioritization.
Governor’s Proposal Too Small Relative to Voter‑Approved Bond Funding. The total state cost of the five proposed projects amounts to 7 percent of the CCC bond funding authorized in Proposition 51. Given a substantial backlog of facility projects at the community colleges, we see no justification for funding so few projects.
Recommendations
Consider Authorizing Additional Projects and Developing a Multiyear Plan. We recommend the Legislature consider authorizing more CCC projects than included in the Governor’s budget. A CCC facility project on average costs roughly $50 million. At this average cost, approving eight additional projects in 2018‑19 would cost $400 million, or 20 percent of the total bond authority granted by the ballot measure. At this rate, total bond authority would be committed over five years. In addition to authorizing more projects in 2018‑19, we recommend the Legislature develop a multiyear expenditure plan for remaining Proposition 51 funds. Such a plan would (1) help community colleges plan their capital outlay programs, (2) ensure that voter‑authorized funds are put to use within a reasonable time, and (3) spread bond sales over several years.
California Student Aid Commission
In this section, we provide an overview of the Governor’s budget for the California Student Aid Commission (CSAC). We then assess the Governor’s Cal Grant estimates and analyze his proposal to place conditions on the Cal Grant award for private nonprofit institutions. We end by assessing the Governor’s cost estimates for the Middle Class Scholarship program.
Overview
Governor Proposes $2.3 Billion for CSAC in 2018‑19. As Figure 41 shows, the Governor proposes an $80 million (3.6 percent) increase for CSAC over the revised 2017‑18 level. The largest increase is for Cal Grants ($71 million). The two main fund sources for CSAC are state General Fund and federal Temporary Assistance for Needy Families (TANF) funds. Under the Governor’s proposal, General Fund spending increases by $28 million (2.4 percent) and TANF funds increase by $52 million (5 percent).
Figure 41
California Student Aid Commission Budget
(Dollars in Millions)
|
2016‑17 Revised |
2017‑18 Revised |
2018‑19 Proposed |
Change From 2017‑18 |
||
|
Amount |
Percent |
||||
|
Expenditures |
|||||
|
Local Assistance |
|||||
|
Cal Grants |
$1,948 |
$2,090 |
$2,162 |
$71 |
3.4% |
|
Middle Class Scholarships |
74 |
100 |
102 |
2.2 |
2.2 |
|
Assumption Program of Loans for Education |
10 |
7 |
7 |
‑0.5 |
‑6.8 |
|
Chafee Foster Youth Program |
13 |
14 |
15 |
—a |
2.0 |
|
Student Opportunity and Access Program |
8 |
8 |
8 |
—a |
2.3 |
|
National Guard Education Assistance Awards |
2 |
2 |
2 |
— |
— |
|
Other Programsb |
1 |
1 |
1 |
—a |
‑26.0 |
|
Subtotals |
($2,056) |
($2,223) |
($2,297) |
($73) |
(3.3%) |
|
State Operations |
$16 |
$16 |
$22 |
$7 |
44% |
|
Totals |
$2,072 |
$2,239 |
$2,319 |
$80 |
3.6% |
|
Funding |
|||||
|
State General Fund |
$1,126c |
$1,172c |
$1,201 |
$28 |
2.4% |
|
Federal TANF |
926 |
1,043 |
1,095 |
52 |
5.0 |
|
Other federal funds and reimbursements |
17 |
18 |
18 |
—a |
0.2 |
|
College Access Tax Credit Fund |
4 |
6 |
6 |
—a |
1.5 |
|
aLess than $500,000. bIncludes Cash for College, Child Development Teacher/Supervisor Grants, Graduate Assumption Program of Loans for Education, John R. Justice Program, Law Enforcement Personnel Dependents Scholarships, and State Nursing Assumption Program of Loans for Education for Nursing Faculty. cReflects correction to remove double‑counting of College Access Tax Credit funding. TANF = Temporary Assistance for Needy Families. |
|||||
Cal Grants
Below, we provide background on the Cal Grant program and review the Governor’s cost estimates.
Background
State Has a Long History of Providing Cal Grants. The Cal Grant program traces its roots back to 1955, when the Legislature established a merit‑based, competitive State Scholarship program for financially needy students attending public or private institutions. In the late 1970s, the Legislature consolidated the State Scholarship program and other aid programs that it had created over the years into the Cal Grant program. In 2000, the Legislature restructured the Cal Grant program into a relatively large entitlement program for students meeting certain criteria, as well as a relatively small competitive program for students not meeting the entitlement criteria.
Entitlement and Competitive Programs Have Different Eligibility Criteria. To qualify for the entitlement and competitive programs, students must meet certain income and asset criteria (see Figure 42). In addition to financial criteria, the programs have certain age requirements. To qualify for the entitlement program, students must be recent high school graduates or transfer students under age 28. The competitive program generally is designed for older students. Both programs require a minimum grade point average (ranging from 2.0 to 3.0), except for one specific type of competitive award (the Cal Grant C, discussed further below).
Figure 42
Cal Grant Eligibility Criteria
2017‑18
|
Financial Eligibility Criteriaa |
|
Cal Grant A and C |
|
Family income ceiling: $88,900 to $114,300, depending on family size. |
|
Asset ceiling: $76,500. |
|
Cal Grant B |
|
Family income ceiling: $41,500 to $62,800, depending on family size. |
|
Asset ceiling: same as A and C. |
|
Other Major Eligibility Criteria |
|
High School Entitlement (Cal Grant A and B) |
|
|
|
Transfer Entitlement (Cal Grant A and B) |
|
|
|
Competitive (Cal Grant A and B) |
|
|
|
Competitive (Cal Grant C) |
|
|
|
aReflects criteria for dependent students. Different criteria apply to independent students (generally those over age 24). GPA = grade point average. |
Program Has Multiple Types of Awards. The Cal Grant program offers three types of awards (see Figure 43). One type, Cal Grant A, covers full systemwide tuition and fees at the public universities and up to a fixed dollar amount toward tuition costs at private colleges. The second type, Cal Grant B, covers tuition in all but the first year of college and provides additional aid to help pay for nontuition expenses, including books, supplies, and transportation. The third type of award, Cal Grant C, covers up to a fixed amount for tuition and provides aid for nontuition expenses for eligible students enrolled in CTE programs. A student generally may receive a Cal Grant A or B award for up to the equivalent of four years of full‑time study, whereas a Cal Grant C award is available for up to two years.
Figure 43
Cal Grant Award Amounts
2017‑18
|
|
|
Cal Grant A |
|
Tuition awards for up to four years. |
|
Full systemwide tuition and fees ($12,630) at UC. |
|
Full systemwide tuition and fees ($5,742) at CSU. |
|
Fixed amount ($9,084) at nonprofit and WASC‑accredited for‑profit colleges. |
|
Fixed amount ($4,000) for other for‑profit colleges. |
|
Cal Grant B |
|
Tuition coverage comparable to A award for all but first year. |
|
Up to $1,672 toward nontuition expenses for up to four years. |
|
Cal Grant C |
|
Up to $2,462 for tuition and fees for up to two years. |
|
Up to $1,094 at CCC and $547 at private colleges for nontuition expenses for up to two years. |
|
WASC = Western Association of Schools and Colleges. |
Cost Estimates
CSAC Estimates Cal Grant Caseload Based Largely on Previous Trends. Each fall and spring, CSAC estimates Cal Grant participation for the current year and budget year. For the current year, CSAC looks at how many awards have been offered to date and then assumes a certain percentage of these awards are paid based on recent paid rates. For the budget year, CSAC takes the current‑year estimate and projects it forward using various assumptions, such as the expected share of new awards converting into renewal awards and the attrition of existing renewal awards. For current‑ and budget‑year estimates, CSAC also includes the effects of any policy or administrative changes. For instance, CSAC includes the effects of any adopted or proposed tuition increases at the public universities as well as any administrative efforts to increase the number of awards that are paid.
Governor’s Budget Assumes Lower Spending in 2016‑17 and 2017‑18, Higher Spending in 2018‑19. The budget revises 2016‑17 Cal Grant spending down by $33 million (1.7 percent) and 2017‑18 spending down by $15 million (0.7 percent) to reflect updated cost estimates. Compared to the revised 2017‑18 level, the budget provides a $71 million (3.4 percent) increase for 2018‑19. The increase primarily is due to a projected 4.2 percent increase in participation. (Growth in participation tends to be higher than growth in overall costs because community college students receive a large share of the grants and their grant costs are relatively low.) The administration’s estimate for 2018‑19 does not assume any changes in tuition and fees, except for a $54 increase (4.8 percent) in UC’s Student Services Fee. Since the release of the Governor’s budget, CSAC has provided an updated Cal Grant estimate indicating costs in 2018‑19 could be $38 million higher than the Governor’s estimate. The administration likely will update its estimates to match the latest CSAC estimates in the May Revision.
Cal Grants for Students Attending Private Colleges
Below, we discuss the Governor’s proposal to tie certain Cal Grant funding for students attending private nonprofit colleges to certain conditions. We also discuss his proposal to reduce the Cal Grant award for students attending for‑profit colleges accredited by the Western Association of Schools and Colleges (WASC).
Background
Cal Grant Award for Students Attending Private Colleges Is Intended to Achieve Certain State Goals. The state provides financially needy students attending WASC‑accredited nonprofit and for‑profit colleges with Cal Grant awards to help them cover the costs of their education. The state originally had various goals in offering these Cal Grant awards. First, the state wanted to provide low‑income students with the choice to attend private college. Second, having some students select private colleges eased up capacity issues at UC and CSU. (This was of particular concern during certain decades, such as the 1960s, when the state was seeing large growth in the number of college‑age students.) Lastly, the awards potentially provided state savings because the Cal Grant cost less than what the state would have paid had the student attended a public college.
Historically, WASC‑Accredited Private Award Linked to Costs at UC and CSU. Prior to the restructuring of the Cal Grant program in 2000, state law called for the maximum WASC‑accredited private award to be set by adding together (1) 75 percent of the state General Fund cost per CSU student and (2) the average of the tuition and fees charged by UC and CSU. (The state pays tuition and fees for low‑income students attending UC and CSU.) The policy served as an aspirational goal against which to measure state funding. In 1997‑98, for example, the state met 97 percent of the statutory goal. As part of the Cal Grant program restructuring in 2000, the Legislature removed these provisions from state law.
Current Law Lowers WASC‑Accredited Private Award Beginning in 2018‑19. As a savings measure, the 2012‑13 budget amended state law to lower the WASC‑accredited private award from $9,084 to $8,056 starting in 2014‑15. Subsequent budget actions have postponed the reduction. Most recently, the 2017‑18 budget delayed the reduction until 2018‑19 and added statutory language that WASC‑accredited private colleges participating in the Cal Grant program make a good faith effort to enroll more low‑income students, enroll more transfer students, and offer more online courses. The budget requires these institutions to report on progress towards meeting these goals by March 15 of each year.
Governor’s Proposals
Governor Proposes to Maintain Private Nonprofit Award if Sector Meets Specific Transfer Enrollment Target. The budget includes $7.9 million to maintain the private nonprofit award at $9,084 ($1,028 higher than the otherwise reduced level of $8,056). To be able to receive the $1,028 differential in 2019‑20, the Governor proposes to add a requirement that the sector in 2018‑19 accept at least 2,500 transfer students who have earned an ADT. (The nearby box provides information about the ADT.) This would equate to almost one‑third of the total transfers that private nonprofit institutions currently accept. The Governor proposes to increase the expectation to 3,000 in 2020‑21. Beginning in 2021‑22, the target changes to become based on the percent change in the number of total transfers the sector admitted in the prior year. For example, if the sector increases overall transfer enrollment by 3 percent in 2021‑22, then it would be expected to grow ADT enrollment by 3 percent in 2022‑23. The Governor indicates that this proposal is part of a broader effort to make transfer easier across all segments and improve timely completion rates for transfer students.
Associate Degree for Transfer
Degree Designed to Create Clearer Pathways From California Community Colleges to California State University (CSU). Although students being able to transfer from community colleges to universities is a core feature of the state’s higher education system, transferring has been a longstanding problem. Historically, transfer students often had to navigate through a maze of requirements that varied by campus. To improve the transfer process, the state enacted the Student Transfer Achievement Reform Act in 2010. A key feature of the reform required community colleges to develop two‑year (60 unit) degrees known as associate degrees for transfer (ADT). Students who earn such a degree are guaranteed admission into a CSU bachelor’s degree program that can be completed within an additional two years (60 units) of upper‑division coursework. Students receiving an ADT get priority admission to their local CSU campus in a degree program that is similar to their ADT major. The University of California (UC) is not required to recognize the ADT or give priority admission to ADT students. Instead, UC adopted its own transfer pathways.
Number of Students With ADT on the Rise. The number of students attaining ADT has grown markedly, from fewer than 1,000 students earning the degree in 2011‑12 to over 30,000 earning the degree in 2016‑17. Despite the large growth, the vast majority of transfer students do not have an ADT. In 2016‑17, just under half of community college students transferring to CSU had the degree, with the remainder having a more traditional associate degree.
CSU Enrolls Vast Majority of Students With ADT. In 2017, CSU admitted 98 percent of ADT recipients. Based on outcome data from the first cohort of students that completed an ADT and transferred to CSU, about 50 percent graduated from CSU in two years.
Proposal Reduces Award for Students at WASC‑Accredited For‑Profit Colleges. The Governor proposes to reduce the Cal Grant award for students attending WASC‑accredited for‑profit institutions—providing $8,056 for those students instead of the higher $9,084. This proposal would likely affect five institutions. The Governor’s budget recognizes $600,000 in total associated savings.
Assessment
Private Nonprofit Award Has Student and State Benefits. Throughout its history, the Cal Grant program has provided aid to financially needy students attending either public or private institutions, thereby providing more choice over college campus and program. At times, the state also has used the Cal Grant program to incentivize students to attend private colleges in order to alleviate enrollment pressures at the public segments. The state also attains both operational and capital savings if a student attends a private rather than public college.
Unclear Whether Proposal Is Addressing an Actual Problem. The Governor provides no data indicating that problems exist with the number of overall transfer students or ADT students that private nonprofit institutions currently accept. He also does not provide data indicating that private nonprofit institutions have inadequate transfer pathways or that their transfer students do not graduate in a timely manner. We have concerns with proposing a very specific solution without first substantiating that a problem exists.
Proposal Deemphasizes Longstanding Overriding Cal Grant Goals in Exchange for One Very Specific Goal. The Governor’s proposal departs notably from the original, overarching goals of the Cal Grant program to provide more choice for low‑income students, greater overall capacity in the state’s higher education system, and lower overall state costs. The proposal to tie a portion of the Cal Grant to a very specific transfer‑focused goal represents a significant policy change. Additionally, this one very specific goal may not be compatible with the mission of some nonprofit colleges. For example, some nonprofit colleges focus on specific disciplines, such as art or music, and rely on small four‑year cohort approaches. These programs do not intend to focus on transfer, yet they can provide low‑income students access to types of college programs not offered within the public system. Additionally, the private sector was not part of the ADT authorizing legislation or included in the ADT development efforts. Years later, tying the Cal Grant for low‑income students attending the private sector to ADT requirements could be viewed as arbitrary.
Proposal Has Poor Approach to Accountability. Even if data showed a problem did exist and tying strings to the award were deemed reasonable, we believe the Governor’s particular approach to accountability has notable shortcomings. Some nonprofit colleges might increase their ADT enrollment significantly yet still lose Cal Grant funding because the sector overall does not meet its ADT target. Conversely, some colleges might not increase their ADT enrollment yet continue receiving Cal Grant funding. Though a statewide organization advocates on behalf of nonprofit colleges, the institutions are very diverse and do not have a central governing body that can hold them accountable for not meeting certain state requirements. Of equal concern is that if the overall sector does not meet its ADT target, all financially needy students attending private nonprofits will lose a portion of their Cal Grant award. Although the Governor proposes to grandfather in higher grant awards for students that enter the institutions in a year that the sector meets its targets, students that enter in a year that the sector does not meet its target would receive a lower grant amount. We believe these types of repercussions could be viewed as unreasonable.
No Clear Rationale for Reducing Cal Grant Award for Students Attending WASC‑Accredited For‑Profit Colleges. The administration was unable to provide justification for reducing the Cal Grant award for WASC‑accredited for‑profit colleges. We compared graduation rates and student loan default rates for the five WASC‑accredited for‑profit colleges with the averages for nonprofit colleges and CSU campuses. The WASC‑accredited for‑profit colleges’ graduation rates are on average lower than nonprofit colleges but higher than CSU campuses. Regarding default rates on student loans, their rates on average are about 1 percentage point higher than nonprofit colleges and CSU campuses. Unless the administration can make a compelling case that the WASC‑accredited schools are of notably lower quality using some other meaningful indicators, we question why financially needy students attending them should have their state financial aid reduced.
Recommendations
Recommend Legislature Reject Governor’s Proposals. We recommend the Legislature reject the Governor’s proposal to place conditions on a portion of the Cal Grant award for financially needy students attending private nonprofit institutions. We also recommend the Legislature maintain the existing Cal Grant award amount for financially needy students attending WASC‑accredited for‑profit institutions. We encourage the Legislature to continue upholding the overarching policy goals of the Cal Grant award for financially needy students attending private institutions—choice of campus and program, capacity of the overall higher education system in the state, and state savings.
Recommend Using Former State Policy to Set Award Amount. The Cal Grant award amount for students attending WASC‑accredited private colleges has been flat at $9,084 for six years. As the real value of the award amount has eroded, student choice also appears to be eroding. Cal Grant data show that nonprofit awards as a share of total Cal Grants has been declining in recent years. Whereas over 20 percent of all Cal Grant recipients attended a nonprofit college in 2001‑02, 11 percent attend today. To improve students’ buying power and choice, we recommend the Legislature increase the Cal Grant award for students attending these institutions. In setting the award amount, we recommend the Legislature use the state’s historic Cal Grant formula for private colleges.
Under Policy, Updated Aspirational Award Amount Would Be $16,500. If the Legislature were to use the statutory policy for private awards in effect prior to 2000, the aspirational award amount would be $16,500. The Governor’s proposed 2018‑19 award amount of $9,084 equates to 55 percent of that aspirational level. The Legislature could determine the exact adjustment to make to the award in 2018‑19, potentially adopting a multiyear plan to ramp up the award over time. For example, if the state wanted to reach the target of $16,500 in five years (making equal progress each year), the 2018‑19 award amount would be $10,300—at an additional state cost of $43 million relative to the Governor’s budget.
Middle Class Scholarships
Middle Class Scholarships for Students Attending Public Universities Started in 2014‑15. Under the program, students with household incomes and assets each under $171,000 may qualify for an award that covers a portion of their tuition and systemwide fees (when combined with all other public financial aid). CSAC provides these scholarships to eligible students who fill out a federal financial aid application, though the program is not need‑based according to the federal government’s financial aid formula. Unlike Cal Grants, the program is not considered an entitlement and the program funding level is capped in state law. If funding is insufficient to cover the maximum award amounts specified in law, awards are pro‑rated downward. Current state law appropriates $96 million for 2017‑18, increasing to $117 million in 2018‑19, with funding capped at $117 million thereafter.
Governor Assumes Higher Spending in 2017‑18 and 2018‑19. The Governor revises estimated Middle Class Scholarship costs upward in 2017‑18 by $3.9 million (4 percent). Compared to the revised 2017‑18 level, the Governor projects a $2.2 million increase in 2018‑19 to reflect an estimated 2 percent increase in program participation. In total, he estimates 53,250 students will receive grants in 2018‑19 (9,600 at UC and 43,650 at CSU). The Governor’s proposed trailer bill modifies state law to match the Governor’s budget estimates in 2017‑18 and 2018‑19, but the cap of $117 million is left in place for future years. We think all these proposed adjustments are reasonable.
Summary of Recommendations
University of California
- Determine which University of California (UC) cost increases to support in 2018‑19 and consider sharing these cost increases between the state, nonfinancially needy California students, nonresident students, and other savings and fund sources.
- Use UC’s planned programmatic reductions and redirections as a starting point to fund enrollment growth in 2018‑19.
- Make enrollment growth decisions for 2019‑20 consistent with any broader decision regarding UC eligibility pools.
- If UC is unable to attain a 2‑to‑1 transfer ratio at each campus, consider establishing a systemwide ratio to give UC more flexibility to meet the target while still ensuring transfer access. Also encourage UC to pursue efforts to simplify the transfer process and accelerate time to degree for entering transfer students.
- Signal to UC that funding for its academic quality initiatives is a lower priority for 2018‑19. Were the Legislature interested in providing additional funds for more targeted purposes, specify the use of the funding in the budget act.
- After making decisions regarding eligibility, direct UC to develop a systemwide enrollment plan that includes (1) enrollment projections based on anticipated demographic changes and eligibility criteria, (2) strategies to maximize the use of existing facilities across the system before adding new space, and (3) clear justification for the need to add space within the system.
- Direct UC to report on construction costs per square foot and explain any variation in these costs for the same type of space across campuses. To the extent UC is unable to provide sufficient justification for the differences contained in its four 2018‑19 proposals for new academic buildings, we recommend the state withhold authorization of those projects.
- Require UC to develop a long‑term plan to (1) retire its maintenance backlog and (2) improve its ongoing maintenance practices moving forward to prevent a backlog from reemerging.
- Direct UC to report in spring hearings on its current efforts to reduce pressure for new physical library storage space and expand its digital collections.
California State University
- After deciding which California State University (CSU) cost increases to support, consider sharing those cost increases between the state and students.
- Take into account several demographic‑ and policy‑related factors when deciding on an overall enrollment target for CSU in 2018‑19.
- To help address K‑12 staffing shortages in special education, recommend the Legislature provide $675,000 in targeted enrollment funding for CSU’s occupational therapy and speech and language pathology graduate programs. Funding equates to 5 percent growth or 45 additional full‑time equivalent students. The Legislature could continue funding growth in these two graduate programs over the next several years.
- Recommend the Legislature signal to the Chancellor’s Office that its draft admissions policy concerning local students and impacted programs is inconsistent with legislative intent. If the Legislature finds that the subsequent draft policy also fails to meet legislative intent, recommend the Legislature specify its preferred new policy in statute.
- Given numerous opportunities for CSU to improve efficiencies and more strategically allocate existing resources, suggest the Legislature place a lower priority on providing additional funding for the Graduation Initiative in 2018‑19.
- Recommend the Legislature direct CSU to rewrite its 2018‑19 capital outlay project proposals and resubmit them by early March 2018. Should CSU fail to provide an acceptable and compelling set of new proposals in time, recommend the Legislature remove $13 million from CSU’s base budget and redirect the funds for other legislative priorities.
- Recommend the Legislature direct CSU to include a standard set of information in all future capital outlay proposals submitted to the Legislature.
- Given other state funding priorities in 2018‑19, recommend the Legislature reject the Governor’s proposal to provide $100,000 in ongoing General Fund support for the Education Policy Fellowship Program.
California Community Colleges
- Allocate less apportionment funding based on enrollment. The Governor’s proposal to allocate about half of apportionment funding based on enrollment seems reasonable.
- Allocate at least 20 percent of apportionment funding based on performance to ensure sufficiently strong incentives to focus on performance.
- Adopt Governor’s proposed performance measures but provide higher levels of funding for the outcomes of low‑income students and relatively expensive programs meeting student needs (such as some career technical education programs).
- Collapse proposed supplemental grant funding and existing categorical funding for low‑income students into one larger pot of funding.
- Attach few spending requirements to new supplemental pot of funding but require districts to document clearly in their annual budgets how they intend to serve low‑income students.
- Task the Chancellor’s Office with monitoring the approval of new program awards, grade‑related data, and changes in the types of degrees and certificates awarded to ensure the new funding system is working as intended.
- Wait until early May for updated enrollment estimates and then adjust apportionments for 2017‑18 and 2018‑19 accordingly. Given recent California Community Colleges (CCC) enrollment trends, enrollment growth funding is unlikely to be needed in the budget year. The Legislature could begin considering how to repurpose any associated freed‑up funding.
- Consider various ways to improve online education within the existing CCC system. Options include adopting alternative funding models to encourage competency‑based instructional approaches, running a competitive grant program for colleges to develop specific online courses that currently are unavailable, and funding more training for faculty and staff willing to teach and support students in online programs.
- Take time to consider whether to authorize a new online community college. Gather information about what underlying problems exist, what are the root causes of those problems, how a new online college could be designed to respond to those issues, and how a new college could be funded and held accountable for meeting its objectives.
- Reject proposal to provide Apprenticeship programs with $31 million for prior‑year costs.
- Approve $23.6 million ongoing augmentation ($5.8 million more than the Governor’s budget) to cover all projected apprenticeship hours in 2018‑19.
- Reject proposal to allow community colleges to earn credit funding rate for apprenticeship instruction they now provide at the regular noncredit hourly rate.
- Reject proposal to consolidate two community college financial aid programs that help cover living costs for some full‑time students.
- Recommend Legislature take a more straightforward approach to providing financially needy full‑time students with aid for living costs. Specifically, consolidate all four existing state aid programs covering a portion of some CCC students’ living expenses into one program with one set of rules.
- As covering all unmet need for all financially needy full‑time CCC students would cost about $500 million compared to the $287 million earmarked for such aid under the Governor’s budget, consider how to ration awards or repurpose other funding to cover the full estimated program cost.
- Adopt Governor’s deferred maintenance proposal, as the funding would help address CCC’s large maintenance backlog.
- Reject $20 million innovation awards proposal. Rather than providing large sums to a small number of colleges to implement local initiatives, focus on ensuring existing CCC student success programs are implemented effectively.
- Consider authorizing more capital outlay projects than included in the Governor’s budget. At an average facility cost of $50 million, approving eight additional projects in 2018‑19 would cost $400 million, or 20 percent of the total CCC bond authority granted by Proposition 51.
- Develop a multiyear expenditure plan for remaining Proposition 51 funds.
California Student Aid Commission
- Reject Governor’s proposal to place conditions on a portion of the Cal Grant award for financially needy students attending private nonprofit institutions. Focus instead on upholding the overarching goals of the program, including expanding low‑income students’ college choices.
- Maintain existing Cal Grant award amount for financially needy students attending for‑profit institutions accredited by the Western Association of Schools and Colleges.
- Use former state policy for setting Cal Grant award amount for students attending private institutions.