LAO Contact

February 27, 2018
History of Special Education Funding in California
The state allocates the bulk of funding for K-12 education through per-student grants that local educational agencies may use for any educational purpose. In addition, the state allocates funding to these agencies specifically for special education services. On a longstanding basis, special education funding has been the second largest allocation the state provides to these agencies. This post traces the history of state special education funding in California. It is divided into two sections. In the first section, we describe the three approaches California has used to allocate most special education funding. In the second section, we describe various special education add-ons and trace the history of each of these add-ons.
Most Special Education Funding
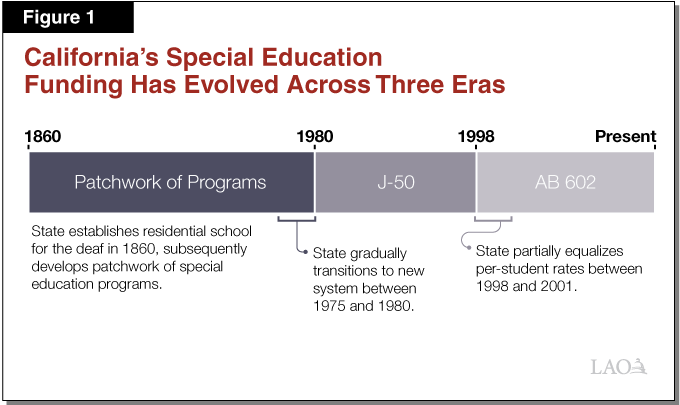
Below, we discuss the history of how the state has allocated most special education funding. As Figure 1 depicts, these allocations have gone through three distinct eras. First, between 1860 and 1980 the state created a patchwork system of special education categorical programs mostly based on specific types of disabilities. Second, in 1980 the state introduced a somewhat simpler funding formula—commonly referred to as J-50—that was based on the types of services provided. Finally, in 1998 the state introduced an even simpler formula commonly known as AB 602 that is based on total student attendance.
1860‑1980: A Patchwork System Based Largely on Type of Disability
State Has Long Operated Residential Schools for Certain Students With Disabilites. Since 1860, California has operated residential schools for students who are blind or deaf. Originally, these schools were the only instructional option for students with these conditions. As the state began funding districts to serve such students locally, the state residential schools increasingly assumed more specialized roles. Today, the two California Schools for the Deaf offer instruction exclusively in sign language (whereas most local programs incorporate spoken language), and the California School for the Blind primarily offers short-term instruction to students lacking the basic skills necessary to succeed in local programs.
State Gradually Created Complex System of Categorical Programs. Between 1920 and 1975, the state created almost a dozen special education categorical programs. By 1975, the state had 11 programs, each with distinct funding rates, eligibility, and programmatic requirements (see Figure 2). For example, students with physical disabilities could receive one or more of six specified services, each of which was funded at a different rate. Complicating matters further, some services could be funded either at a set per-classroom amount or a per-student amount. Some of the programs (such as those serving students with intellectual disabilities) were mandatory for certain local educational agencies to administer, whereas other programs (such as those focused on students with specific learning disabilities) were optional.
Figure 2
State Had Array of Special Education Programs Before 1980
|
Disability |
Type of Service |
Funding Provided Per: |
Optional or Mandatory? |
|
Specific learning disability |
Learning groups |
Class or ADA |
Optional |
|
Mainstream or special day classes |
ADA |
Optional |
|
|
Home or hospital instruction |
ADA |
Optional |
|
|
Intellectual disability |
Programs for mild disabilities |
Class or ADA |
Mandatory |
|
Programs for severe disabilities |
Class or ADA |
Mandatory |
|
|
Physical disability |
Special day classes |
Class or ADA |
Mandatory |
|
Individual instruction |
ADA |
Mandatory |
|
|
Mainstream classes |
ADA |
Mandatory |
|
| Adapted physical education |
ADA |
Mandatory |
|
|
Other specialized instruction |
Class or ADA |
Mandatory |
|
|
Transportation |
Miles traveled |
Mandatory |
|
|
ADA = average daily attendance. |
|||
Earliest System Had Three Major Shortcomings. The state’s patchwork system of categorical programs had three primary weaknesses:
Because some programs were optional and some disabilities were not covered by any program, some students with disabilities did not receive special education services.
Administrators had difficulty navigating the wide array of program requirements. For example, for special day classes for students with physical disabilities, maximum class size varied based on students’ ages and specific disabilities, ranging from a class size of 6 for young students who were deaf to a class size of 16 for older students who were orthopedically impaired.
The system encouraged schools to identify students with whichever disability generated the most funding rather than whichever best described their specific challenges.
1980‑1998: A Somewhat Simpler, Expanded System Based on Services Provided
State and Federal Law Guarantee Special Services to All Students With Disabilities. To address these weaknesses, the state overhauled its special education policies between 1975 and 1980. In 1975, California developed its Master Plan for Special Education, which notably expanded the types of services schools were required to provide students with disabilities. In that same year, Congress passed what we now know as the Individuals with Disabilities Education Act (IDEA). For the first time, both state and federal law guaranteed special services to all students with disabilities. The changes in services initiated by these changes in law took place gradually, with certain requirements first applied to certain regions in the state and then eventually extended statewide by 1980.
State Organized Districts Into Special Education Local Plan Areas (SELPAs). Under California’s original system of special education categorical programs, large districts generally provided direct services for their students with disabilities, whereas county offices of education generally served students on behalf of smaller districts. This bifurcated system of responsibilities recognized a longstanding concern that smaller districts lacked the resources to provide a full array of services to students with disabilities. California’s Master Plan for Special Education addressed this concern by requiring all districts to join SELPAs, each of which was responsible for coordinating special education among its member districts. A large district could be its own SELPA, whereas smaller districts were required to partner with neighboring districts and/or county offices of education to form a collaborative SELPA. (California continues to use the SELPA model.)
State Based Funding on Specific Services Provided. The Master Plan for Special Education also introduced a simplified funding system commonly referred to as the J-50 system (after the associated compliance form). As Figure 3 shows, this system was based on three types of special education services. The first was special day classes—that is, classrooms attended only by students with disabilities. The second was resource specialists—that is, teachers who provided pull-out instructional support to students with disabilities who spent most of their time in mainstream classrooms. The third was “designated instruction and services”—that is, services provided by specialists and commonly wrapped around instruction (for example, physical therapy). Under this new funding system, schools received one rate for each special day class they operated (regardless of class size), another rate for each resource specialist, and another for each employee providing designated instruction and services. Each of these employees had a target maximum caseload. For example, when a SELPA’s special day classes exceeded an average of 10 students, the SELPA became eligible for additional special day class funding (provided sufficient funding was available at the state level).
Figure 3
State Introduced Somewhat Simpler Funding System in 1980
|
Type of Service |
Description |
|
Special day class |
Class attended only by students with disabilities |
|
Resource specialist |
Additional instruction for students with disabilities served in mainstream classrooms |
|
Designated instruction and services |
Services typically provided in addition to instruction (for example, physical therapy) |
Funding System, Though Simple in Theory, Proved Complicated and Problematic in Practice. In theory, the J-50 system simplified special education funding by replacing 11 state-funded special education programs with 3 programs. In practice, it replaced one set of complications with another. Most notably, the system established unique funding rates for each SELPA based on a statewide survey of special education costs in 1979‑80. Though these rates closely tracked special education costs the first few years after 1980, the state’s failure to update its cost survey resulted in seemingly arbitrary funding inequities by the mid-1990s. Additional complications related to (1) caps on the total number of students that could be funded for each type of instructional service and (2) calculations to determine when units should be awarded or “recaptured” from SELPAs respectively that were experiencing growth or declines in their special education populations.
Funding System Also Limited Instructional Innovation. Funding rates under the J-50 system were based on the cost of specific services common to special education in the late 1970s. Although these services were common at that time, they no longer reflected the full range of services offered nationwide by the mid-1990s. Most notably, the funding generated for serving students with disabilities in mainstream classrooms was intended only to cover students with relatively mild disabilities, as very few students with severe disabilities were served in mainstream classrooms in the mid-1970s. Consequently, the J-50 system encouraged schools to serve students with severe disabilities in special day classes.
1998-Present: A Simpler System Based on Overall Attendance
New Funding System Intended to Simplify and Encourage Innovation. Since 1998, the state has funded SELPAs based on their overall student attendance, regardless of how many students they serve in special education, the specific disabilities of those students, or what types of services those students receive. The state hoped this new funding system (commonly referred to as AB 602, after its enacting legislation) would eliminate the complexity and bad incentives characterizing the J-50 system.
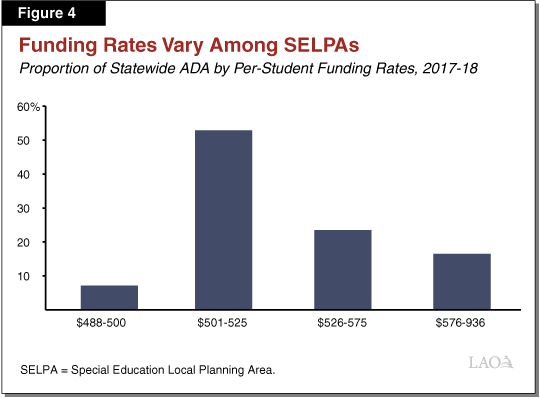
State Made Efforts to Gradually Equalize Funding, but Rates Remain Unequal. When the AB 602 system was first introduced, the state set each SELPA’s per-student funding rate equal to its total funding in the last year under the J-50 system divided by its total student population in that year. Because funding rates varied notably under the J-50 system, the new rates established under AB 602 also varied notably. In an effort to equalize these rates, the state established a statewide target rate equal to the average special education per-student funding rate. In tandem, it allocated funding in the late 1990s and early 2000s to bring SELPAs below the statewide target rate up to the target. In addition, regular funding increases for all SELPAs due to either growing student attendance or the statewide cost-of-living adjustment were based on the statewide target rate rather than SELPAs’ unique per-student funding rates. All of these actions worked to lessen the differences among per-student funding rates. The state, however, has provided no additional funding to equalize per-student rates since 2000-01 and rates continue to vary notably (see Figure 4).
Attendance-Based Funding Largely Realized State’s Policy Goals. Although funding rates remain unequal, AB 602 has largely realized the state’s original goals of simplifying funding and encouraging instructional innovation. Regarding simplicity, schools no longer complete complicated paperwork based on intricate formulas before they receive state funding. Regarding innovation, about 30 percent of students with severe disabilities were served in mainstream classrooms in 2016-17 compared with about 15 percent of such students in 1997-98.
Special Education Funding Add-Ons
In addition to the bulk of special education funding discussed above, the state has long maintained an array of special education add-on programs. Though add-ons change more frequently than the rest of special education funding, four of the state’s current add-ons date back at least two decades. Two of these add-ons are linked to specific types of special education services, one is linked to counts of students with specific types of disabilities, and one is linked to sparsely populated regions. Below, we trace the history of each of these add-ons. (In this section. we exclude special education funding for infants and toddlers, which we cover in depth in our report, Evaluating California’s System for Serving Infants and Toddlers With Special Needs. We also exclude funding for employment training and job placement for students with disabilities, which we intend to examine in the future.)
Mental Health Services
Counties, Not Schools, Were Once Responsible for Student Mental Health. Between 1984 and 2011, state law held county mental health departments primarily responsible for providing mental health services to students in special education. To fund these services, the state provided counties with some categorical funding and reimbursed any excess costs through the mandate claims process. Though this system (commonly referred to as AB 3632, after its enacting legislation) was intended to provide students with higher quality mental health services, it was long criticized due to poor coordination between schools and county mental health departments.
State Now Provides SELPAs Categorical Funding for Mental Health Services. In 2011-12, the state shifted responsibility for providing student mental health services from county mental health departments to schools. In tandem with shifting the responsibility, the state created a new associated categorical program. In creating the new program, the state also augmented associated funding. Under the new categorical program, funding is distributed to SELPAs according to overall student attendance. Funding is restricted for use on mental health-related special education services, including hiring psychologists and purchasing counseling materials.
Nonpublic Schools
Nonpublic Schools (NPS) Serve Some Students With Disabilities. NPS are privately operated agencies contracted by public schools to provide special education services. Typically, NPS specialize in serving students with particularly severe disabilities, and thus are more expensive than most other special education services. In some cases, NPS are residential schools serving students from many regions. Some California students even are placed in NPS located in other states. Because NPS placements—in particular, out-of-state residential placements—can result in unusually high per-student costs, the state traditionally has provided some funding specifically for these placements.
State Previously Funded NPS Placements With Two-Tiered Reimbursement Model. Between 1975 and 1998, the state funded NPS placements using a reimbursement model. For most students placed in NPS, the state reimbursed SELPAs 70 percent of associated costs. The 70 percent reimbursement rate was intended to ensure administrators would only place students in an NPS when absolutely necessary, with fiscal incentives in certain cases to serve these students in their neighborhood schools. For students residing in Licensed Children’s Institutions (LCIs), the state reimbursed at a 100 percent of NPS placement costs. LCIs are residential facilities serving foster children or children with exceptional needs. The 100 percent reimbursement rate recognized SELPAs often have little choice in how children residing in LCIs are served, as LCIs often operate their own on-site NPS and require all resident children to attend that NPS. In these cases, SELPAs typically do not have the opportunity to instead serve these students in neighborhood schools.
State Now Operates an NPS Extraordinary Cost Pool…In 1998, California stopped providing a 70 percent reimbursement rate for most NPS placements. Instead, SELPAs were expected to cover the cost of NPS placements using their AB 602 per-student funding rates. The state, however, continues to reimburse directly for extraordinarily expensive NPS placements (for example, out-of-state residential placements for students). It provides these reimbursements through a statewide extraordinary cost pool, which only covers costs in excess of a specified statutory threshold.
…And Provides Additional Funding for Students Likely to Be Placed in NPS. Though the state stopped providing reimbursements for most NPS placements in 1998, it continued to provide a 100 percent NPS reimbursement for students in LCIs until 2003-04. In that year, the state introduced the Out-of-Home Care formula, which provides additional funding to SELPAs based on the number of students they serve who reside in specific types of LCIs, with LCIs serving students with relatively severe needs generating more funding than those serving students with relatively mild needs. Beginning in 2016-17, the state made major changes that effectively rendered the Out-of-Home Care formula obsolete. In the past few years the state has continued to provide Out-of-Home Care funding, but each SELPA’s funding allocation has remained frozen while the state considers new allocation options.
Low-Incidence Disabilities
State Allocates Some Funding Based on the Counts of Students With Specific Disabilities. State law defines students who are deaf, hard of hearing, visually impaired, or orthopedically impaired as having “low-incidence” disabilities. Students with these disabilities typically account for roughly 0.5 percent of all K-12 students. Students with low-incidence disabilities often require relatively expensive support. To help SELPAs cover the higher costs of serving these students, the state has allocated some funding based on the number of students with low-incidence disabilities since 1985-86. Though these funds were initially restricted for use on adaptive materials, they can now be spent on either materials or services for these students.
Sparsely Populated Regions
State Allocates Additional Funding to Sparsely Populated Regions. SELPAs serving sparsely populated regions typically experience unusually high per-student special education costs for two reasons. First, these schools have unusually high transportation costs because their staff might spend hours each week travelling between school sites or their students might be bussed long distances to receive services. Second, these schools often employ specialists with unusually small caseloads. Recognizing these exceptional costs, the state has allocated additional funding to sparsely populated regions since 1990. Specifically, the state distributes additional funding to Necessarily Small SELPAs, defined as any countywide SELPA serving fewer than 15,000 students overall. Currently, the state has 19 such SELPAs. These SELPAs receive add-on funding based upon a formula that provides the largest amount of additional funding to the smallest SELPAs. SELPAs can use this funding for any special education expense.
Conclusion
California’s current system for allocating special education funding reflects a long history of gradual improvements to earlier systems. Before changing the existing system, we encourage the Legislature to be cognizant of prior reforms and consider their primary objectives—most notably, simplifying funding rules, improving incentives to identify and serve students appropriately, and having strong justification for any variation among per-student funding rates.