Analysis of the 2001-02 Budget BillLegislative Analyst's Office
|
As discussed in "Part I," we are forecasting that General Fund revenues in the current and budget year combined will exceed the administration's forecast by $235 million. This difference reflects both the positive effects of recent strong cash receipts on current-year receipts and the negative effects of the projected 2001 slowdown in California's economic growth on budget-year receipts.
This part provides background information relating to the revenue side of the budget, summarizes the budget's revenue forecast, and discusses our own revenue forecast and how it compares to the administration's.
The budget projects that California state government will collect an estimated $97 billion in taxes and other revenues in 2001-02. As indicated in Figure 1, over four-fifths of these revenues are deposited into the General Fund, where they are allocated through the budget process each year for such purposes as K-12 and higher education, health, social services, criminal justice, and resources programs. The remaining one-fifth of revenues is deposited into numerous special funds, where they are earmarked for specific purposes. For example, motor vehicle fuel taxes support transportation programs, most tobacco taxes support a variety of targeted health programs, and vehicle license fees (VLFs) are allocated to local governments. Some taxes, such as the sales and tobacco taxes, are distributed amongst both the General Fund and special funds.
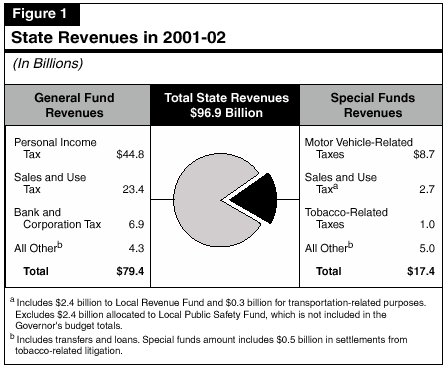
General Fund Revenues Dominated By the "Big Three" Taxes. Almost 94 percent of General Fund revenues (and over three-fourths of all state revenues) are attributable to three major taxesthe personal income tax (PIT), sales and use tax (SUT), and bank and corporation tax (BCT). Of these, the PIT is by far the largest, accounting for about 57 percent of the General Fund total. The remaining 6 percent of revenues is attributable to a variety of smaller taxesincluding the insurance, estate, tobacco, and alcoholic beverage taxesas well as investment earnings and such other sources as asset sales and unclaimed property receipts.
Tax receipts are primarily influenced by changes in the state's economy, although other factors, such as law changes and soaring stock market values, have also played a significant role in recent years. Figure 2 shows total state revenues, General Fund revenues, and special funds revenues over the past decade, in both current-dollar and "real" (that is, inflation-adjusted) terms.
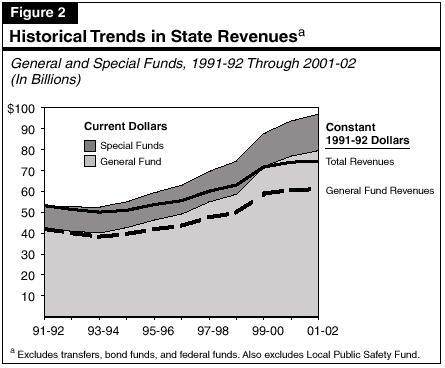
The figure shows that revenue growth lagged in the first half of the 1990s, as the state's recession took a severe toll on California personal income, taxable sales, and corporate profits. Revenues began to pick up in 1995-96, and have soared in recent years due to both the state's healthy economic expansion and increasing stock market values (which boosted capital gains and stock options on PIT returns).
Based on the budget's estimates, total state revenues between 1995-96 and 2000-01 will have increased 58 percent, or 38 percent after adjusting for inflation. These increases occurred despite substantial reductions to the VLF, large increases in the PIT dependent exemption credits, and a variety of targeted reductions involving the PIT and the BCT. During the same period, the General Fund increase will be about 66 percent (45 percent in inflation-adjusted terms), with one-third of that increase occurring in 1999-00 alone.
Figure 3 summarizes the budget's General Fund revenue outlook for 2000-01 and 2001-02.
| Figure 3 | |||||
| Summary of the Budget's General Fund Revenue Forecast | |||||
| 1999-00 Through 2001-02 (Dollars in Millions) | |||||
| 2000-01 | 2001-02 | ||||
| Revenue Source | Actual 1999-00 |
Amount | Percent Change |
Amount | Percent Change |
| Personal Income Tax |
$39,575 |
$43,305 | 9.4% | $44,810 | 3.5% |
| Sales and Use Tax a |
21,137 |
21,980 | 4.0 | 23,441 | 6.6 |
| Bank and Corporation Tax |
6,639 |
6,865 | 3.4 | 6,931 | 1.0 |
| Insurance Tax |
1,300 |
1,330 | 2.3 | 1,353 | 1.7 |
| Other taxes |
1,378 |
1,408 | 2.2 | 1,457 | 3.5 |
| Other revenues b |
1,523 |
1,998 | 31.7 | 1,358 | -32.0 |
| Transfers |
379 |
13 | — | 84 | — |
| Totals | $71,931 | $76,899 | 6.9% | $79,434 | 3.3% |
| a Includes diversion of $500 million in 2000-01 for transportation purposes and a quarter-cent rate reduction for calendar year 2001. | |||||
| b Includes tobacco settlement receipts of $515 million in 1999-00 and $393 million in 2000-01, plus $163 million from one-time asset sales in 2000-01. | |||||
Current-Year Forecast. After soaring by more than 22 percent in 1999-00, revenues are projected by the administration to rise another 6.9 percent this year, to $76.9 billion. After eliminating the effects of recent and proposed tax relief, diversions, and transfers of receipts between funds, the underlying increase in current-year revenues is a bit stronger8.6 percent. The main factors behind this positive current-year revenue performance are California's strong employment and income growth through 2000 and the correspondingly large increases in monthly cash receipts during the first half of this fiscal year. Stock options and capital gains proved to be especially important for revenues. For example, based on cash receipts, the administration estimates that stock options and capital gains combined grew by over 30 percent in 2000.
Budget-Year Forecast. The administration forecasts slowing revenue growth in 2001-02. Total General Fund receipts are projected to total $79.4 billion, a 3.3 percent increase from the current year. After adjusting for the impacts of recent and proposed tax relief, as well as funding redirections, the underlying increase is a slightly stronger 3.6 percent. The modest revenue gain is consistent with the administration's economic forecast of slowing personal income and sales growth in 2001 and early 2002. It also reflects the administration's assumption that capital gains and stock-option income will decline 10 percent between 2000 and 2001.
The budget's revenue forecast reflects tax-related legislation passed in conjunction with last year's budget and proposed in this year's budget, as well as a triggered reduction in the SUT rate. The fiscal effects of the tax-relief legislation are summarized in Figure 4.
2000 Legislation. Last year the state enacted tax relief legislation that will reduce taxes by $2 billion in the budget year and $1.2 billion in 2002-03. As shown in Figure 4, the main provision was an acceleration of VLF rate reductions, which under prior legislation would have been phased in over the next several years. Under this legislation, the VLF rate was reduced by about one-halffrom 1.3 percent down to 0.65 percent effective January 1, 2001. Other tax relief measures passed last year included a PIT credit for credentialed teachers and partial conformity to the federal child care credit.
| Figure 4 | |||
| Recent and Proposed Tax Relief Measures | |||
| (In Millions) | |||
| Provision | 2001-02 | 2002-03 | 2003-04 |
| 2000 Budget Package a | |||
| Vehicle license fee acceleration |
$1,440 |
$630 | — |
| Credentialed teacher tax credit |
188 |
202 | $217 |
| Child care tax credit |
189 |
193 | 197 |
| Other provisions |
161 |
133 | 136 |
| Totals | $1,978 | $1,158 | $550 |
| 2001 Proposed Package | |||
| Manufacturers' investment tax credit |
$70 |
$90 | $95 |
| Sales tax holiday |
27 |
— | — |
| Other provisions |
11 |
7 | 6 |
| Totals | $108 | $97 | $101 |
| a 2000 budget package also included $1.2 billion of tax reductions in the current year. | |||
2001 Proposals. The 2001-02 budget includes several targeted tax relief proposals, which would reduce General Fund revenues by a combined total of $108 million in 2001-02. The main provision is an increase in the manufacturers' investment tax credit from 6 percent to 7 percent. The budget also proposes a three-day sales tax holiday in August 2001. Under this proposal, the state portion of the sales tax would be suspended for up to $200 per purchase of clothing and footwear, and up to $1,000 per purchase for computers and related equipment. Local governments would have the option of participating in the program at their own expense.
Other proposed relief includes an increase in the capital gains exclusion for small business stock held for more than five years, a credit for employers who subsidize transit passes for their employees, and the addition of software developers to the list of companies eligible for the SUT exemption for purchases of manufacturing equipment.
Triggered SUT Rate Reduction. Under legislation accompanying the imposition of a quarter-cent sales tax increase in 1991, this quarter-cent rate can "trigger off" in any year in which the Director of Finance certifies, by November 1, that the preceding year's budgetary reserve and the estimated current-year budgetary reserve are both more than 4 percent of General Fund revenues. In late October 2000, the Director made this certification, which resulted in a quarter-cent SUT reduction effective for calendar year 2001. This reduction will lower General Fund revenues by a total of $1.2 billion, of which $530 million will occur in the current year and $620 million will occur in the budget year. The 2001-02 budget forecast assumes that the quarter-cent tax rate will be reinstated on January 1, 2002.
Figure 5 provides the LAO's updated General Fund revenue outlook for 2000-01 through 2002-03. These revenue projections are based on our economic forecast presented in "Part II" of this volume and also take into account recent positive cash developments through the end of January. Our estimate also incorporates the fiscal effects of the administration' proposed tax reductions, as well as its proposal relating to the redirection of tobacco tax settlement monies from the General Fund to special funds.
| Figure 5 | ||||||
| Summary of the LAO's General Fund Revenue Forecast | ||||||
| 2000-01 Through 2002-03 (Dollars in Millions) | ||||||
| 2000-01 | 2001-02 | 2002-03 | ||||
| Revenue Source | Amount | Percent Change |
Amount | Percent Change |
Amount | Percent Change |
| Personal Income Tax |
$43,980 |
11.1% | $44,540 | 1.3% | $48,300 | 8.4% |
| Sales and Use Tax |
21,800 |
3.1 | 23,240 | 6.6 | 25,410 | 9.3 |
| Bank and Corporation Tax |
7,130 |
7.4 | 6,920 | -2.9 | 7,610 | 10.0 |
| Insurance Tax |
1,336 |
2.8 | 1,397 | 4.6 | 1,484 | 6.2 |
| Other taxes |
1,405 |
2.1 | 1,462 | 4.0 | 1,533 | 4.8 |
| Other revenues |
1,945 |
27.5 | 1,317 | -32.3 | 1,175 | -10.8 |
| Transfers |
13 |
-96.6 | 84 | 546.2 | 100 | 19.0 |
| Totals | $77,609 | 7.9% | $78,960 | 1.7% | $85,612 | 8.4% |
Current-Year Forecast. We forecast that General Fund revenues will reach $77.6 billion in the current year, a 7.9 percent increase from 1999-00. The fastest growing revenue source is PIT, which is expected to increase by slightly over 11 percent. Our forecast is $710 million above the administration's estimate, but is down by about $320 million from our November 2000 projection made when the economy looked stronger.
Budget-Year Forecast. We project 2001-02 General Fund revenue growth of just 1.7 percent, to $79 billion. This modest growth reflects the negative impacts of the sharp national and state economic slowdowns which are becoming increasingly apparent, and an assumed 15 percent decline in stock options and capital gains for calendar year 2001. Our revised forecast is down by about $474 million from the administration's estimate, and is down by over $2.5 billion from our November 2000 projection (after netting out the effects of proposed accounting and law changes).
2002-03 Forecast. We project that General Fund revenues will reach $85.6 billion in 2002-03, a healthy 8.4 percent increase from 2001-02. While some of the growth is related to the reinstatement of the quarter-cent sales tax rate in 2002, most of the increase is due to an assumed rebound in the California economy during that year.
Figure 6 summarizes some of the key factors behind our General Fund revenue outlook.
| Figure 6 |
| Key Factors Affecting the Revenue Outlook |
|
|
|
|
Given the normal time lags between changes in economic activity and corresponding changes in tax payments, the majority (about two-thirds) of the revenue picture in the current year is related to economic activity that has already occurred in calendar year 2000, while a similar share of budget-year revenues will be related to economic activity in 2001. As indicated in "Part II," California experienced strong economic growth and cash receipts through the end of 2000, and this has contributed to our outlook for healthy revenue growth in the current year. In fact, year-end withholding and quarterly estimated tax prepayments received in January exceeded the budget forecast amount by over $500 million, suggesting that PIT liabilities in 2000 were even stronger than projected by the administration.
However, we anticipate that the economic slowdown projected for 2001, coupled with the expected decline in stock options and capital gains, will restrain growth in revenue receipts during the months ahead. Given the time lags between when tax liabilities are incurred and when payments toward these liabilities are received by the state, only about one-third of current year receipts will be affected by the 2001 economic slowdown. Thus, the predominate effect of the slowdown will be felt in 2001-02, when we expect revenue growth to fall to only 1.7 percent.
As indicated earlier, 94 percent of General Fund revenues are attributable to the state's three major tax-revenue sourcesthe PIT, SUT, and BCT. Below we provide a detailed discussion of the forecasts for these taxes and factors affecting their projected growth.
The PIT is levied on taxable income attributable to California, with taxable income equaling total income minus various statutory exclusions, exemptions, and deductions. This taxable income is subject to a progressive marginal tax rate schedule, with the individual marginal rates ranging from 1 percent to 9.3 percent. Once a taxpayer's liabilities on this taxable income have been computed, various credits are applied to arrive at the final tax liability. In general, the state's PIT is patterned after the federal PIT and many of its provisions conform to federal PIT law.
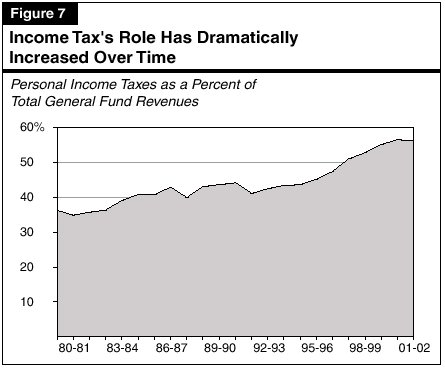
As shown in Figure 7, the share of total General Fund revenues attributable to the PIT has increased from about 38 percent in 1980-81 to nearly 57 percent in 2000-01. The share increased considerably throughout the 1980's economic expansion, retreated slightly during the early 1990's recession, and then soared during the second half of the decade. Between 1995-96 and 1999-00, receipts from this source increased at an average annual rate of 17.3 percent, or nearly three times as fast as statewide personal income growth.
Some of the increased PIT share merely reflects the interaction of strong California personal income growth and the state's
progressive PIT
rate structure. However, the rapid growth has also been due to the stock market, which has contributed to major increases in
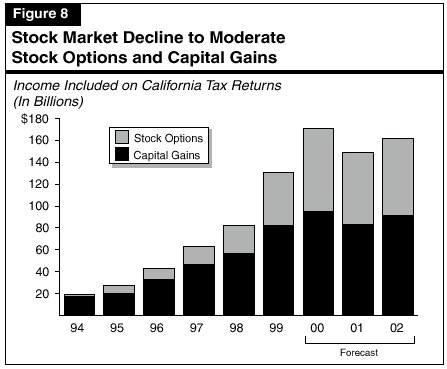
capital gains and stock option-related income. As shown in Figure 8, these two sources grew from a combined total of about
$25 billion in 1995 to $130 billion in 1999a more than five-fold increase. As a result of these increases, we estimate that capital
gains and options together now account for more than one-third of total PIT collections. While gains in these sources are
responsible for much of the state's strong revenue performance in recent years, their increased importance also adds an additional
element of volatility and uncertainty to the state's revenue stream.
Current Outlook for Capital Gains and Stock Options Based on cash receipts through the end of 2000, we estimate that capital gains and stock option-related income grew by over 30 percent during 2000. This growth occurred even as the stock market's major indexes fell during the yearwith the NASDAQ down at year-end by more than 40 percent from the beginning of the year and by more than 50 percent from its March 2000 peak. It appears that many stocks were sold as investors and employees attempted to "cash out" gains that had accumulated in previous years. While this increased "profit taking" boosted gains attributable to 2000, the amount of "stored-up" gains that remain to be realized has correspondingly diminished. As a result, we are forecasting that revenues at tributable to these sources will fall by 15 percent in 2001, before rebounding by 9 percent in 2002.
Forecast for PIT Receipts. Based on the state's strong income and job performance through the end of 2000, we estimate that PIT revenues in the current year will total $44 billionan 11 percent increase from 1999-00. We expect revenue growth to subside in the budget year, however, with PIT receipts totaling $44.5 billiona marginal 1.3 percent growth rate. Thereafter, the subsequent rebound in economic activity is projected to boost PIT receipts in 2002-03 by 8.4 percent, to a total of $48.3 billion.
The SUT is the General Fund's second largest revenue source, accounting for slightly less than 30 percent of total receipts in 2001-02. The SUT actually is comprised of the following two separate levies:
The total SUT rate levied on transactions subject to the tax is a combination of several different individual rates imposed by the state and various local governments.
State Rates. The main component of the overall SUT rate is the 5 percent General Fund rate (which in January was reduced to 4.75 percent for 2001 under the terms of 1991 sales tax trigger legislation discussed earlier). Also included are two 0.5 percent rates, whose proceeds are deposited, respectively, into (1) the Local Revenue Fund, which supports health and social services program costs associated with the 1991 realignment legislation and (2) the Local Public Safety Fund, which was approved by the voters in 1993 for the support of local criminal justice activities.
Uniform Local Rate. There is a uniform local tax rate of 1.25 percent levied by all counties (the so-called Bradley-Burns rate). Of this total, 0.25 percent is deposited into county transportation funds, while the remaining 1 percent is allocated to city and county governments for general purposes.
Optional Local Rates. The final component involves optional local tax rates, which local governments are authorized to levy for a variety of purposes. These taxes, which require local voter approval, are normally levied on a countywide basis, primarily for transportation-related purposes. They can be levied in 25 cent or 50 cent increments and cannot exceed 1.5 percent (except in San Francisco and San Mateo Counties).
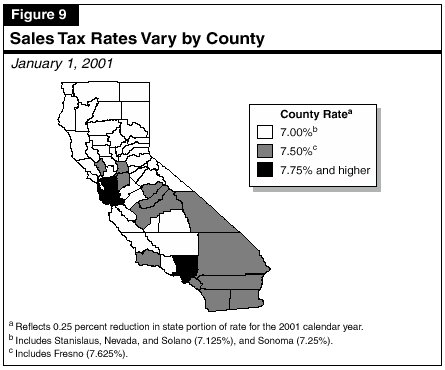
Combined State and Local Tax Rates. The combined state and local SUT rate varies significantly across California, due to the optional local rates. As depicted in Figure 9, the combined rate currently ranges from 7 percent up to 8.25 percent (the latter for the City and County of San Francisco). No county currently imposes the maximum allowable SUT rate of 8.5 percent.
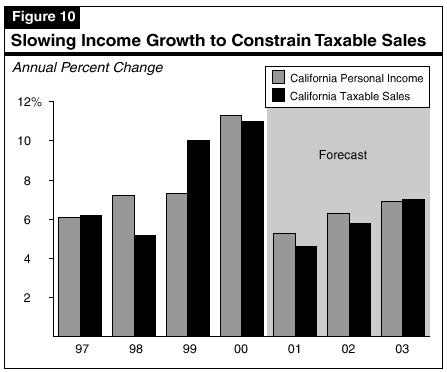
After several years of moderate growth, taxable sales jumped by 10 percent in 1999 and by about 11 percent in 2000the strongest back-to-back years in recent history. As shown in Figure 10, taxable sales increases in recent years have generally tracked growth in personal income, which peaked in 2000. The healthy gains experienced have also been due to high consumer and business confidence levels, as well as the "wealth effect" related to sharply rising stock market values.
The taxable sales increases experienced in recent years have been spread among many different industry categories, including major growth in auto sales, home furnishings, computers, electronics, and other durable goods. Also contributing to the growth has been strong business spending on investment equipment and in new facilities (important because building materials are subject to the SUT). In most cases, the taxable sales growth has reflected increased real spending as opposed to just price increases. Gasoline sales, however, are an exception, as price increases have been a key factor behind their taxable sales growth.
We forecast that taxable sales growth will slow sharply during 2001 before partially rebounding in 2002. Key factors behind the expected slowdown are the downturn in California's personal income growth, the effects of sharply reduced consumer and business confidence levels, and a partial reversal of the wealth effect (caused by declining stock market values). Recent sharp increases in energy costs and rents are also likely to cut into the budgets of lower-income and moderate-income households, thereby putting more downward pressure on their discretionary spending on taxable items. Finally, the sharp cutback in business investment plans will have a dual adverse effect in California. First, it implies less business-to-business sales of information technology products in the state. Second, it will also have impacts on the expansion plans of California's high-tech companies, which will reduce taxable sales of building materials.
We expect that consumer and business spending will rebound in line with overall California economic growth beginning in early 2002, leading to annual increases in taxable sales of 5.8 percent in 2002 and 7 percent in 2003.
Forecast for SUT Receipts. Based on our projections of taxable sales, we forecast that SUT receipts will increase from $21.1 billion in 1999-00 to $21.8 billion 2000-01, a 3.1 percent increase. This current-year estimate reflects the impact of the 2001 quarter-cent SUT rate reduction, as well as a diversion of $500 million in sales taxes on gasoline from the General Fund to a transportation fund.
We estimate that sales tax receipts in 2001-02 will total $23.2 billion, an increase of 6.6 percent. However, part of this healthy increase reflects a change in the accounting treatment of sales taxes used to support transportation programs. Specifically, under the terms of last year's budget agreement, the full $1.2 billion in sales taxes on gasoline will support transportation programsup from the $500 million noted above for the current year. The budget, however, is reflecting this commitment as an appropriation from the General Fund for transportation purposes, rather than as a diversion of sales taxes as is their treatment in the current year. Adjusting for this accounting change, the underlying increase in SUT receipts is a more modest 4 percent.
The BCT is levied at a general tax rate of 8.84 percent on California taxable profits. Banks and other financial corporations also pay an additional 2 percent tax, which is in lieu of most other state and local levies. Corporations that qualify for California Subchapter "S" status are subject to a reduced 1.5 percent corporate rate (but, in exchange, have their income for tax purposes "passed through" to their shareholders where it also is subject to the PIT). Approximately two-thirds of all BCT revenues come from multi-state and multi-national corporations, a share of whose income is apportioned to California based on a formula. California's BCT allows for a variety of exclusions, exemptions, deductions, and credits, many of which fully or partially conform to, or are based on, the federal BCT. Major examples include the research and development tax credit, and the ability of companies to carry forward a portion of any operating losses so that they can deduct them later on when they have positive profits.
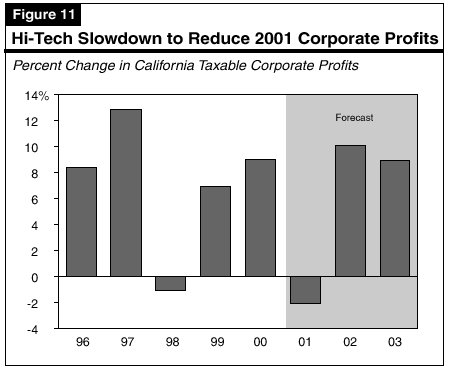
During the current economic expansion, California taxable profits have performed erratically, jumping by 13 percent in 1997, falling by 1 percent in 1998, and then rebounding by roughly 8 percent per year in 1999 and 2000. During the past five years, profits have generally benefitted from strong sales and high rates of productivity growth. However, earnings within certain specific industries have been adversely affected by such factors as the Asian economic and financial crisis (which depressed high-tech manufacturing and banking profits in 1998), and industry restructuring involving banking, utilities, and telecommunications.
We expect that the national and state economic slowdowns will cause corporate profits to decline in 2001 (see Figure 11). All industries will feel the impacts of slowing sales, as well as rising costs for compensation (particularly health care benefits) and energy. The slowdown in information technology-related sales will have a particularly significant negative impact on California's high-tech manufacturers and service providers. We look for profit growth to rebound in 2002, however, as cost pressures subside and sales improve.
Forecast for BCT Receipts. We forecast that BCT revenues will rise by 7.4 percent in the current year to $7.1 billion, largely based on the strength of profit growth through the end of 2000. We forecast that BCT receipts will decline slightly to $6.9 billion in 2001-02, primarily reflecting the profit decline expected for 2001, and then grow by nearly 10 percentto $7.6 billionin 2002-03 as profits rebound.
The remaining 6 percent of General Fund revenues is related to a variety of sources, including the insurance, estate, tobacco, and alcoholic beverage taxes, as well as a variety of lesser sourcesincluding minor taxes, fees, interest earnings, and transfers from special funds.
We forecast that revenues from these other sources will total $4.7 billion in the current year, decline to $4.2 billion in 2001-02, and then partially rebound to $4.3 billion in 2002-03. The year-to-year comparisons of revenues from these other sources are affected not only by their underlying trends, but also by accounting changes affecting tobacco settlement funds and child support reimbursements, one-time asset sales, and certain other anomalies. Our forecast assumes modest growth in insurance and estate taxes receipts, but slight declines in collections from the tobacco taxes during the next three years. Pooled money investment earnings are expected to rise from $470 million in 1999-00 to $680 million in the current year (due to large investable General Fund cash balances), before falling back to about $450 million in 2001-02 and 2002-03.
Special funds revenues support a wide variety of state and local government programs. As shown in Figure 12, about one-half of these revenues are related to motor vehicle-related taxes and fees. These include VLF revenues (which are distributed to local governments for general purposes) and fuel taxes and registration fees ( which support transportation-related projects). The other one-half of special funds revenues consist of certain SUT receipts; certain cigarette and tobacco tax revenues; and a variety of other taxes, fees, and interest earnings.
| Figure 12 | |||||
| Special Funds Revenues and Transfers | |||||
| 1999-00 Through 2001-02 (Dollars in Millions) | |||||
| 2000-01 | 2001-02 | ||||
| Revenue Source | Actual 1999-00 |
Amount | Percent Change |
Amount | Percent Change |
| Motor Vehicle Revenues | |||||
| License fees (in lieu) a |
$3,296 |
$3,205 | -2.8% | $3,483 | 8.7% |
| Fuel taxes |
3,041 |
3,137 | 3.2 | 3,221 | 2.7 |
| Registration, weight, and miscellaneous fees |
1,917 |
1,975 | 3.0 | 1,951 | -1.2 |
| Subtotals |
($8,254) |
($8,317) | (0.8%) | ($8,655) | (4.1%) |
| Other Sources | |||||
| Sales and use tax b |
$2,320 |
$3,043 | 31.2% | $2,717 | -10.7% |
| Cigarette and tobacco taxes |
1,084 |
1,058 | -2.4 | 1,043 | -1.4 |
| Interest earnings |
269 |
259 | -3.7 | 271 | 4.6 |
| Other revenues c |
4,022 |
4,123 | 2.5 | 4,806 | 16.6 |
| Transfers and loans |
-344 |
-48 | — | -52 | — |
| Totals | $15,605 | $16,752 | 7.4% | $17,440 | 4.1% |
| a Incorporates impacts of Vehicle License Fee rate reduction. | |||||
| b Excludes Local Public Safety Fund revenues. | |||||
| c Includes tobacco settlement receipts of $468 million in 2001-02. | |||||
Special funds revenues are projected by the administration to total $16.8 billion in 2000-01 (a 7.4 percent increase from 1999-00) and $17.4 billion in 2001-02 (a 4.1 percent increase from the current year). Underlying these moderate increases are the effects of accounting and other changes implemented in prior years, as well as new changes proposed in the 2001-02 budget.
The large current-year increase in special funds SUT revenues is partly related to the one-time diversion of $500 million of General Fund sales taxes on gasoline to a transportation special fund. Finally, the major increase in other special funds revenues in 2001-02 is partly related to the budget's proposal to shift $468 million in tobacco settlement revenues from the General Fund to a newly created Tobacco Settlement Fund.