Legislative Analyst's Office
The 2002-03 Budget Bill:
|
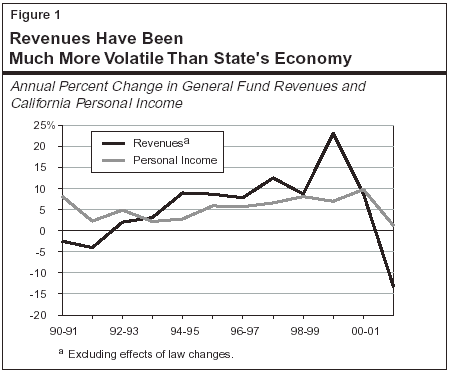
As discussed in "Part I," the state is facing a major budget shortfall caused largely by an unprecedented decline in tax receipts. Specifically, General Fund revenues (excluding transfers and loans) are projected to fall by over 14 percent in 2001-02, just two years after the state experienced a more than 23 percent increase.
Given these tremendous revenue swings and the dramatic impacts they have on the state budget, the first portion of our revenue discussion is devoted to looking at the factors underlying the volatility in the state's General Fund revenue base. We focus especially on the increased importance in recent years of personal income taxes and the related heightened dependence on stock options and capital gains. Following this discussion, we then turn to the near-term revenue outlook for the state, first reviewing the administration's forecast, then presenting our own projections of General Fund revenues for 2001-02 through 2003-04.
Revenue volatility has been a "fact of life" in California for the past three decades, with tax receipts booming during good economic times and plunging during bad times. Such volatility is not surprising, given the dynamic nature of California's economy, and the fact that the state's major taxes are closely linked to such cyclical economic variables as consumer spending on automobiles and houses, business investment in capital equipment, corporate profits, and investment income.
In addition, changes in the state's economy are magnified by California's progressive personal income tax (PIT) structure, where higher income levels are subject to higher marginal tax rates. Under this progressive tax rate structure, revenues grow faster than income during expansions (as rising real incomes are subjected to higher rates) and fall by more than income during recessions (as incomes slide back down into lower tax brackets).
While always present, revenue volatility increased in the 1990s, especially in comparison to the fluctuations in economic activity that were experienced. As noted in Figure 1, the year-to-year changes in revenues over the past decade have been dramatic—ranging from a minus 4 percent in the early 1990s, to a plus 23 percent in 1999-00, before plunging by an estimated 14 percent in 2001-02. These fluctuations in revenue growth have been much larger than fluctuations in statewide personal income (the single most important determinant of revenues) during this period.
The key factor behind the increased revenue volatility is the growing dominance of the PIT, which itself has experienced increased volatility in recent years.
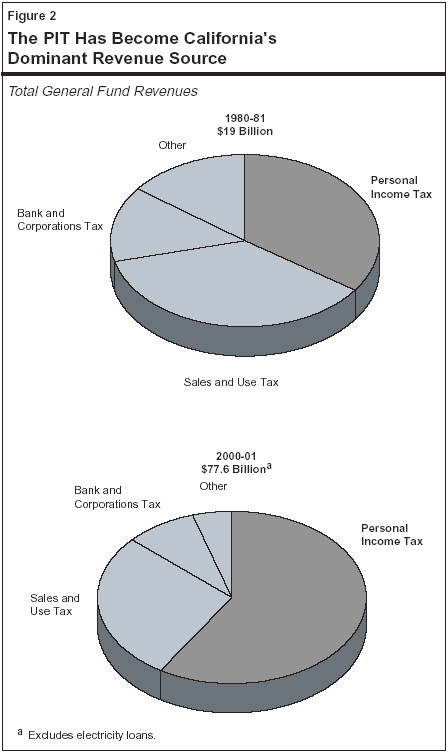
PIT's Increased Share of California Revenues. As shown in Figure 2, the PIT's share of total General Fund revenues increased from 35 percent in 1980-81 to nearly 58 percent in 2000-01. This occurred largely because PIT revenues grew faster than California's economy (as measured by such variables as statewide personal income or gross state product), while the other two major revenue sources (the sales and corporation taxes) grew more slowly than the overall economy during this period. Other factors, such as the elimination of the inheritance tax, also played a role in the PIT's increased dominance.
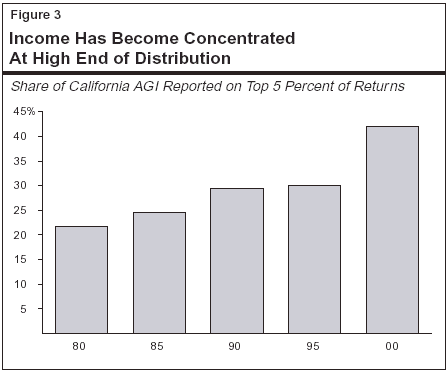
Factors Making the PIT More Volatile. At the same time that the PIT was gaining dominance, the tax itself was becoming more volatile. In general, this greater volatility can be linked to the increased concentration of income in the hands of high-income taxpayers in California who themselves have large amounts of volatile forms of income—such as stock options, capital gains, and business earnings. As shown in Figure 3, the share of total income attributable to the top 5 percent of state taxpayers increased from 22 percent in 1980 to nearly 30 percent in 1990, and further to 42 percent in 2000. (In 2000, taxpayers in this group had adjusted gross incomes of at least $150,000.) The share of total PIT liabilities attributable to this top 5 percent of taxpayers was even higher, reaching nearly 68 percent in 2000. As indicated earlier, this higher tax share is due to California's progressive PIT rate structure, where the effective tax rate on high-income filers can be several times that of low- and middle-income filers.
Income and Tax Burden Concentration Accelerated in the 1990s. The trend toward increased concentration of income and PIT liabilities pre-dates the stock market run-up, and has been attributed to a variety of fundamental factors occurring nationally and particularly in California. These include (1) changes in the makeup of the workforce; (2) business restructurings within California's economy which have resulted in fewer middle-income jobs; and (3) an increase in the economic returns to education and skill levels in the economy, which have resulted in increased demand and higher wages for those with education and highly developed work skills. This long-established trend toward increasing concentration of income and PIT liabilities accelerated dramatically in the late 1990s.
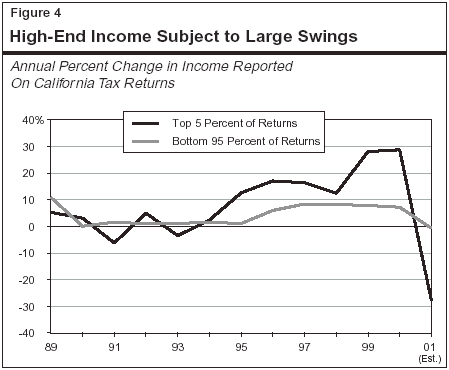
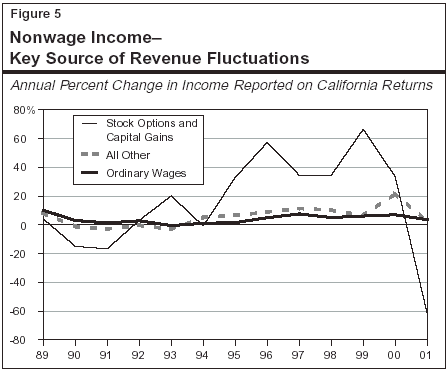
What Does the Increasing Income Concentration Imply for Volatility? Increasing income concentration is extremely significant from a revenue standpoint because it results in greater revenue volatility. Figure 4 compares the annual percent change in income reported by the top 5 percent versus the bottom 95 percent of California taxpayers over the past decade. It shows that fluctuations in income at the top end have been consistently larger over the past decade—even prior to the major run up and subsequent decline in the stock market.
Why Do High Incomes Exhibit High Volatility? In general, the greater income volatility associated with high-income returns is related to this group's greater reliance on nonwage sources of income. Many components of nonwage income are inherently highly volatile, such as business profits and capital gains. In addition, taxpayers often have more discretion over the timing and amount of such income that they report in a given year. For example, individuals can choose when to exercise stock options and when to realize their capital gains from asset sales. As shown in Figure 5, nonwage income has been much more volatile over the past decade than ordinary wages.
The Enormous Volatility of Stock Options and Capital Gains. As indicated above, significant increases in the concentration of income, and thus in PIT volatility, would likely have occurred even without the explosion of stock options and capital gains in the later half of the 1990s. However, the dramatic growth that took place in these sources during this period has clearly been the single most important factor behind recent increases in revenue volatility. Total income related to stock options and capital gains increased from $25 billion in 1994 to a peak of about $200 billion in 2000 an eight-fold rise—before falling an estimated 62 percent to $77 billion in 2001. At their peak, combined PIT revenues from these sources totaled about $17 billion in 2000-01, or roughly 22 percent of total General Fund revenues during the year.
As an indication of the increased volatility stemming from stock options and capital gains, we currently estimate that the 62 percent reduction in these sources will cause total General Fund revenues to fall by $10.5 billion in 2001-02, to $6.5 billion. This decline is equivalent to about 13 percent of total General Fund revenues. Had the same decrease occurred a decade earlier—when capital gains and stock options accounted for just 5 percent of the total revenues, the impact on the General Fund would have been just $1.3 billion, or only about 3 percent of total revenues during 1990-91.
With the burst of the high-tech bubble last year, a natural question to ask is: Will future revenue growth become less volatile and more predictable, as the revenues related to stock market activity "settle down?" A more stable market would certainly reduce revenue fluctuations relative to California's most recent experience.
Future Volatility Can Be Expected. At the same time, however, volatility will likely remain a key feature of California's future revenue experience. Even with the recent market declines, stock ownership continues to expand, especially among high-income households. A related factor is the evolution of compensation practices involving increased usage of stock options and employee stock ownership programs, especially for highly compensated workers and managerial employees. Even in a normal stock market environment, individual company share price fluctuations, coupled with decisions by employees and investors regarding when to exercise options and sell stocks, will have unpredictable impacts on the state's annual revenue stream.
More generally, the forces behind the shift toward greater concentration of income in California—including increased economic returns to education and skill levels in the economy—are likely to remain powerful forces in the future. Given the inherently high degree of income volatility associated with high-end returns, it is likely that significant revenue fluctuations will remain a characteristic of California's current revenue structure well into the future.
The Governor's budget projects that California state government will receive $94.8 billion in total revenues in 2002-03, a 1.4 percent increase from the current year. These revenue are deposited into either the General Fund or a variety of special funds. Figure 6 shows that:
Numerous Transfers and Accelerations Are Assumed in the Budget Year. As shown in Figure 6, about 90 percent of total General Fund receipts are attributable to the PIT, sales and use tax (SUT), and bank and corporation tax (BCT). The remainder is normally attributable to a variety of smaller taxes (including the insurance, estate, tobacco, and alcoholic beverage taxes) as well as investment earnings and various transfers from special funds. However, the administration's 2002-03 revenue forecast includes a variety of proposals. These include $2.4 billion in revenues related to the Governor's tobacco securitization proposal, whereby the state would sell investors a revenue bond for "up-front" cash. The bond would be backed by future tobacco settlement receipts. Also included is a $672 million loan from the Traffic Congestion Relief Fund, as well as a variety of other loans and transfers from special funds totaling about $900 million.
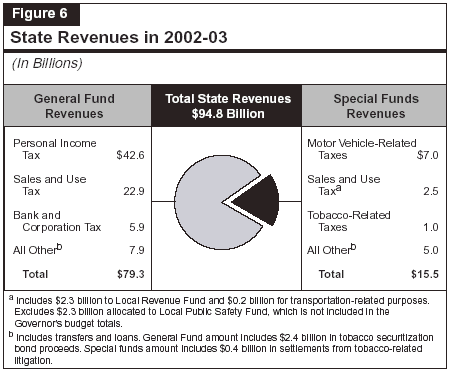
Figure 7 summarizes the budget's General Fund revenue outlook for 2001-02 and 2002-03.
|
Figure 7 Summary of the Budget’s |
|||||
|
2000-01 Through 2002-03 |
|||||
|
|
|
2001-02 |
2002-03 |
||
|
Revenue Source |
Actual |
Estimated |
Percent |
Projected |
Percent |
|
Taxes: |
|
|
|
|
|
|
Personal Income Tax |
$44,614 |
$38,455 |
-13.8% |
$42,605 |
10.8% |
|
Sales and Use Tax |
21,277 |
21,165 |
-0.5 |
22,850 |
8.0 |
|
Bank and Corporation Tax |
6,899 |
5,261 |
-23.7 |
5,869 |
11.6 |
|
Insurance Tax |
1,497 |
1,560 |
4.2 |
1,656 |
6.2 |
|
Other taxes |
1,381 |
1,280 |
-7.3 |
1,039 |
-18.8 |
|
Other Revenues, Transfers, and Loans: |
|||||
|
Tobacco securitization bond proceeds |
— |
— |
—a |
$2,400 |
—a |
|
Other revenues |
$1,940 |
$1,702 |
-12.3% |
1,314 |
-22.8% |
|
Electricity loans |
-6,210 |
6,210 |
—a |
— |
—a |
|
Other transfers and loans |
30 |
1,450 |
—a |
1,572 |
8.4 |
|
Totals |
$71,428 |
$77,083 |
7.9% |
$79,305 |
2.9% |
|
Adjusted Totalsb |
$77,608 |
$69,423 |
-10.5% |
$75,333 |
8.5% |
|
a Not a meaningful number. |
|||||
|
b Excludes certain factors that distort the basic underlying revenue trend, including tobacco securitization bond proceeds, electricity loans, and other transfers and loans. |
|||||
|
|
|||||
Current-Year Forecast. The budget forecasts that revenues will total $77.1 billion in 2001-02, a 7.9 percent increase from the prior year. The prior-year and current-year revenue totals and growth rates are affected by the administration's decision about how to display the General Fund's loan of $6.2 billion to the Electricity Power Fund for energy purchases. The loan is displayed as a $6.2 billion transfer out of the General Fund in 2000-01 and the assumed loan repayment (plus $413 million in interest) is included in the General Fund totals in 2001-02. Adjusting for this and a variety of other one-time loans and transfers, the administration is estimating that underlying revenues will fall by 10.5 percent between 2000-01 and 2001-02. The 2001-02 forecast reflects particularly large declines in PIT and BCT revenues, due to a slowing economy and a large drop in PIT revenues related to stock options and capital gains.
The Budget-Year Forecast. The administration forecasts that revenues and transfers will total $79.3 billion in 2002-03, a 2.9 percent increase from the current year. The estimate is affected by the administration's proposed $2.4 billion tobacco securitization bond sale, as well as a variety of loans and transfers from special funds. Excluding these and related factors from both the current year and budget year, the underlying revenue increase is about 8.5 percent. This growth is related to the administration's assumption that the mid-2002 economic recovery will boost revenues from each of the major taxes during the 2002-03 fiscal year.
The budget's revenue forecast reflects tax-related legislation passed in conjunction with last year's budget and proposed in this year's budget. In addition, the quarter-cent SUT rate that was adopted in 1991 for budget-balancing purposes but subsequently "triggered off," was "triggered on" effective January 1, 2002 due to the state's poor budget condition. Thus, the administration's forecast reflects the additional funds that are received pursuant to this SUT rate component—approximately $1.2 billion during the current and budget years combined. The fiscal effects of the Governor's tax proposals are summarized in Figure 8.
2002 Proposed Tax Measures. The Governors' tax proposals are primarily in the area of federal conformity, and result in both revenue decreases and revenue increases for the General Fund. The net effect of all the tax proposals would be an increase in revenue of $177 million in 2002-03 and a decrease of $59 million in 2003-04.
Tax Reduction Provisions. These include significant tax proposals that would substantially conform California to the federal Economic Growth and Tax Relief Reconciliation Act of 2001, and thereby result in revenue reductions to the state. These proposals would increase the amounts that could be contributed to an Individual Retirement Account, as well as to 401 (k) and/or 457 retirement accounts, among other things. Other federal-conformity changes that would result in revenue decreases include more generous treatment of qualified tuition plans, an expanded household and dependent care expense credit, and the more favorable alternative minimum tax treatment of certain charitable contributions.
|
Figure 8 Governor’s Proposed 2002 Tax Measures |
|||
|
(In Millions) |
|||
|
Provision |
2002-03 |
2003-04 |
2004-05 |
|
Federal Conformity—Revenue Reductions |
|||
|
Pension and retirement measures |
-$44 |
-$48 |
-$59 |
|
Qualified tuition plans |
-1 |
-1 |
-1 |
|
Dependent care tax credit |
-6 |
-40 |
-45 |
|
Charitable contributions |
-12 |
-10 |
-10 |
|
Total Reductions |
-$63 |
-$99 |
-$115 |
|
Federal Conformity—Revenue Increases |
|||
|
Estimated payments |
$210 |
$10 |
$10 |
|
Filing election for corporations |
30 |
30 |
30 |
|
Total Increases |
$240 |
$40 |
$40 |
|
Net Effect |
$177 |
-$59 |
-$75 |
|
|
|||
Tax Increase Provisions. The budget also proposes two federal conformity changes in the tax treatment of individuals and corporations that together would result in a substantial one-time increase in state revenues. First, the state would conform to federal law requiring that PIT filers pay at least 90 percent (instead of 80 percent) of their final tax liability through withholding or estimated tax payments. The second proposal is to require that corporations maintain the same tax filing status for federal and state purposes. This would have the most significant effect on Subchapter S and Subchapter C corporations.
One issue that remains outstanding is with respect to the SUT exemption for diesel fuel used in agricultural activities, which was adopted in conjunction with the 2001-02 budget. The proceeds of this tax are deposited into the Public Transportation Account. The regulations governing this exemption that subsequently were adopted by the Board of Equal ization resulted in a more generous interpretation of agriculture activities than was originally anticipated. Unless legislative action is taken that would make the exemption more restrictive, ongoing revenues will be approximately $50 million lower annually. (See the "Transportation" section of the Analysis.)
Our estimate for combined current-year and budget-year revenues that we made three months ago in our November 2001 Fiscal Forecast is, after adjusting for tax proposals, $2 billion lower than the Governor's new forecast. However, recent cash developments since our November forecast indicate that revenues are even weaker than we previously thought, especially those relating to the all-important areas of stock options and capital gains.
The PIT payments that the state receives in late December and the first half of January are extremely important to the revenue outlook, since they are significantly related to quarterly estimated payments remitted by taxpayers with substantial amounts of capital gains and other forms of nonwage compensation. In past years, these payments have been reliable indicators of the strength of tax payments made in April, when final PIT returns are due. For this reason, the level of the year-end 2001 payments and early-year 2002 receipts serves as a "spring board" from which the revenue estimates for the remainder of 2001-02 and 2002-03 are made.
As shown in Figure 9, after doubling between 1997-98 and 2000-01, these year-end payments plunged by over one-third in the December through January period. The current-year decline in these payments was about $1 billion greater than expected by the administration when it put its revenue forecast together, indicating that tax liabilities associated with high income returns are falling by more than anticipated. This weakness also suggests that final payments will be soft this coming April.
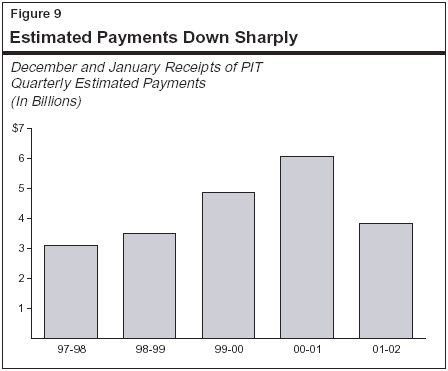
Figure 10 presents our General Fund revenue outlook for 2001-02 and 2002-03. In addition, to help the Legislature in its fiscal planning, we also provide our fiscal projections for an additional year—2003-04. Our projections are based on our economic forecast presented in "Part II," reflect all of the Governor's proposals, and take into account the recent negative cash developments noted above.
|
Figure 10 Summary of the LAO’s |
||||||
|
2001-02 Through 2003-04 |
||||||
|
|
2001-02 |
2002-03 |
2003-04 |
|||
|
Revenue Source |
Amount |
Percent |
Amount |
Percent |
Amount |
Percent |
|
Taxes: |
|
|
|
|
|
|
|
Personal Income Tax |
$35,978 |
-19.4% |
$41,123 |
14.3% |
$45,850 |
11.5% |
|
Sales and Use Tax |
21,225 |
-0.2 |
23,305 |
9.8 |
24,940 |
7.0 |
|
Bank and Corporation Tax |
4,870 |
-29.4 |
5,567 |
14.3 |
6,285 |
12.9 |
|
Insurance Tax |
1,616 |
7.9 |
1,793 |
11.0 |
1,901 |
6.0 |
|
Other taxes |
1,306 |
-5.4 |
1,139 |
-12.8 |
901 |
-20.9 |
|
Other Revenues, Transfers, and Loans: |
||||||
|
Tobacco securitization bond proceeds |
— |
—a |
$2,400 |
—a |
— |
—a |
|
Other revenues |
$1,667 |
-14.1% |
1,314 |
-21.2% |
$1,340 |
2.0% |
|
Electricity loans |
6,210 |
—a |
— |
—a |
— |
—a |
|
Other transfers and loans |
1,450 |
—a |
1,572 |
8.4 |
-300 |
—a |
|
Totals |
$74,322 |
4.1% |
$78,213 |
5.2% |
$80,917 |
3.5% |
|
Adjusted Totalsb |
$66,662 |
-14.1% |
$74,241 |
11.4% |
$81,217 |
9.4% |
|
a Not a meaningful number. |
||||||
|
b Excludes certain factors that distort the basic underlying revenue trend, including tobacco securitization bond proceeds, electricity loans, and other transfers and loans. |
||||||
|
|
||||||
2001-02 Revenues. We forecast that General Fund revenues and transfers will total $74.3 billion in the current year, an increase of 4.1 percent from 2000-01. After adjusting for the electricity loan and the Governor's various proposals, underlying receipts are down by 14 percent. As shown in Figure 10, we are projecting major declines in PIT and BCT revenues, and a minor decline in SUT receipts. Compared to the administration, our forecast is down $2.8 billion, mainly reflecting lower PIT and BCT collections. This reflects recent cash trends and our assumption that capital gains and stock options fell by more in 2001 than assumed by the administration.
2002-03 Revenues. We forecast that revenues and transfers will total $78.2 billion in 2002-03, a 5.2 percent increase from the current year. After adjusting for the assumed electricity loan repayment in the current-year and the budget's various revenue-related proposals for 2002-03, underlying revenues are up 11.4 percent. As with the administration, our budget-year revenue forecast is predicated on an economic recovery occurring beginning in spring 2002.
As shown in Figure 10, each of the major taxes is expected to increase significantly in the budget year. Our 2002-03 forecast is down about $1.1 billion from the budget projection—a significantly smaller gap than our current year difference of $2.8 billion. In general, this reflects our more cyclical forecast for stock options and capital gains. While we expect these income sources to fall by more than the administration during the current year, we also expect them to rebound by more next year (thereby bringing them "back up" closer to the administration's projection in 2002-03).
2003-04 Revenues. We forecast that total revenues and transfers will increase by about 3.5 percent in 2003-04, to $80.9 billion. Excluding the impact of the Governor's policy proposals on the revenue totals, however, the underlying increase would be about 9.4 percent. This increase is consistent with our assumed continuation of the state's economic rebound. We project that all three major taxes will increase at above-average rates during the year.
The state's three major taxes—the PIT, SUT, and BCT—are expected to account for nearly 90 percent of total General Fund revenues in 2002-03. Thus, the performance of these taxes will have a major impact on the overall revenue outlook. In the following sections, we discuss in more detail recent developments and the outlook for each tax.
Even with its current-year decline, the PIT remains, by far, the General Fund's single largest revenue source—accounting for an estimated 53 percent of total revenues and transfers in 2002-03. In general, the PIT is patterned after federal law with respect to reportable types of income, deductions, exemptions, exclusions, and credits. Taxable income is subject to marginal rates ranging from 1 percent to 9.3 percent, with the top rate applying to taxable income in excess of about $75,000 for joint returns and $37,000 for single filers in 2001.
As shown in Figure 11, after soaring from $29 billion in 1998 to slightly over $44 billion in 2000, we estimate that PIT liabilities plunged to $36 billion in 2001. Thereafter, we forecast that they will recover to $39 billion in 2002 and $44 billion in 2003. Under our forecast, however, PIT liabilities do not surpass their previous 2000 peak until 2004.
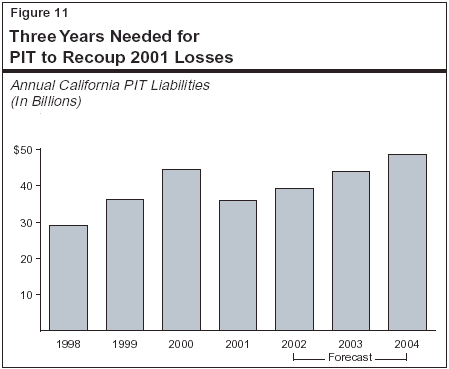
Factors Behind the Liability Forecast. Although the economic slowdown has had some adverse impact on overall wages and business profits, the main factor behind the drop in PIT liabilities has been the plunge in stock market-related options and capital gains. As indicated earlier, we estimate that income from these sources fell from $200 billion in 2000 to $77 billion in 2001, before partly rebounding to $91 billion in 2002, and $105 billion in 2003. Even with the partial rebound, however, 2003 liabilities forecast from these sources are still down by almost one half from their 2000 peak.
Based on these estimated changes in liabilities, we forecast that fiscal-year PIT receipts will decline from $44.6 billion in 2000-01 to $36 billion in 2001-02, before partially rebounding to $41.1 billion in 2002-03, and $45.9 billion in 2003-04.
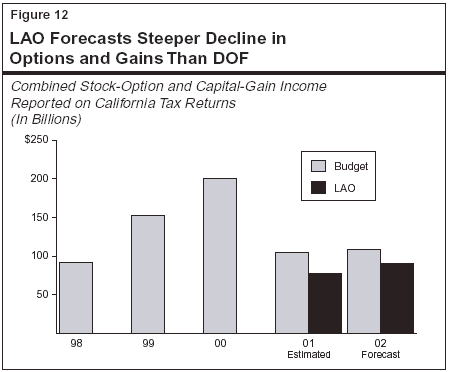
Comparison to the Budget Forecast. Compared to the budget forecast, our current projection of PIT revenues is down $2.5 billion in the current year and down $1.5 billion in the budget year. The resulting $4 billion two-year decline is largely related to our differing assumptions about the level of capital gains and stock options. As shown in Figure 12, our estimated 2001 decline in income from these sources is much steeper than the administration's estimate. While we assume a stronger "snap back" in 2002 than the administration, our estimate remains below the budget forecast by a significant margin in that year as well.
The SUT is the General Fund's second largest revenue source, accounting for about 30 percent of total revenues in 2002-03. The SUT actually is comprised of two separate levies:
The total SUT rate levied is a combination of several different individual rates imposed by the state and various local governments.
Combined SUT Rates. The combined state and local SUT rate varies significantly across California due to differences in the local optional rates that are levied. As depicted in Figure 13, the combined SUT rate currently ranges from 7.25 percent (for those counties with no optional rates) up to 8.5 percent (for the City and County of San Francisco). No county currently imposes the maximum allowable rate of 8.75 percent.
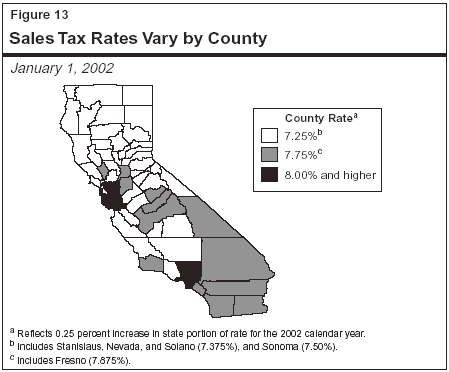
Figure 14 shows that, after booming in 1999 and 2000, taxable sales fell nearly 2 percent in 2001. Some of this year-to-year decline is the result of the fact that 2000 spending levels—propelled by unprecedented increases in stock-market-related wealth and income—were so unusually strong that 2001 growth rates would have likely looked anemic even without the negative impacts of the recession. The taxable sales slowdown was compounded by the sharp drop in business capital spending and the adverse impacts of higher energy prices on household budgets. Following the September 11 attacks, the declines in tourism-related spending also depressed taxable spending late in the year, although these declines were offset to some degree by strong year-end auto sales, boosted by zero-interest-rate auto financing promotions.
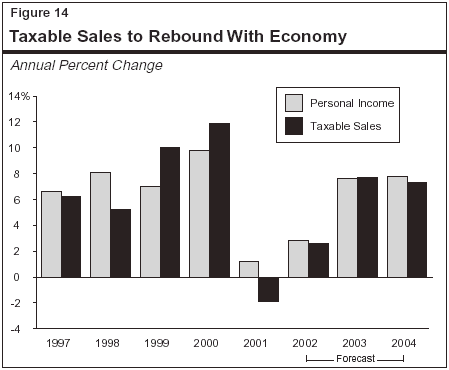
Looking ahead, we project that taxable sales will remain soft in early 2002, but turn upward in the spring as tourism increases and the economic recovery gets underway. Our forecast also assumes that business spending on computers and other capital goods picks up in the second half of the year. As indicated in Figure 14, taxable sales are projected to increase in line with California personal income, growing by 2.6 percent in 2002 and 7.7 percent in 2003.
Based on our forecast of taxable sales, we project that SUT receipts will fall slightly from $21.3 billion in 2000-01 to $21.2 billion in 2001-02. The revenue totals in both the prior year and current year reflect the previously noted quarter-cent sales tax reduction that was in effect during calendar year 2001. In the budget year, we forecast that sales tax receipts will jump to $23.3 billion in 2002-03, a 9.8 percent increase from the current year. The growth is due to the projected increases in taxable sales and the full-year impact of the restoration of the quarter-cent sales tax in 2002.
Comparison to the Budget Forecast. Our SUT estimate is up from the budget forecast by $60 million in the current year and by $455 million in 2002-03. Our higher forecast for SUT receipts is related to our assumption that the recovery in taxable sales will come a bit earlier and be somewhat stronger in 2002 than the budget forecast.
The BCT is levied at a general tax rate of 8.84 percent on California taxable profits. Banks and other financial corporations pay an additional 2 percent tax, which is in lieu of most other state and local levies. Corporations that qualify for California Subchapter "S" status are subject to a reduced 1.5 percent corporate rate. In exchange, the income and losses from these corporations are "passed through" to their shareholders where they are subject to the PIT.
Approximately two thirds of all BCT revenues come from multistate and multinational corporations. These companies have their consolidated U.S. income apportioned to California based on a formula involving the share of their combined property, payroll, and sales that is attributable to this state. California's BCT allows for a variety of exclusions, exemptions, deductions, and credits, many of which are similar or identical to the federal corporate profits tax. Major examples include the research and development tax credit and net operating loss "carry forward" provisions, whereby companies can use a portion of their operating losses incurred in one year as a deduction against earnings in subsequent years. California also offers a Manufacturers' Investment Credit.
Based on cash receipts through December, we estimate that California corporate profits fell by about 17 percent in 2001 (see Figure 15). Company earnings have been squeezed by soft revenues and rising costs in a number of areas, including health care premiums, transportation, and energy. The manufacturing sector, which has traditionally accounted for roughly one third of total taxable profits in California, has been especially hard-hit by the U.S. high-tech slump and the weakness in export markets. Other industries that were hard-hit include transportation and business services. The transportation sector was adversely affected by both the slump in the airlines industry and the declines in international trade activity (which reduced the need for both warehousing and transportation). Business services were negatively impacted by the drop in software sales and advertising revenues.
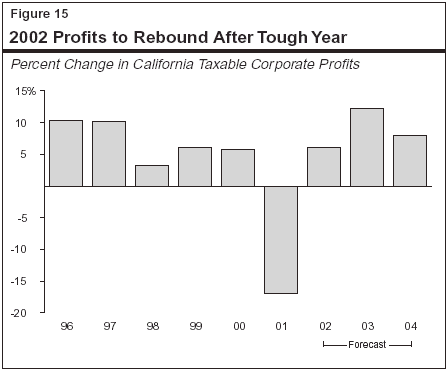
We forecast that profits will partially rebound in 2002, reflecting generally improving economic conditions. Given that inventories are lean, we believe that recent increases in new orders, if sustained, will quickly translate into stepped-up production and profits. An important factor affecting California's earnings will be the timing and strength of the recovery in information technology spending. As shown in Figure 15, we forecast that California taxable profits will increase by 6.1 percent in 2002 and 12 percent in 2003, as the economic expansion gains momentum.
We forecast that BCT receipts will be $4.9 billion in 2001-02, a 29 percent decline from the prior year. The current-year reduction is partly due to the major drop in profits we estimate for 2001. It also reflects large refunds made in late 2001, which were related to over-payments made by corporations on their 2000 earnings. We forecast that BCT revenues will rebound to $5.6 billion in 2003, an increase of 14 percent. About one-half of this increase is related to improvement in corporate earnings. The balance of the gain is related to our assumption that the majority of current-year BCT refunds were one-time adjustments related to prior-year tax liabilities. We forecast that BCT receipts will increase further to $6.3 billion in 2003-04, consistent with the growth in profits we are projecting for 2003.
Comparison to the Budget Forecast. Our BCT estimate is $391 million below the budget forecast in the current year and $302 million below the budget forecast in 2002-03. Our lower estimate is related to two main factors: (1) our estimate of a larger profit reduction in 2001 and (2) the inclusion in our estimate of about $270 million in unexpected refunds that occurred after the budget forecast was prepared
The remaining 11 percent of total revenues and transfers consists of taxes on insurance premiums, estates, alcoholic beverages, and tobacco, along with interest income and a large number other revenues and fees. The budget proposal also includes a variety of loans and transfers from special funds, plus proceeds from the Governor's planned tobacco securitization bond sale proposed to help balance the budget.
Excluding the administration's budget proposals, as well as various other policy and accounting related changes made in recent years, revenues from the nonmajor sources are expected to total roughly $4 billion in both the current and budget years. This reflects moderate increases in insurance taxes, and small declines in tobacco and alcoholic beverage receipts.
Estate Tax Being Phased Out. Our forecast also includes the impact of a provision included in the federal tax reduction package passed last spring, which will phase out California's estate tax over the next four years. The reason for this phase-out involves California's voter approval in 1982 of Proposition 6—a statutory initiative that eliminated California's inheritance and gift tax and replaced it with a "pick-up" tax. This pick-up tax is the amount of state taxes that can be applied as a credit against the federal estate tax liability. (Thus, while the tax provides revenues for California, it does not impose any net cost on the taxpayer.) The new federal law phases out the state credit over a four-year period, beginning in 2002. This will reduce California's estate tax revenues by $100 million in the current year, $370 million in the budget year, and $650 million in 2003-04.
Special funds revenues support a wide variety of state and local government programs. As shown in Figure 16, nearly one half of special funds revenues are related to motor vehicle-related taxes and fees. These include motor vehicle license fees, which are in-lieu of the property tax and whose proceeds are distributed to local governments for general purposes. They also include fuel taxes and registration fees, which support transportation-related spending.
|
Figure 16 Summary of the Budget’s Forecast for |
|||||
|
2000-01 Through 2002-03 |
|||||
|
|
|
2001-02 |
2002-03 |
||
|
Revenue Source |
Actual |
Estimated |
Percent |
Projected |
Percent |
|
Motor Vehicle Revenues |
|
|
|
|
|
|
License fees (in lieu)a |
$3,289 |
$1,734 |
-47.3% |
$1,808 |
4.3% |
|
Fuel taxes |
3,142 |
3,184 |
1.3 |
3,244 |
1.9 |
|
Registration, weight, and miscellaneous fees |
1,943 |
1,987 |
2.3 |
2,107 |
6.0 |
|
Subtotals |
$8,374 |
$6,905 |
-17.5% |
$7,159 |
3.7% |
|
Other Sources |
|
|
|
|
|
|
Sales and use taxb |
$3,021 |
$2,435 |
-19.4% |
$2,531 |
3.9% |
|
Cigarette and tobacco taxes |
1,024 |
1,012 |
-1.2 |
997 |
-1.5 |
|
Interest earnings |
347 |
215 |
-38.1 |
208 |
-3.2 |
|
Other revenuesc |
4,347 |
6,636 |
52.7 |
6,098 |
-8.1 |
|
Transfers and loans |
-123 |
-729 |
— |
-1,465 |
— |
|
Totals |
$16,991 |
$16,474 |
-3.0% |
$15,528 |
-5.7% |
|
a Incorporates impacts of vehicle license fee rate reduction. |
|||||
|
b Excludes Local Public Safety Fund revenues. |
|||||
|
c Includes tobacco settlement receipts of $402 million in 2001-02 and $412 million in 2002-03. |
|||||
|
|
|||||
The remaining special funds include a portion of the SUT's revenues (which support local health programs), tobacco taxes (which are earmarked for various anti-smoking and health programs), and tobacco settlement receipts (which are dedicated to various recent health program expansions).
The budget forecasts that special funds revenues and transfers will decline from $17 billion in 2000-01 to $16.5 billion in 2001-02, and further to $15.5 billion in 2002-03. The declines in both the current year and budget year reflect the net impact of a large number of policy and accounting changes previously enacted and proposed for 2002-03. One example is the drop in the vehicle license fees, which is related to the 67 percent fee reduction first enacted in 1998 and then accelerated in 2000. The reduction in these revenues is replaced with increased General Fund subventions to "backfill" the local revenue losses. Other examples include (1) a one-time redirection of sales taxes in 2000-01, (2) major loans to the General Fund, and (3) the ongoing redirection of tobacco settlement receipts into a special fund beginning in the current year.
Adjusting for these various policy-related changes, ongoing receipts from both vehicle related levies and the SUT are expected to increase by slightly less than 4 percent next year. Tobacco tax receipts are projected to decline slightly, by about 1.5 percent, due to lower cigarette consumption.