Legislative Analyst's Office
The 2003-04 Budget Bill:
|
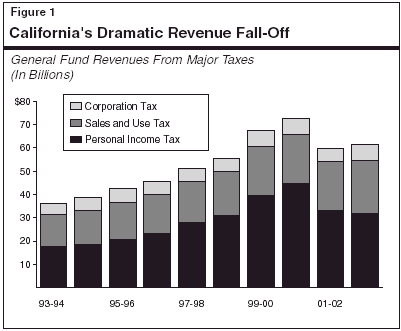
As discussed in "Part I" of this volume, the precipitating factor behind the enormous fiscal imbalance currently facing California is the record postwar deterioration in state revenues that recently occurred. Revenue volatility is certainly nothing new to California, as it has accompanied essentially all of the state's past business cycles. What is unique abut California's most recent experience, however, has been the extreme nature of this volatility, with the state having experienced a truly unprecedented revenue cycle. This is illustrated in Figure 1 (see next page), which shows receipts from the state's three major taxes—the personal income tax (PIT), sales and use tax (SUT), and corporation tax (CT). These combined receipts rose at a modest pace in the early stages of the 1990s' expansion, accelerated late in the decade, then dropped by a staggering $13 billion between 2000-01 and 2001-02—primarily because of a 26 percent decline in PIT revenues. This deterioration reflects the effects of both the recession and the stock market's collapse.
Just as recent revenue performance is the key factor explaining the budget shortfall's emergence, so too will future revenue performance be the key determinant of the amount of expenditure reductions, revenue augmentations, and other solutions necessary to balance the budget. Thus, in making its budget-related decisions, it is critical that the Legislature have available an accurate estimate of the amount of revenues the state can reasonably expect to receive over the next 18 months. Developing such an estimate is especially challenging at this time because the economy is still emerging from the recession, the stock market is still unsettled, and the possibility of war in the Middle East and other uncertainties cloud the outlook.
The remainder of this part provides background information relating to the revenue outlook, discusses recent revenue developments, summarizes the budget's revenue projections, and presents our own revenue forecast. Among the key questions considered are: (1) how much further might PIT receipts fall in the current year; (2) when will a meaningful, broad-based revenue rebound from all major tax sources begin; and (3) how strong will this bounce-back be?
The 2003-04 Governor's Budget projects that California state government will receive $96.1 billion in revenues during 2003-04, a 9.1 percent increase from the current year. These revenues are deposited into either the General Fund or a variety of special funds. Figure 2 shows that:
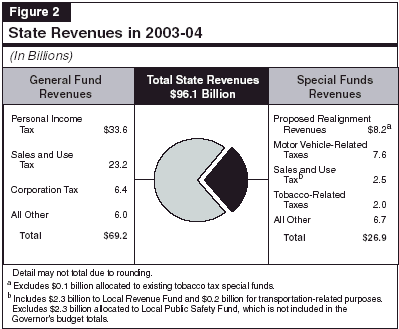
As the figure shows, some revenues, such as the SUT, support both the General Fund and special funds.
Sources of General Fund Revenues. Figure 2 indicates that over 90 percent of total General Fund receipts are attributable to the PIT, SUT, and CT. The remainder comes from a variety of smaller taxes (including the insurance, estate, tobacco, and alcoholic beverage taxes), as well as investment earnings and various transfers from special funds. The 2003-04 General Fund total also includes $1.5 billion in new revenues associated with the budget's proposal to renegotiate gaming compacts with various Indian tribes.
Figure 3 summarizes the budget's General Fund revenue outlook for 2002-03 and 2003-04.
Current-Year Forecast. The budget forecasts that General Fund revenues and transfers will total $73.1 billion in 2002-03, a modest 1.3 percent increase from the prior year. The prior-year and current-year revenue totals and growth rates reflect numerous one-time actions, including tobacco securitization in 2002-03, loans from special funds in both years, and the 2001-02 repayment of the General Fund's loan of $6.2 billion to the Electricity Power Fund for energy purchases. The 2002-03 revenue total also includes the effects of the tax increases and accelerations passed in conjunction with the current-year's budget.
If the distorting effects of these one-time factors on revenue growth are eliminated, underlying revenues are up by 1.4 percent in the current year. This reflects the administration's assumption that revenues from each of the major taxes will be soft in 2002-03, due to sluggish economic conditions.
Budget-Year Forecast. The administration forecasts that General Fund revenues and transfers will total $69.2 billion in 2003-04, a 5.5 percent decline from the current year. The drop is mainly related to the $8.5 billion in one-time revenues and transfers included in the current year totals (including $4.5 billion from tobacco securitization, about $3 billion in one-time loans and transfers, and $1 billion in one-time revenues). Excluding these and related factors, underlying revenues are projected to increase by 2 percent. This modest growth rate is related to the administration's assumption that the sluggish economic expansion in 2003 will boost revenues from the state's major taxes only modestly in the 2003-04 fiscal year.
The current-year and budget-year General Fund revenue totals include the impact of a variety of revenue-related changes enacted with the 2002-03 budget as well as the Governor's revenue-related proposals for 2003-04. Figure 4 (see page 44) displays the fiscal impacts of these measures (please note that the Governor's major realignment-related tax increase proposals that were identified in "Part I" of this volume are discussed separately in "Part V"). It shows the following:
Figure 5 presents our General Fund revenue outlook for 2002-03, 2003-04, and 2004-05. Our projections are based on our economic and demographic forecasts presented in "Part II," reflect all of the Governor's proposals—including the receipt of $1.5 billion in tribal gaming revenues—and take into account the recent negative cash developments noted below.
LAO's Forecast Up $1.3 Billion From Budget. As noted in "Part I," our General Fund revenue forecast is up from the administration's forecast by a net of $1.3 billion over the current- and budget-years combined. This net two-year increase is the combined result of two opposing factors. Specifically, we believe that cash trends point to lower revenues in the current year, but that the renewed economic expansion in late 2003 will produce higher revenues in 2003-04.
Down $180 Million From Budget. We forecast that General Fund revenues and transfers will total $73 billion in the current year, a 1 percent increase from 2001-02. As shown in Figure 5, we are forecasting increases in SUT and CT revenues, but a significant decline in PIT receipts. Compared to the administration, our forecast is down a total of $180 million, reflecting nearly $1 billion less in PIT receipts, partly offset by higher collections from the other major tax sources.
Current-Year PIT Receipts Are Soft. Our lower estimate of PIT revenues is largely related to soft year-end cash receipts from this source. The PIT payments—other than withholding that the state receives in late December and January—are very important in assessing the current PIT revenue outlook, since they are related to quarterly estimated payments remitted by taxpayers with substantial amounts of capital gains and other forms of nonwage compensation. These receipts often provide an early indication of the strength or weakness of the payments received by the state the following spring, when final PIT payments are due. This January, these December-January nonwithholding payments were about $250 million below the administration's updated forecast. Although this deviation is only one-fourth the size of last year's, such lower-than-expected receipts still suggest that final payments on 2002 returns will also be down from the administration's expectations—perhaps by $500 million or more. Combining this $750 million total with the likelihood of further softness in current-year prepayments suggests that 2002-03 PIT revenues will end up falling short by roughly $1 billion.
Trends in other revenue indicators have been more positive. In particular, PIT withholding and CT prepayments have been a little stronger than we would have expected, given the economy's current sluggishness. Nevertheless, given the fact that year-end PIT prepayments have been such an important indicator in the past and that the PIT is our largest revenue source, recent cash developments constitute on balance a significant negative factor in the near-term revenue outlook.
Up $1.5 Billion From the Budget. We forecast that revenues and transfers will total $70.6 billion in 2003-04, a 3.2 percent decline from the current year. After adjusting for the special factors affecting both current-year and budget-year receipts, the underlying growth rate from ongoing revenue sources is somewhat stronger—about 4.5 percent. Our 2003-04 forecast is up about $1.5 billion from the budget projection, consistent with our expectation of a somewhat earlier and stronger rebound in the economy. Most of this net revenue gain is from higher SUT and CT receipts. In contrast, we expect the PIT to be down slightly from the budget's forecast.
Moderate Growth Projected. We forecast that total revenues and transfers will increase by about 3.8 percent in 2004-05, to $73.3 billion. Excluding the impact of the Governor's policy proposals on the revenue totals, the underlying increase would be about 6.5 percent. This increase is consistent with our assumption that the economic rebound will gain momentum in 2004, thereby boosting revenues from all three of the state's largest taxes during the year.
As indicated above, the state's three major taxes—the PIT, SUT, and CT—are expected to account for over 90 percent of total General Fund revenues in 2003-04. Thus, the performance of these taxes will dominate the overall revenue outlook. In the following sections, we discuss in more detail recent developments and the outlook for each of these three key taxes.
Personal income taxes account for about 48 percent of forecasted total General Fund revenues in 2003-04. Although its share has fallen significantly since 2000-01, the PIT remains by far the largest source of state General Fund revenues. In general, the PIT is patterned after federal law with respect to reportable types of income, deductions, exemptions, exclusions, and credits. Under the PIT, taxable income is subject to marginal rates ranging from 1 percent to 9.3 percent, with the top rate applying to taxable income in excess of $76,582 for joint returns in 2002.
Recovery to Begin in 2003. Our forecast of PIT liabilities is shown in Figure 6 (see next page). After soaring in the late 1990s, PIT liabilities have plunged during the past two years, falling by over 30 percent from the peak reached in 2000. We forecast that liabilities will recover slowly in 2003, before accelerating in 2004.
Factors Behind the Liability Forecast. As indicated in Figure 6, the majority of the PIT liability decline between 2000 and 2002 was related to a huge drop in stock options and capital gains, both of which are subject to PIT taxation. Combined PIT liabilities attributable to these two sources fell from $17 billion in 2000 to $6.5 billion in 2001, and further to $4.7 billion in 2002. Liabilities from other income sources, such as ordinary wages,
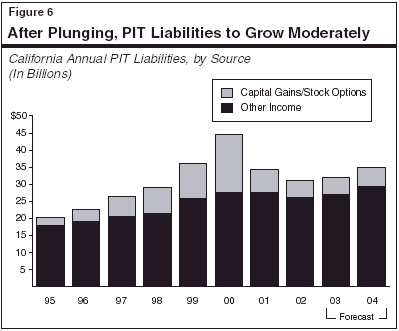
business earnings, interest, rents, and pensions, fell modestly, reflecting the impacts of the general economic slowdown on employment, wages, and profits in the economy. Looking ahead, we forecast that PIT liabilities will grow moderately faster than personal income in 2003 and 2004, reflecting both a strengthening economy and the PIT's progressive rate structure.
As noted above, our forecast for 2003 and beyond does assume that PIT revenues will benefit from an overall improvement in economic activity. However, we are not counting on a significant rebound in stock market-related revenues at any time during the forecast period.
In general, this reflects our assumption that the 1990s' dramatic run-up in the stock market will in part be viewed retrospectively as an historical anomaly, especially since it was unaccompanied by many of the factors traditionally viewed as economically justifying such a run-up, like strong profit performance. Thus, we do not foresee such a run-up as recurring, at least in the near term. Furthermore, even if this view proves wrong and the stock market does rebound and expand sharply in the next year, it will likely take capital gains and stock option-related income themselves a while to materially recover. This partly reflects two factors:
Given the above, the odds are small that PIT liabilities will be significantly boosted from this source.
Based on our estimated changes in PIT liabilities, we forecast that fiscal-year PIT receipts will decline from $33 billion in 2001-02 to $31.9 billion in 2002-03, and then expand to $33.6 billion in 2003-04 and $36.2 in 2004-05. Even with these latter two years' gains, however, PIT receipts as of mid-decade would remain nearly $9 billion below their 2000-01 peak level.
Comparison to the Budget Forecast. Compared to the budget forecast, our current projection of PIT revenues is down by $980 million in the current year, and by a much smaller $40 million in 2003-04. Our current-year estimate reflects the impact of the softer near-term cash trends, discussed above. Our budget-year forecast reflects our projection of a stronger rebound in overall economic growth in late 2003 and early 2004, which should boost PIT liability growth by more than assumed by the administration.
The SUT is the General Fund's second largest revenue source, accounting for about 34 percent of total revenues in 2003-04. The main component is the sales tax, which is imposed on retail sales of tangible goods sold in California. Some examples of tax transactions include spending on clothing, furniture, computers, electronics, appliances, automobiles, and motor vehicle fuel. Purchases of building materials that go into the construction of homes and buildings are also subject to the sales tax, as are purchases of computers and other equipment used by businesses. The largest exemption from the sales tax is for most food items consumed at home. The great majority of services are not subject to the sales tax.
The second component of the SUT—the use tax—is imposed on products bought from out-of-state firms by California residents and businesses for use in this state. With the exception of automobile purchases (which must be registered), out-of-state purchases are difficult to monitor, and the state is prohibited under current federal law from requiring most out-of-state sellers to collect the use tax for California. As a result, use tax receipts account for only a small portion of total SUT revenues.
The total SUT rate levied in California is a combination of several different individual rates imposed by the state and various local governments. These include:
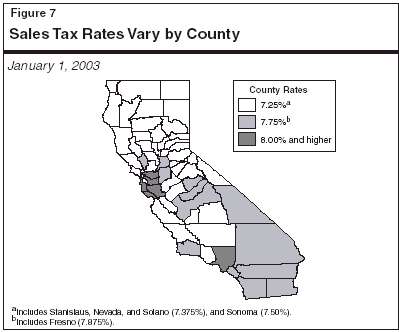
Combined SUT Rates. The combined state and local SUT rate varies significantly across California due to differences in the local optional rates that are levied. As depicted in Figure 7, the combined SUT rate currently ranges from 7.25 percent (for those counties with no optional rates) up to 8.5 percent (for the City and County of San Francisco). No county currently imposes the maximum allowable SUT rate of 8.75 percent. Imposition of the Governor's proposed 1 percent rate increase for realignment would boost the current SUT rates up to a range of 8.25 to 9.5 percent.
The key determinant of annual sales tax receipts is the performance of consumer and business spending on taxable items. Figure 8 shows recent and projected changes in taxable sales. After increasing by 12 percent in 2000, taxable sales declined by 1.5 percent in 2001, and another 0.7 percent in 2002. Looking at detailed industry data for 2001 (the most recent year for which such data are available), the main culprit behind the downturn was exceedingly weak business spending, which was down by nearly 10 percent in the fourth quarter of that year. Retail spending by consumers has fared better, reflecting strong car sales, and mixed results elsewhere.
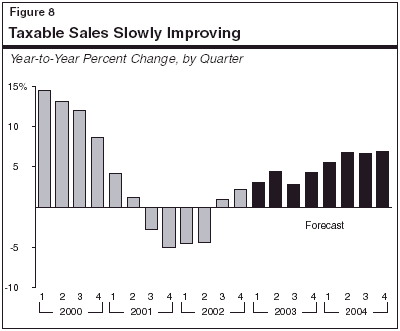
It appears that total taxable sales bottomed out in early 2002 and expanded modestly in the second half of the year, reflecting slow gains in consumer spending and a second-half increase in home construction.
Taxable Sales Outlook—Accelerating Growth in Late 2003. We forecast that taxable sales will continue to grow at a sluggish and uneven pace in early 2003, reflecting continued softness in business-related spending, and some retrenchment in auto sales. We expect sales to gain momentum in the second half of the year, as business spending begins to accelerate. Overall, we forecast that taxable sales will increase by 3.6 percent for 2003 as a whole and 6.5 percent in 2004, or roughly in line with personal income growth for the two years.
Based on our forecast of taxable sales, we project that SUT receipts will increase from $21.4 billion in 2001-02 to $22.6 billion in the current year. About one-half of the year-to-year projected increase is related to slow underlying improvement in taxable sales. The other half is related to the fact that the SUT rate had been reduced by one-quarter percent during the first half of 2001-02 due to a previously adopted "trigger" provision, lowering revenues by about $600 million in that fiscal year.
In 2003-04, we forecast that sales tax receipts will increase to $23.8 billion, a 5.1 percent increase from the current year. This anticipated growth is due to our projected acceleration of taxable sales beginning in the second half of 2003.
Comparison to the Budget Forecast. Our SUT estimate is up from the budget forecast by $251 million in the current year and by $540 million in 2003-04. Our higher forecast for SUT receipts is related to our assumption of an earlier and stronger recovery in taxable sales beginning in the second half of this calendar year.
The CT is levied at a general tax rate of 8.84 percent on California taxable profits. Banks and other financial institutions subject to the CT pay an additional 2 percent tax, which is in lieu of most other state and local levies. Corporations that qualify for California Subchapter "S" status are subject to a reduced 1.5 percent corporate rate. In exchange, the income and losses from these corporations are "passed through" to their shareholders where they are subject to the PIT.
Approximately two-thirds of all CT revenues come from multistate and multinational corporations. These companies have their consolidated U.S. income apportioned to California based on a formula involving the share of their combined property, payroll, and sales that is attributable to this state. California's CT allows for a variety of exclusions, exemptions, deductions, and credits, many of which are similar or identical to those provided under the federal corporate profits tax. Major examples include the research and development tax credit and net operating loss "carry forward" provisions, whereby companies can use a portion of their operating losses incurred in one year as a deduction against earnings in subsequent years. As noted previously, California also offers a MIC (manufacturers' investment tax credit).
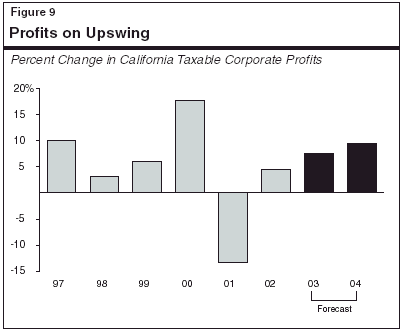
The key determinant of CT receipts is the strength of corporate profits reported on California tax returns by businesses. While these profits have been hit hard by the economic downturn, it appears that the worst is over, and that profits will expand significantly once economic growth picks up. As shown in Figure 9, profits fell by over 14 percent in 2001, as earnings were squeezed by falling sales and large amounts of unused capacity. Businesses then undertook major cost-cutting efforts in 2002, writing off underutilized assets, and scaling back their workforce. Fourth quarter earnings reports for that year suggest that these cost-cutting measures were paying off, as companies reported small increases in sales but larger increases in earnings for the quarter. Consistent with this, December 2002 corporate prepayments were up sharply from the prior December, suggesting that the aggregate annualized earnings of California firms have at least stabilized, and may even have begun to turn upward.
Looking ahead, we forecast that taxable California profits will increase by 7.5 percent in 2003 and by 9.5 percent in 2004 (see Figure 9, next page). While sales and production will likely be restrained in the first half of 2003, we believe that companies will continue to benefit from cost-savings actions taken over the past 12 months. We then expect that profits will improve significantly in the second half of the year when sales and output pick up.
Less Stock Option Activity Should Boost Profits. An additional factor that should boost profits relative to past years relates to stock options.
Specifically, the difference between the grant price and the market price of options which are exercised is deductible as an expense on corporate tax returns. The huge amount of options being exercised in the late 1990s clearly boosted PIT receipts, as discussed previously. However, the options also had the opposite effect on profits reported by companies, who were deducting the options as a business expense. Currently, just the reverse is happening. Namely, the sharp decline in the amount of stock options is depressing PIT receipts, while the reduced amount of corporate deductions for options should have a correspondingly positive effect on the amount of reportable earnings. This is an especially important factor in California's high-tech manufacturing and business services industries, which have been responsible for large amounts of stock options in recent years.
We forecast that CT receipts will be $6.9 billion in 2002-03, a nearly 30 percent increase from the prior year. About one-third of this gain is related to underlying profit improvement, while the remaining two-thirds is due to the net operating loss deduction suspension and other tax-related provisions adopted in conjunction with the 2002-03 budget. These provisions combined will boost CT receipts by $1.1 billion this year. We also forecast that CT receipts will increase further to $7.2 billion in 2003-04. This moderate increase reflects healthy underlying profit growth, but a reduced second-year amount of revenues associated with above-cited 2002-03 tax-related provisions.
Comparison to the Budget Forecast. Our CT forecast is above the budget forecast by $468 million in 2002-03 and by $879 million in 2003-04. The increase is largely related to the recent favorable CT cash trends and our more positive assumption about profit growth in 2002 through 2004.
The remaining 10 percent of total 2003-04 General Fund revenues and transfers consists of taxes on insurance premiums, estates, alcoholic beverages, and tobacco products. It also includes interest income and a large number of other more minor revenues and fees, loans, and transfers. We forecast that combined revenues from all of these "other" sources will fall from $12.5 billion in 2001-02 to $11.5 billion in 2002-03, and then decline further to $6.1 billion in 2003-04. About $4.5 billion of the annual totals is related to ongoing taxes and fees, which we expect will grow modestly over time. The remainder is related to numerous special factors. For example:
Estate Tax Phase-Out Continuing. Our forecast includes the impact on the state of a provision included in the federal tax reduction package passed in the spring of 2001 which is resulting in the phase-out of California's estate tax. This phase-out involves California's voter approval in 1982 of Proposition 6—a statutory initiative that eliminated California's inheritance and gift tax and replaced it with a "pick-up" tax. This pick-up tax equals the maximum state credit that is allowed, under federal law, to be applied against a California estate's federal estate tax liability. For example, if the federal estate tax law allows a $10,000 state credit against a $100,000 federal liability, the state tax would be set at $10,000 and the federal $100,000 tax would be reduced to $90,000 after application of the credit. Thus, while the tax provides revenues for California, it does not impose any net cost on the taxpayer. The 2001 federal change provides for the phase-out of the state credit (and thus the state's pick-up estate tax) over a four-year period, beginning in 2002. This is causing California's estate tax revenues to decline from $891 million in 2001-02 down to an estimated $670 million in the current year, $430 million in 2003-04, and just $220 million in 2004-05.
As shown in Figure 10, the Governor's budget assumes that special funds revenues will total $26.9 billion in 2003-04. This includes about $8.3 billion in new taxes associated with the administration's realignment proposal.
New Realignment Revenues. The Governor's budget includes three major tax increases, the proceeds of which would go into a special realignment fund to support the shift of a roughly equivalent amount of program responsibilities from the state to local governments. The tax increases consist of (1) the establishment of a 10 percent and an 11 percent PIT rate to be imposed on high-income tax payers, (2) a 1 percent increase in the SUT, and (3) a $1.10 per pack increase in the cigarette tax. These major tax proposals are discussed in more detail in "Part V" of this volume.
Other Special Funds Revenues. About one-half of the remaining special funds revenues are associated with motor vehicle-related taxes and fees. These include the vehicle license fee, which is in-lieu of the property tax and whose proceeds are distributed to local governments for their general purposes. They also include fuel taxes and registration fees, which support transportation-related spending. Virtually all of the budget-year increase in such fee revenues is related to proposed increases in various registration fees to address the funding shortfall in the state's Motor Vehicle Account.
Finally, special funds revenues include a variety of other types of taxes and fees. These include a portion of the SUT's revenues (which are related to the 1991 realignment of health and social services programs to local governments), and cigarette taxes (which are earmarked for various anti-smoking and health programs). The budget-year special funds revenue totals also include a variety of increases in fees to support programs in the areas of the courts, higher education, and resources.
In any year, there are a variety of risks and uncertainties in the revenue outlook. One always relates to the future performance of the economy. Another involves stock market activity, including taxpayer decisions regarding, for example, capital gains realizations and the granting and exercise of stock options. Other risks and uncertainties typically can include such factors as domestic and foreign political and military developments, future federal fiscal and monetary policies and, especially in California, developments in such critical areas as energy and water. This year, we are seeing a variety of conflicting evidence concerning the revenue outlook. Our forecast attempts to balance these positive and negative factors. However, we believe that the main risks to the forecast are on the downside, and are related to three key factors: