Legislative Analyst's Office
The 2003-04 Budget Bill:
|
SummaryThe 2003-04 Governor's Budget proposes a major tax increase to help address the budget shortfall by using these new revenues to fund the realignment of various programs to local governments. The budget proposes establishing new personal income tax (PIT) rates on high-income taxpayers, increasing the sales and use tax (SUT) rate by 1 percent, and raising the cigarette excise tax by $1.10 per pack. The proposal is expected to result in additional revenues of $8.3 billion in 2003-04. The administration's revenue proposal raises numerous issues relating to the characteristics of the revenue sources that are slated for a rate increase, as well as regarding the impacts of these tax proposals on the state's business and individual taxpayers. In order to assist the Legislature in its evaluation of this proposal, we suggest a number of criteria upon which the assessment of the Governor's plan should be based. Based on these criteria, we discuss the various characteristics associated with the three taxes, especially with respect to their growth and volatility. In addition, we examine the impact of the tax increase proposal on different categories of taxpayers in the state and on individual taxpayers within them. Finally, given the importance of revenues to the Governor's realignment plan—and the budget as a whole—we also identify and discuss a number of other revenue options the Legislature may want to consider in its deliberations. |
As one of his solutions to the budget shortfall, the Governor proposes a substantial tax increase. The tax proposal involves increasing the rates on three major taxes—the SUT, the PIT, and the cigarette excise tax—and earmarking the revenues resulting from these tax increases for the Enhanced State and Local Realignment Fund (ESLRF). As noted in the realignment discussion in this part, the ESLRF is to be used to provide funds for various programs shifted to the local level as part of the budget's realignment proposal.
In the following discussion, we describe the Governor's tax proposals and their likely revenue impacts on the state. We consider the characteristics of the affected taxes, and how these characteristics might affect their suitability both as a partial solution to the overall budget problem, and as sources of revenue for the Governor's realignment proposal. We also investigate the impact of the tax proposals on individual taxpayers. Finally, we identify various revenue alternatives to the above tax changes and compare them to the Governor's proposals.
The Governor's tax proposal consists of three principal components:
The increase in the SUT rate and the cigarette excise tax rate are relatively straightforward, since—in each case—they involve no change in the nature of the tax base and utilize existing administrative procedures. Our understanding is that the additional state administrative and taxpayer compliance costs from (1) requiring registered sellers to collect an additional 1 cent of the SUT and (2) charging $1.10 more for cigarette tax indicia are relatively minor. However, the PIT rate increase proposal is somewhat more complex and involved, from both the state's and the taxpayers' perspectives.
Specifically, the PIT proposal would result in a new tax rate schedule and require additional withholding schedules for certain taxpayers. The PIT increase proposal would also require the Franchise Tax Board (FTB) to separate PIT receipts resulting from the higher 10 percent and 11 percent brackets from the PIT revenues resulting from the existing tax rates and bracket structure. We discuss this issue further below, when we examine the PIT proposal and consider various associated administrative issues.
Overall Impacts on Taxpayers. The Governor's tax proposal would have very different effects on California taxpayers, depending upon their incomes and consumption patterns. For example, the PIT increase proposal would have a direct impact only on a very limited number of high-income taxpayers. The cigarette tax increase proposal would obviously have a direct effect only on cigarette smokers. Only the proposed increase in the SUT would have a broad-based direct impact on California taxpayers. We discuss the impacts of the individual taxes later in this analysis.
Proposition 98 Considerations. In general, state tax increases implemented in 2003-04 have the potential of raising the Proposition 98 minimum funding guarantee for education. Because of this potential interaction, an important issue related to the budget's proposal is the extent to which its new taxes would be available to address the state's budget shortfall (through realignment or some other means) versus how much would instead be required to go to added school funding (see shaded box, next page).
The administration's view is that because counties and courts—not the state—would receive the new tax revenues, they need not be included in its calculations of the state's Proposition 98 minimum funding guarantee. Thus, the administration reflects these tax increases as special fund revenues and excludes them from the Proposition 98 calculation.
Although the interaction with Proposition 98 is certainly a vital consideration for the Legislature, we would also note that the realignment and revenue proposals warrant consideration on the basis of their own merits as well.
New Taxes and Proposition 98Proposition 98 guarantees a certain level of funding for K-14 education. Given current law, we estimate that this minimum funding guarantee for 2003-04 is $44.1 billion. Should the Legislature wish to increase General Fund taxes to help address the budget shortfall, we estimate that education's funding guarantee would grow by an amount equal to about half of the new tax revenues. Put another way, only half of the new taxes would go towards eliminating the budget gap. The California Constitution allows the Legislature to suspend Proposition 98 in an urgency bill other than the budget bill. Suspension allows the Legislature to fund K-14 education in an amount lower than indicated by the Proposition 98 formulas. The Legislature, for example, could fund education in 2003-04 at the same amount it would have received in the absence of new taxes, or $44.1 billion. Such a one-time suspension of Proposition 98 would not materially alter future state education funding obligations under Proposition 98 relative to what the state's funding obligation would have been without new taxes. Thus, it would allow the full amount of any new General Fund taxes to be applied to addressing the budget problem. |
The proposed tax increases for 2003-04 are estimated to result in total revenues of $8.3 billion, with $8.2 billion to be used to fund the Governor's realignment program. (The remainder of the increase involves cigarette taxes that would be used to compensate special funds for expected revenue losses from consumption declines caused by cigarette tax increases.) Figure 1 indicates the additional revenues estimated for the three taxes through 2005-06. As indicated in the figure, revenue stemming from the high-income tax brackets is expected to decline in 2004-05. This is because in 2003-04—the first year affected by the PIT rate change—there is a one-time "doubling up" of revenues, due to both higher payments for 2003 tax year liabilities and increased withholding for 2004 tax year liabilities. Cigarette taxes are also expected to decline in future years due to ongoing decreased per capita consumption—a trend that has been occurring for some time.
The Governor's proposal to raise tax rates for three of the state's existing revenue sources raises important issues regarding such factors as: the characteristics of the associated revenue streams, their effect on the state's economy, and their impact on the state's taxpayers—both individually and collectively. Some of the taxes' characteristics are of heightened importance due to the fact that their increased revenues are proposed as realignment revenues earmarked to fund particular programs.
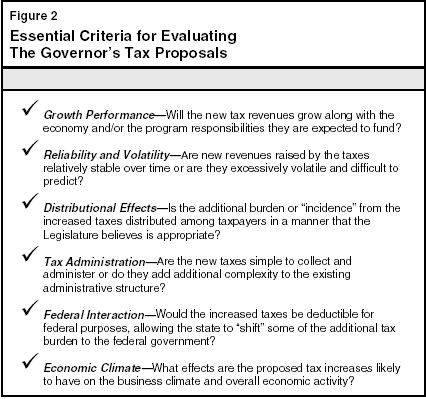
In evaluating changes to the state's tax system, there are a number of commonly cited elements that the Legislature should consider. In very broad terms, these elements relate to the efficiency, equity, revenue sufficiency, and administrative qualities associated with the tax system. Given that the Governor's proposal involves increasing the rates for three particular taxes and devoting the revenues raised to particular programs, there are certain other specific characteristics that the Legislature should also consider in evaluating the appropriateness of the revenue proposals. These characteristics—which are incorporated in Figure 2 (see next page)—are of particular importance given the current budget challenge facing the state.
With these criteria in mind, we next discuss the specific individual changes in taxes that the Governor has proposed.
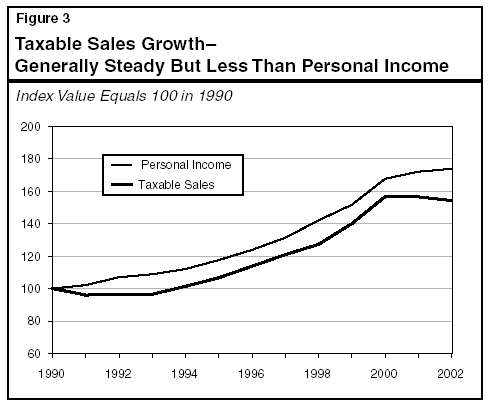
The performance of the SUT and taxable sales (the SUT's primary determinant) has been relatively steady, although on average, their growth has generally lagged that of the overall economy and been a bit more volatile.
Growth. Figure 3 shows the overall growth of taxable sales compared to the state's personal income for the period 1990 through 2003. The annual average growth in taxable sales over this period was approximately 3.7 percent, compared with the overall growth rate in personal income during the same period of roughly 4.6 percent annually.
The reasons for this discrepancy in the two growth rates are partially related to the large increase in personal income that occurred in the late 1990s among high-income taxpayers. Increases in income—particularly for these groups—do not necessarily translate fully into additional taxable consumption. For example, much of the additional earnings may be saved or invested rather than used for current consumption. Furthermore, the lower growth rate in taxable sales (and indirectly, the SUT) is also likely related to some of the structural weaknesses in the tax base, as we discuss below.
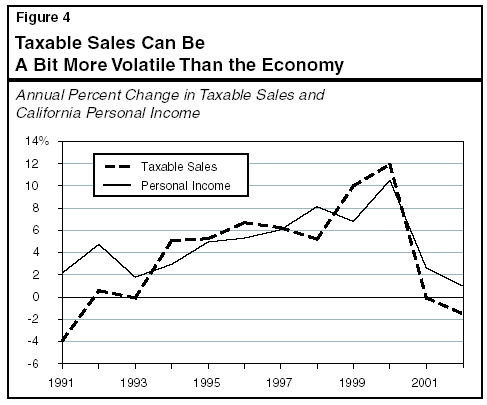
Volatility. Taxable sales exhibit moderate volatility, having fluctuated a bit more than personal income over the last decade. They have been less volatile than some other tax bases upon which the state relies—for example, taxable personal income and corporate profits. Figure 4 (see next page) indicates annual percent changes in taxable sales over the last decade or so and the corresponding changes that have occurred with respect to personal income in California. As shown in the figure, taxable sales oftentimes outperform the economy in an expansion period and under-perform during periods of contraction.
Despite this particular quality, the structure of the SUT makes it somewhat more protected from economic variability in some circumstances than it would otherwise be. This is because the SUT is composed of roughly two-thirds retail sales and one-third business-to-business sales, a profile that makes the tax somewhat protected in the event a decline in either consumer spending or business investment alone occurs.
Despite its overall steady growth and moderate volatility, taxable sales do suffer from some basic weaknesses that could adversely affect the SUT's revenue performance in the medium to long term. These features are particularly important to the extent that revenues from the tax are used for particular program financing rather than having such support come from the General Fund at large, with its more diversified tax base. Specifically, these structural issues are:
Incidence of the SUT. How a tax—and the proposed increase in the SUT in particular—affects taxpayers in the aggregate and individually is one of the key questions that policymakers should consider with respect to the Governor's budget proposal. How the burden of a tax affects different groups of taxpayers is referred to as the tax's "incidence," and is typically measured in relation to the proportion of taxpayers' income that goes to paying the tax.
Most studies have shown that the SUT is a regressive tax—meaning that the proportion of income used to pay the tax decreases as income increases. (In contrast, progressive taxes show an increase in the tax as a proportion of income as income increases.) Thus, economists have found that lower income households pay a larger share of their income in sales taxes than do higher income households.
California's SUT does not levy the tax on food (which accounts for a large share of consumption for low-income households). Even with this substantial tax exemption, however, California's SUT is considered to be generally regressive. Some recent studies have found that the proportion of income spent on taxable purchases ranges from something in excess of 40 percent for households with incomes of $30,000 or less to about 22 percent for households with incomes greater than $100,000. Correspondingly, the percent of income spent on the sales tax for these two groups is about 3 percent and 1.5 percent, respectively. Figure 5 (see next page) shows (using as a guideline the findings of past research) what typical taxpayers in various income classifications would experience due to the change in the SUT rate, given an average level of taxable purchases by each taxpayer.
Overall PIT Growth. Since 1990, personal income in the state has grown rapidly, especially at the higher end of the income spectrum. The annual average growth in personal income in the state from 1990 to 2003 was approximately 4.6 percent. By comparison, the state's income from the PIT has generally grown even more rapidly than overall growth in personal income, largely due to the increased income at the high-end of the income spectrum and the higher average marginal tax rate to which these taxpayers' income is subject. Accordingly, the annual growth in the PIT from 1990-91 through 2002-03 was 5.8 percent. Through 2000-01, the growth in the PIT was significantly higher at over 10 percent, but revenues dropped by over 25 percent in 2001-02.
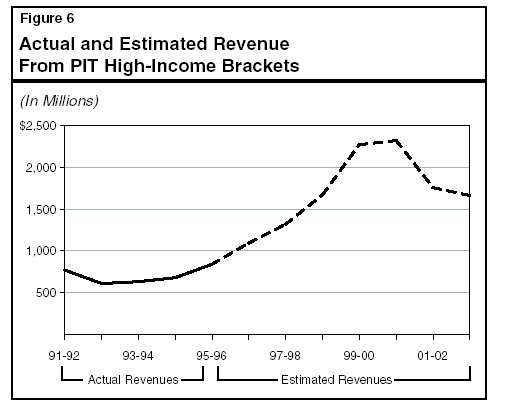
High-Income PIT Growth. Between 1991 and 1995, California had 10 percent and 11 percent brackets in place similar to those proposed by the Governor. Figure 6 indicates the actual revenue that was raised from these higher income brackets during the fiscal years for which they were in effect (1991-92 through 1995-96) and an estimate of the revenue that would have been raised from these brackets had they continued to exist through 2002-03. The revenue that would have been associated with these high-income brackets grew considerably over the period—at an approximate annual rate of 13 percent through 2000-01. However, revenues from the high-income brackets would have declined significantly in the last two years, making the annual growth rate over the entire period equal to 7.2 percent.
Indicators of Volatility. The above growth rates obscure the significant degree of annual fluctuation in revenues generated from these top PIT brackets. As shown in Figure 7 (see next page), over the entire period of the 1990s high-income taxpayers experienced significant changes in personal income relative to other taxpayers. For example, income increased by 28 percent for high-income taxpayers in 1999, but by about 8 percent for all other taxpayers. Similarly, in 2001, income associated with high-income taxpayers dropped by over 22 percent compared to a decline of only slightly more than 1 percent for all other taxpayers.
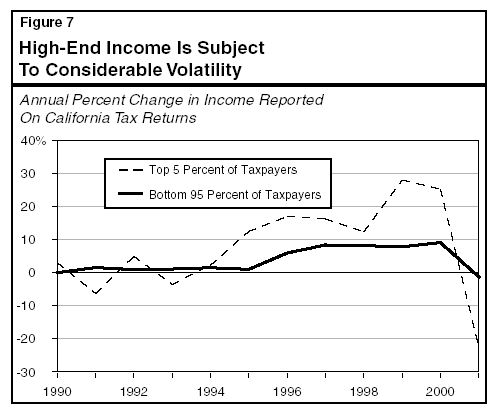
What Is Causing the Volatility? The reason for the volatility in the PIT in general, and that for the PIT revenues from high-income taxpayers in particular, are interrelated. First, there has been an increase in the concentration of income at the upper end of the income spectrum over the last decade, resulting in an increasingly larger proportion of the PIT being paid by taxpayers paying at the highest marginal tax rate. This, coupled with the fact that these very taxpayers receive a large proportion of their income from sources which are themselves quite variable, has led to the increased volatility overall in this revenue source.
The greater volatility at the high end of the income spectrum is largely the result of stock options and certain nonwage income received by this group. Many components of nonwage income fluctuate enormously depending upon economic conditions and taxpayer decisions. For instance, those business profits that are taxed under the PIT tend to swing more than most other forms of income. Similarly, capital gains—which comprised a significant component of high-income taxpayers' nonwage income in the late 1990s—are subject to enormous and frequent swings. The volatility of ordinary wage income compared to these more volatile other income sources is shown in Figure 8.
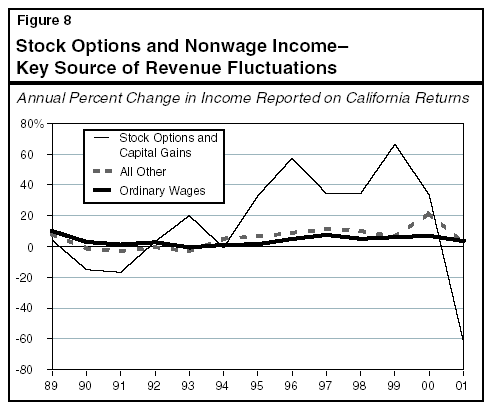
Volatility Will Continue, But Could Lessen. Volatility is likely to be a continuing characteristic of the PIT given the current structure of the tax. Even with the market declines that have occurred, high levels of stock ownership—especially among high-income households—will continue, along with compensation practices involving stock options. Thus, even in a normal market environment, individual company stock performance—along with employee behavior regarding stock options—will have unpredictable impacts on the PIT. These factors, in conjunction with forces underlying the continuing concentration of income in California, make it likely that revenue fluctuations associated with the PIT—especially in the high-income brackets—will continue.
Despite this characteristic, however, it seems likely that future PIT volatility will not reach the extremes of the recent past. Given that the capital gains and stock options gyrations of the last few years have been unparalleled in their magnitude, these fluctuations could prove to be historical anomalies.
Creation of New Tax Schedule. The Governor's tax proposal will result in two additional brackets for high-income taxpayers. As noted earlier, California previously imposed new brackets for high-income individuals for the 1991 through 1995 income years, in response to the previous recession and accompanying budget crisis. The income earned by these taxpayers is currently taxed at the marginal rate of 9.3 percent; however, the proposal will result in a new tax schedule as shown in Figure 9 (see next page).
Incidence of the Tax Increase. It has been estimated that the PIT rate changes proposed will affect approximately 4 percent of all income tax filers (and about 6.5 percent of those filers with a tax liability). The income categories affected by the tax proposal have been responsible for roughly two-thirds of all PIT liabilities in recent years. The change would result in an increase in the share of the total state liability paid by taxpayers with adjusted gross incomes (AGI) of more than $600,000 and declines in the share of the total PIT paid by all other taxpayers. The percentage of the total paid by taxpayers with AGIs of $1 million or more would increase from 19 percent to 23 percent.
How Will Individual Taxpayers Be Affected? Figure 10 shows average tax liabilities and the percentage change in them due to the proposal for each of five AGI classes. Taxpayers in the upper end of the income spectrum would face an average tax increase of 24 percent, or about $27,000, while those in the lowest income class shown in the figure would experience an average increase of only $2. We should also note that the tax increases are also likely to affect a large number of businesses that file under the PIT, such as partnerships, sole proprietorships, and Subchapter S corporations.
Under most circumstances, some of the increase in taxpayers' state tax liabilities is likely to be offset by reduced federal income taxes due to the deductibility of state and local taxes for federal income tax purposes. For example, as noted above, an average taxpayer with AGI of $1 million or more would have an increased state liability of $27,360 under the Governor's proposal. That taxpayer's federal taxes, however, would decline by $10,561 (due to higher itemized deductions for state taxes). This deductibility feature would result in reducing the additional net taxes to $16,799. We discuss additional issues associated with deductibility below.
Due to a variety of factors, the per capita consumption of cigarettes in California has trended downward over the last 20 or so years. As shown in Figure 11 (see next page), per capita cigarette consumption in the state has declined from 124 packs annually in 1980-81, to an estimated 35 packs annually in 2003-04. The number of packs consumed in California dropped from a peak of 2.9 billion in 1980-81 to an estimated 1.2 billion in 2002-03. This drop occurred despite the fact that California's population grew by roughly 50 percent over the same period.
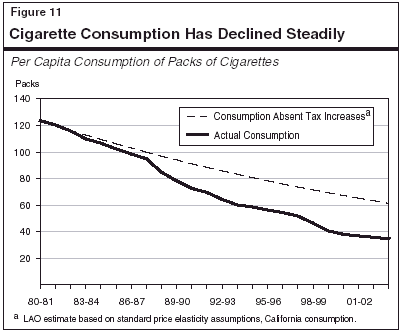
The main reasons for the over 70 percent decline in per capita consumption are the following:
Figure 11 indicates that if the adverse consumption effects of tax-induced price increases were removed from the calculations, per capita cigarette consumption would still have declined. These declines, primarily due to smoking restrictions and health concerns, have averaged on the order of 3 percent per year.
It should be noted that the data involving consumption are based on actual sales of cigarette stamps sold for tax purposes. To the extent that there has been increased evasion, however, there will be a discrepancy between the apparent consumption, shown in the official tax data, and actual consumption of tobacco products. That is, actual consumption will be greater than that suggested by the data.
The effect of tax evasion (primarily smuggling and stamp counterfeiting) has been of concern to states and federal regulatory agencies for some time, but has increased in importance in recent years as many states and the federal government have raised their cigarette excise taxes. Tax increases—including those proposed by the administration—increase existing incentives to engage in tax evasion and cigarette smuggling activities, leading to additional governmental revenue losses.
While the data on cigarette smuggling and tax evasion activity are sketchy, the BOE puts the total annual state revenue loss due to tax evasion at between $130 million and $260 million, a range that generally coincides with state-by-state estimates reported by the General Accounting Office. We examine revenue impacts and other issues associated with cigarette tax evasion in our write-up regarding the BOE in the Analysis.
Given the above, the administration's estimate of the revenue gain from the cigarette tax increase proposal is subject to a number of risks and uncertainties. One, of course, is that evasion could rise. Another involves price effects. In terms of declines due to price increases (including those arising from higher taxes), most studies have shown that consumption declines by approximately 5 percent for every 10 percent increase in price. These estimates of the consumption response to a price increase (known as price elasticity of demand) have been based on situations where the percentage price increase has been relatively modest.
With larger price increases (such as those that would likely result from the adoption of the Governor's proposal), however, the established price-consumption relationship may not hold. Thus, if there were a larger-than-normal consumption decline due to a significant increase in price from the proposal (assuming the tax is largely passed through to consumers), revenues would be lower than estimated.
In considering the Governor's proposal, a related question that should be addressed is: How much should the state tax cigarettes? This involves considering both the tax's incidence and the social costs (or "externalities") associated with smoking.
Incidence of the Tax. In general, economists have concluded that the cigarette excise tax is a regressive tax, in that it is largely borne by the consumer, and imposes a greater burden on low-income individuals than on high-income individuals. Research has indicated that cigarette expenditures amount on average to over 3 percent of incomes in the bottom income quartile but only 0.4 percent in the highest income quartile.
Social Costs. There is some divergence of opinion among economists and tax analysts regarding the "appropriate" level of cigarette taxation. If the appropriate level of taxation on cigarettes is an amount that basically recovers the adverse external costs imposed on society by smokers (such as increased health care costs), much of the existing research indicates that the tax should be less than $1 per pack. However, these estimates have not traditionally included such factors as (1) impacts of secondhand smoke on nonsmokers and (2) adverse effects on infant birth weight of smoking by pregnant women. Including these factors could justify cigarette taxes in excess of $1 per pack according to some researchers. In addition, some analysts have argued that—due to tobacco's addictive qualities—there are reasons beyond simply recovering social costs that justify additional taxation.
The significant cigarette tax increases that have been recently proposed in California and other states have undoubtedly had an adverse impact on the interest rates and other terms of tobacco securitization bond sales across the nation. Investor expectations about future tax increases are important because (1) tobacco settlement receipts are the sole security for the tobacco bonds; (2) under the terms of the 1998 agreement between the states and cigarette companies, settlement payments are tied to national cigarette consumption levels; and (3) consumption levels can be reduced by tax increases imposed by states.
The expectation of future cigarette tax increases in California and other states were incorporated within the terms of California's first securitization bond sale, which was completed in January 2003, and these expectations will also affect the terms of the state's second sale, currently planned for later this spring. Once the bonds are sold, enactment of a tax increase would have no further impact on the state's ability to raise the planned $4.5 billion in cash. However, higher taxes and reduced consumption levels may affect (1) the amount of time it takes the state to retire the debt and (2) the amount of interest the state will have to pay in the future to retire the bonds.
The cigarette tax is susceptible to other influences that may affect its performance as a governmental revenue source, over which state and local governments have no control. First, as a regulated substance, cigarette sales and consumption could be further restricted in a fashion that would lead to additional reductions in smoking and reduced taxes. Second, additional taxation at the federal level (or cost increases to manufacturers) would lead to price increases for California smokers and a reduction in revenue, either due to actual consumption declines or increased smuggling.
The Governor's proposal is to devote the revenues from the above three increased tax rates toward the funding of specific realigned programs. The above examination of these increases indicates that the taxes exhibit very different characteristics:
Given these features associated with the individual taxes, two important questions arise:
Based on a simulation using our economic and revenue projections, we estimate that the realignment revenue portfolio would grow in the range of 5.5 percent to 6 percent annually during the next five years. With respect to volatility, the combined portfolio is obviously more stable than the PIT alone, but still displays substantial swings. The data and our simulation basically indicate that the other components of the tax package do not fully compensate for the significant swings in PIT revenue from the high-income tax brackets.
A major concern with the Governor's realignment proposal is whether the revenue stream that is proposed is one that can be reasonably assumed to provide adequate revenue for funding the various program responsibilities to be taken on by local governments. We estimate that the growth in realignment revenues is potentially somewhat lower than overall growth in the programs being shifted to local governments. This may constrain the ability of local governments to fund programs in the future at the level they would prefer. In addition, the tax portfolio has displayed significant volatility in the past, and is likely to continue to manifest this characteristic in the future. This may pose problems for local governments, which have fewer tools to manage volatility than does the state. We discuss these issues further in the companion piece in this part on realignment.
How Can a Potential "Mismatch" Be Addressed? In the case of the state government, there is a large variety of revenue sources available and considerable latitude in being able to adjust these sources to reflect expenditure choices. In the case of the Governor's realignment proposal, however, local governments are likely to be somewhat limited in their expenditures by the characteristics of the new revenue sources. Given this, it becomes important to develop a means to address possible funding shortfalls.
The SUT. Since the increase in the SUT builds from the state's existing tax administrative system, there would not be any significant tax administration issues associated with this portion of the tax proposal. In addition, this tax revenue would be allocated to local governments based on statewide taxable sales, such that local government land use decisions would not have an effect on the tax.
The Cigarette Tax. Although the proposed increase in the cigarette tax also builds on an established system, there are already identified compliance problems associated with the tax base. As discussed earlier, additional cigarette taxes are likely to worsen the existing compliance problem, possibly requiring significant additional enforcement resources devoted to preventing tax evasion.
The PIT. The PIT increase also raises administrative issues, particularly with respect to allocating revenues from the high-income brackets to the realignment programs. The proposal would require the FTB to separate PIT revenues generated by the 10 percent and 11 percent brackets from all other PIT revenues. While the FTB has carried out such procedures for the purposes of research and analysis, its existing methodology has not been used prior to this date for the actual allocation of revenue, since all PIT revenues have been devoted to the General Fund.
An additional concern is that actual data regarding PIT revenues are not available when the budgets for the local governments receiving the funds are adopted. In fact, actual tax data may not be available until 12 to 18 months after final PIT payments are due for the previous tax year. Thus, for example, information regarding the 2002 tax year may not be available until the middle of 2004. This time lag would require the use of estimates for purposes of revenues flowing into the ESLRF. Reconciliation of the accounts would then need to take place subsequently when data on actual taxpayer returns are available.
Business Taxpayers. Under federal law, businesses can deduct all state and local taxes from their federal returns as business expenses. This will result in lowering their federal tax liabilities, and partially offset the state tax increases.
Individual Taxpayers. The federal government allows the deduction of certain state and local taxes from income for federal PIT purposes for those taxpayers who itemize deductions. This reduces a taxpayer's federal taxable income and associated federal tax liability. Among the California taxes that taxpayers are generally allowed to deduct are state income taxes, real property taxes, and the vehicle license fee (VLF).
Unlike many other types of state and local taxes, the SUT is not deductible for purposes of the federal PIT. Therefore, taxpayers would not be in the position of being able to reduce their federal PIT due to the increase in SUT taxes paid. This nondeductibility also applies to any excise tax, including the cigarette tax.
For itemizing taxpayers, California's PIT is deductible from income for federal income tax purposes. As shown earlier, this can result in a reduction in federal taxes (when state taxes are raised) equal to the amount of the state PIT change times the taxpayer's federal marginal tax bracket—or 38.6 percent for high-income taxpayers. However, the full deduction may not be available in many cases. In particular, the effects of the deduction are lessened for some higher income taxpayers and completely eliminated for others. This is due to two factors:
As noted earlier, the addition of the high-income brackets is estimated to raise $2.6 billion in 2003-04. Absent the above factors, federal deductibility would result in reduced federal tax liabilities of about $1 billion. However, due to the above factors, we estimate that the reduction in federal taxes will actually be about $550 million, resulting in a net tax increase to high-income Californians of approximately $2 billion.
In weighing various budget options—and the appropriate role of any revenue increases—the Legislature should consider the effect that such decisions can have on economic activity in the state and the state's business climate. While taxes can be a deciding factor for some firms, the level of state taxation has not been identified in most studies as a major factor that is considered by investors seeking to expand or relocate activities. Typically, in fact, taxes are well down the list of considerations after such major factors as access to markets, transportation availability, general infrastructure, and labor availability and productivity. Nevertheless, taxes clearly enter into business and individual decisions with regard to their location and investments. In addition, given the current subdued economic conditions in the state, taxes may take on a heightened importance as businesses and individuals attempt to minimize their costs.
With respect to its economic environment, California is generally considered a high cost state in which to conduct business, as are most industrial states. However, its overall tax burden relative to income is only slightly above the average for all states and below that of many of the large industrial states. On the other hand, California's tax burden is generally higher than in other western states. In addition, the state has other regulatory and associated business costs that may be higher than in some states.
While the possible effects of any tax increases on California's economic climate should be considered carefully by the Legislature, this should occur with an awareness of the mix of public and private spending. Decisions on the part of the Legislature to invest in infrastructure, education, and other public goods have impacts on the well-being of the state and, in fact, are crucial to its economic performance. Given this, the Legislature needs to carefully balance the role of state expenditure programs with the effects of revenue increases that are needed to fund them. The goal should be a balanced approach to public and private spending.
There are a number of other general approaches the Legislature could consider in terms of revenue options, whether to fund realignment or more directly address the budget shortfall. While the Governor's proposals are strictly limited to raising rates on existing taxes, there are a number of alternatives the Legislature could consider, including broadening tax bases and restricting certain tax programs. Figure 12 shows some of the general alternatives that the Legislature could consider.
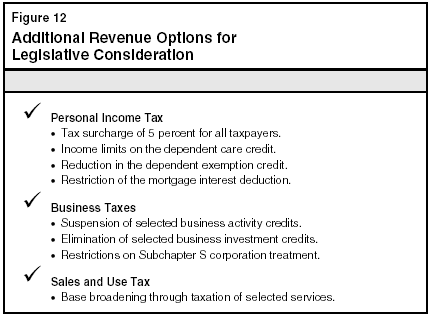
Tax Surcharge. One alternative to a PIT rate increase to the high-income brackets would be to levy a tax surcharge on the before-credit tax liability of all taxpayers. Such a tax surcharge, levied at a rate of 5 percent, would result in additional revenues of approximately $1.5 billion annually. This approach would keep the state's basic existing rate structure in place—and thus its distributional effects—by requiring all taxpayers to pay an additional but proportionately similar amount. The approach also avoids incorporating at least some of the revenue volatility that would result from the proposed high-income brackets.
Tax Expenditure Programs. Other PIT options would involve reforming or eliminating some of the tax expenditure programs (TEPs) currently available to taxpayers. For example, the dependent care credit allows a refundable credit equal to a specified percent (varying with income level) of household and dependent care expenses incurred as necessary costs to sustain employment. The credit is available to taxpayers with annual incomes of up to $100,000. Limiting the availability of the credit to those earning $50,000 or less would result in additional revenues of $60 million annually; eliminating the credit entirely would result in additional revenues of $220 million in the budget year.
Other TEP changes that the Legislature might consider include:
Businesses located in California are generally subject to a tax rate of 8.84 percent on income earned in the state. California also grants various credits, deductions, and other tax provisions, usually in order to encourage additional business activity. These TEPs are available to businesses through the corporation tax, the PIT, or the SUT, depending upon the structure and activity of the business. Suspending, eliminating, or limiting these TEPs could result in additional revenues for the state. For example:
As we discussed earlier, while the SUT has shown steady overall growth, in the recent past it has generally lagged somewhat the overall growth in the economy. One manner in which to address the revenue implications of this is to broaden the tax base to include certain business or personal services and intangible personal property. For example, levying the SUT on certain entertainment activities—such as admissions fees, private club memberships, and cable television—could result in additional revenues in the mid-to-high hundreds of millions of dollars.
The Governor's tax proposal is administratively more straightforward than SUT base-broadening would be. The taxation of certain services could add additional complexities to the tax system, which would likely extend beyond a short transition period. For example, the taxation of some business service purchases by firms with locations out-of-state would be difficult to enforce without the existence of an effective multistate compact or similar institutional framework.
The Governor's tax proposal is just one of many options for changing the state's tax system and providing additional revenues to assist in addressing the budget problem in a manner that reflects the Legislature's priorities. If raising additional revenues is one of the broad approaches the Legislature wishes to consider in dealing with the state's budgetary shortfall, the Legislature needs to address what its fundamental tax policy objectives are, and what types of tax changes are needed to most appropriately achieve these objectives. The fiscal, economic, and distributional consequences of these tax changes should be carefully examined and weighed to determine whether they are consistent with the Legislature's objectives with respect to their effects on both the state's finances and its individual and business taxpayers.