Analysis of the 2004-05 Budget BillLegislative Analyst's Office
|
As always, a key determinant of California's current budget outlook is the strength of state revenues. These revenues will be affected by the performance of the state's economy, decisions by investors regarding their stock options and capital gains, numerous policy actions taken in past years, and proposals included in the Governor's current budget. In this Part, we provide background information relating to the revenue outlook, discuss recent revenue developments, summarize the budget's revenue projections, and present our own revenue forecast.
The 2004-05 Governor's Budget projects that California's state government will receive over $97 billion in revenues during 2004-05, a $4.3 billion (1.3 percent) increase from the current year. These revenues are deposited into either the General Fund or a variety of special funds. Figure 1 shows that:
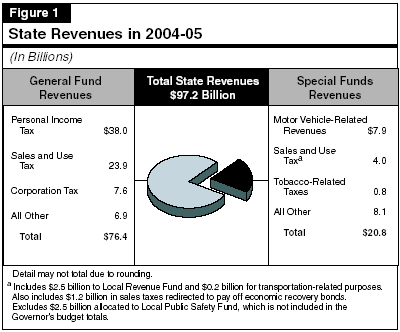
As the figure shows, some revenues, such as sales and tobacco taxes, support both the General Fund and special funds.
Sources of General Fund Revenues. Figure 1 indicates that about 91 percent of total General Fund receipts are attributable to the state's "big three" taxes—the personal income tax (PIT), the sales and use tax (SUT), and the corporation tax (CT). The remainder comes from a variety of smaller taxes (including insurance, estate, tobacco, and alcoholic beverage taxes), as well as investment earnings and various loans and transfers from special funds.
Figure 2 shows the effects of policy changes and other special factors on tax revenues for 2002-03 through 2004-05. This table does not include numerous other special factors involving nontax revenues, such as loans, transfers, asset sales, or tribal gaming revenues. (These latter factors are discussed below in the "Other Revenues and Transfers" section of this Part.) The figure shows:
|
Revenue Effects
of Recent and |
|||
|
(In Millions) |
|||
|
|
2002-03 |
2003-04 |
2004-05 |
|
2002-03 Changes |
|
|
|
|
Personal Income Tax
(PIT) |
|
|
|
|
Stock option
and bonus withholding |
$200 |
$10 |
$10 |
|
Real estate
sales withholding |
195 |
10 |
10 |
|
Net operating
loss suspension |
175 |
75 |
-50 |
|
Teacher tax
credit suspension |
170 |
— |
— |
|
Other |
142 |
23 |
— |
|
Sales and Use Tax |
|
|
|
|
Waiver of
penalties and interest |
$20 |
— |
— |
|
Corporation Tax |
|
|
|
|
Net operating
loss suspension |
$750 |
$525 |
-$275 |
|
Bank bad debt
reserves |
285 |
15 |
— |
|
Tax credit
auditing |
60 |
60 |
60 |
|
Other |
58 |
51 |
26 |
|
Subtotals, 2002-03 Changes |
($2,055) |
($769) |
($-219) |
|
2003-04 Changes |
|
|
|
|
Personal Income Tax |
|
|
|
|
Voluntary
compliance initiative |
— |
$60 |
$60 |
|
Nonfiler
compliance |
— |
4 |
4 |
|
Sales and Use Tax |
|
|
|
|
Excess sales
tax from General Fund |
— |
$105 |
— |
|
Use tax
collection |
— |
10 |
$10 |
|
Corporation Tax |
|
|
|
|
Regulated
investment trust shelters |
— |
$10 |
— |
|
Voluntary
compliance initiative |
— |
30 |
$30 |
|
Subtotals, 2003-04 Changes |
— |
($40) |
($30) |
|
2004-05 Proposals |
|
|
|
|
PIT nonfiler
compliance—additional funds |
— |
— |
$12 |
|
National
heritage preservation tax credit |
— |
$9 |
10 |
|
Bunker fuel
exemption reinstatement |
— |
-9 |
-18 |
|
Subtotals, 2004-05 Proposals |
— |
— |
($4) |
|
Other Tax-Related
Factors |
|
|
|
|
Manufacturers’
investment credit |
— |
$40 |
$195 |
|
Totals of All
Changes |
$2,055 |
$849 |
$10 |
Figure 3 provides an indication of the trend in "underlying" General Fund revenues—that is, revenues excluding all of the previously adopted and currently proposed policy-related changes and other special factors. These include the tax-related changes shown in Figure 2, as well as numerous other loans, transfers, asset sales, and fee increases adopted in past years or proposed in the current budget. This underlying trend isolates how the state's basic tax structure has been affected primarily by changes in the economy and stock market in the recent past, and how we anticipate it to respond to economic changes in the future. It shows that:
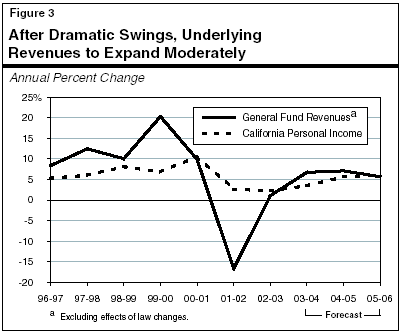
Figure 4 shows the budget's revised estimate of General Fund revenues for the prior year and current year, as well as its forecast for 2004-05. (The revenue totals shown in this Part do not include the $12.3 billion in proceeds from the economic recovery bonds. In "Part I," we display these proceeds separately in our estimates of the General Fund budget condition).
|
Summary of the
Budget’s |
||||||
|
2002-03 Through
2004-05 |
||||||
|
Revenue
Source |
Actual |
2003-04 |
|
2004-05 |
||
|
Estimated |
Percent |
|
Projected |
Percent |
||
|
Taxes: |
|
|
|
|
|
|
|
Personal
income tax |
$32,710 |
$35,117 |
7.4% |
|
$38,043 |
8.3% |
|
Sales and use
tax |
22,415 |
23,714 |
5.8 |
|
25,022 |
5.5 |
|
Corporation
tax |
6,804 |
7,466 |
9.7 |
|
7,609 |
1.9 |
|
Insurance tax |
1,880 |
1,985 |
5.6 |
|
2,078 |
4.7 |
|
Other taxes |
1,070 |
822 |
-23.2 |
|
563 |
-31.5 |
|
Other
Revenues, Transfers, |
||||||
|
Tobacco
securitization bond proceeds |
$2,485 |
$2,262 |
-9.0% |
|
— |
— |
|
Tribal gaming
revenues |
— |
— |
— |
|
$500 |
— |
|
Other
revenues |
1,173 |
1,742 |
48.5 |
|
1,795 |
3.0% |
|
Transfers
related to pension obligation bond |
— |
— |
— |
|
577 |
— |
|
Other
transfers and loansa |
2,785 |
1,520 |
-45.4 |
|
220 |
-85.5 |
|
Totals |
$71,322 |
$74,627 |
4.6% |
|
$76,407 |
2.4% |
|
|
||||||
|
Detail may not total due to rounding. |
||||||
|
a
2002-03 and 2003-04 include large amounts of loans from
transportation funds. |
||||||
Prior-Year Estimate. The budget estimates that 2002-03 General Fund revenues and transfers totaled $71.3 billion, a $470 million increase from the level assumed in the 2003-04 budget (and included in our November report). This increase is largely related to year-end accrual adjustments recently made by the State Controller totaling roughly $270 million for the PIT and about $100 million each for the SUT and CT.
Current-Year Estimate. The January mid-year forecast for 2003-04 assumes that General Fund revenues and transfers will be $74.6 billion, a $3.3 billion (4.6 percent) increase from the prior year. This is up by $1.3 billion from the estimate in the 2003-04 Budget Act. The revision is the net result of three main factors:
2004-05 Forecast. The budget forecasts that General Fund revenues and transfers will be $76.4 billion in the budget year, a $1.8 billion (2.4 percent) increase from the current year. Major taxes are forecast to increase about 6 percent, roughly in line with growth in statewide personal income. In contrast, nontax revenues and transfers are projected to fall by roughly 44 percent, due to smaller amounts of one-time loans and transfers from special funds.
Figure 5 presents our General Fund revenue outlook for 2003-04, 2004-05, and 2005-06. Our projections are based on our economic and demographic forecasts presented in "Part II" previously, and reflect the impacts of the Governor's major revenue-related policy proposals.
|
Summary of the
LAO’s |
||||||
|
2003-04 Through
2005-06 |
||||||
|
|
2003-04 |
2004-05 |
2005-06 |
|||
|
Revenue Source |
Amount |
Percent |
Amount |
Percent |
Amount |
Percent |
|
Taxes: |
|
|
|
|
|
|
|
Personal income tax |
$34,640 |
5.9% |
$37,430 |
8.1% |
$40,080 |
7.1% |
|
Sales and use tax |
23,690 |
5.7 |
25,090 |
5.9 |
26,500 |
5.6 |
|
Corporation tax |
7,450 |
9.5 |
7,560 |
1.5 |
8,250 |
9.1 |
|
Insurance tax |
2,000 |
6.4 |
2,100 |
5.0 |
2,205 |
5.0 |
|
Other taxes |
824 |
-23.1 |
601 |
-27.1 |
527 |
-12.3 |
|
Other
Revenues, Transfers, |
||||||
|
Tobacco securitization bond proceeds |
$2,262 |
-9.0 |
— |
— |
— |
— |
|
Tribal gaming revenues |
— |
— |
$500 |
— |
$513 |
— |
|
Other revenues |
1,750 |
— |
1,803 |
3.0% |
1,689 |
-6.3% |
|
Transfer related to pension obligation bond |
— |
— |
577 |
— |
19 |
— |
|
Other transfers and loansa |
1,520 |
-45.4 |
220 |
-85.5 |
-1,361 |
— |
|
Totals |
$74,136 |
3.9% |
$75,881 |
2.4% |
$78,421 |
3.3% |
|
|
||||||
|
Detail may not total due to rounding. |
||||||
|
a 2003-04 includes a large amount of loans from transportation funds and 2005-06 includes a related loan repayment. |
||||||
Our current forecast is generally similar to the budget forecast. For example, we agree with the administration's assumption that economic growth will result in a strengthening of the state's revenue picture this year and in 2004-05. Our one significant departure from the administration (and from our own November revenue projection as well) is that we have reduced our estimate of PIT liabilities in the 2003 "base year" to reflect recently revised historical information on wages and withholdings (please see discussion in box on page 55). This reduction results in a lower revenue trend, which in turn affects both our current-year and budget-year revenue forecasts. Specifically:
2005-06 Outlook. We forecast that total revenues and transfers will increase from the current year by about $2.5 billion (3.3 percent) in 2005-06, to $78.4 billion. Excluding the impact of the Governor's policy proposals on the 2004-05 and 2005-06 revenue totals, the underlying increase would be a more robust 5.7 percent. This increase is consistent with our assumption that the economic rebound will continue in 2005, boosting revenues from the state's main taxes during the year.
As indicated above, the great majority of General Fund revenues are attributable to the state's three major taxes—the PIT, SUT, and CT. Thus, the performance of these taxes will dominate the overall revenue outlook. In the following sections, we discuss in more detail recent developments and the outlook for each of these three revenue sources.
We project that the PIT will account for just under 50 percent of total General Fund revenues in 2004-05. Although this share has fallen significantly from its peak in 2000-01, the PIT remains by far the largest source of state General Fund revenues. In general, the PIT is patterned after federal law with respect to reportable types of income, deductions, exemptions, exclusions, and credits. Under the PIT, taxable income is subject to marginal rates ranging from 1 percent to 9.3 percent, with the top rate applying to taxable income in excess of $78,266 for joint returns in 2003 (and one-half of that in the case of single taxpayers).
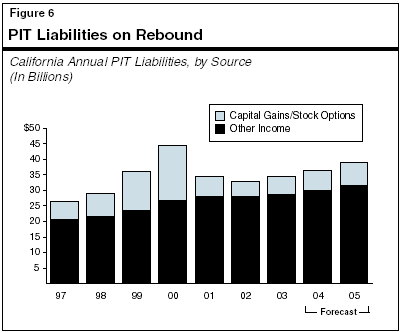
Our forecast of PIT liabilities is shown in Figure 6. After soaring in the late 1990s, PIT liabilities plunged in 2001 by nearly $10 billion (over 20 percent) from their unsustainable peak reached in 2000, and by another $1.5 billion in 2002. Liabilities then experienced a modest partial recovery in 2003. We expect them to grow at a stronger pace in both 2004 and 2005, reflecting healthy gains from most major income sources. Specifically:
Withholding Mysteriously Outpaces Wage GrowthOne of the key determinants of our personal income tax (PIT) forecast is the strength of PIT liabilities in 2003. This base year is important because it serves as the "springboard" for our projections of future PIT revenues. Since actual liabilities for 2003 will not be known until after final 2003 returns are remitted in April 2004, our 2003 liability estimate made prior to that time is based on alternative indicators. These include information on PIT withholding collections, PIT quarterly prepayments, and more detailed wage data once they become available (usually about five months after the end of each calendar quarter). Initial Withholding Indicators Showed Strength. As indicated in Figure 7, after falling in most of 2001 and 2002, these payments turned sharply upward in the first half of 2003, increasing by roughly 8 percent from the prior year. Given the other positive economic indicators available late last year, we interpreted these strong payments as indirect evidence that wages were increasing—particularly in high-paying industry sectors such as information technology and electronics manufacturing. Wage growth in high-paying sectors is significant because, under California's progressive income tax structure, these wages are subject to high marginal tax rates. Subsequent Wage Data Reveal Softness. Our review of historical wage data that were compiled subsequent to the release of our November 2003 fiscal forecast indicates that wage growth in the first half of 2003 was much weaker than we had previously assumed based on the strong withholding gains (see figure). For example: Wages in the second quarter of 2003 (the most recent quarter for which detailed information currently is available) were up only 1.5 percent from the same quarter of the prior year. Wages in the highest-paying industries (that is, the top 10 percent in terms of average annual wages in 2002) were up by a slightly stronger 3 percent, but still by well less than the growth in withholding. Potential Cause of the Discrepancy. We know that some of the discrepancy between withholding and wages is due to law changes enacted along with the 2002-03 budget which increased the withholding rate on bonuses and stock options to 9.3 percent beginning in 2003. When enacted, these changes were expected to increase the overall growth in withholding by about 1.5 percent in 2003—a relatively small amount compared to the actual 8 percent growth that occurred. The true impact of the changes is uncertain, however, since there is no historical data on the amount of wages attributable to bonuses and stock options, nor is there information on what the average withholding rate on such income had been prior to the law change. In view of the lack of wage growth that is now evident, it appears that much of the withholding growth in early 2003 was merely due to an underestimate of the impact of the 2002 legislation on withholding rates, rather than an underlying increase in wages. To the extent this is the case, the withholding increases seen in 2003 do not represent a permanent revenue gain, and will be offset by less final payments and more refunds than projected when final PIT returns are filed in April 2004. It is possible that other factors—such as an underreporting of wages—may be playing a role in the discrepancy. However, given the current lack of hard evidence that this is occurring, we have lowered our estimate of 2003 PIT liabilities to take into account the lack of wage growth during the first half of that year. This downward adjustment to our base-year estimate lowers our underlying PIT revenue trend by about $500 million annually through the forecast period. |
Based on our estimated changes in PIT liabilities, we forecast that fiscal-year PIT receipts will total $34.6 billion in 2003-04, and then expand to $37.4 billion in 2004-05 and $40.1 billion in 2005-06. Compared to the budget forecast, our current projection of PIT revenues is down by $477 million in the current year and by $613 million in 2004-05—or $1.1 billion for the two years combined. As noted earlier and discussed further in the nearby shaded box, our lower PIT estimates primarily reflect our reassessment of historical withholding and wage data for 2003, which suggests that PIT liabilities are less than assumed in the budget forecast.
The SUT is the General Fund's second largest revenue source, accounting for about one-third of total revenues in 2004-05. The main SUT component is the sales tax, which is imposed on retail sales of tangible goods sold in California. Some examples of sales tax transactions include spending on clothing, furniture, computers, electronics, appliances, automobiles, and motor vehicle fuel. Purchases of building materials that go into the construction of homes and buildings are also subject to the sales tax, as are purchases of computers and other equipment used by businesses. Roughly 70 percent of the SUT is remitted by retailers, while the remaining 30 percent is directly paid by businesses who themselves consume or use the products being taxed. The largest exemption from the sales tax is for most food items consumed at home. The great majority of services are not subject to the sales tax.
The second component of the SUT—the use tax—is imposed on products bought from out-of-state firms by California residents and businesses for use in this state. With the exception of automobile purchases (which must be registered), out-of-state purchases are difficult to monitor, and the state is prohibited under current federal law from requiring most out-of-state sellers to collect the use tax for California. As a result, use tax receipts account for only a small portion of total SUT revenues.
The total SUT rate levied in California is a combination of several different individual rates imposed by the state and various local governments. These include:
Impact of Proposition 57 on the Sales Tax Allocation. The budget assumes the approval of Proposition 57 on the March 2004 ballot. This measure authorizes up to $15 billion in bond sales to eliminate the state's 2002-03 General Fund budget deficit and address other obligations. This bond would be repaid through a multiple step process involving the diversion of a one-quarter cent portion of the Bradley-Burns local sales tax to a state special fund created for the purpose of making annual debt-service payments on the bonds. (Local governments would then be reimbursed for their SUT losses through a shift in property taxes to them from schools, which in turn would be reimbursed through added General Fund payments to them.) The diversion of SUT revenues would remain in effect until the bonds are paid off.
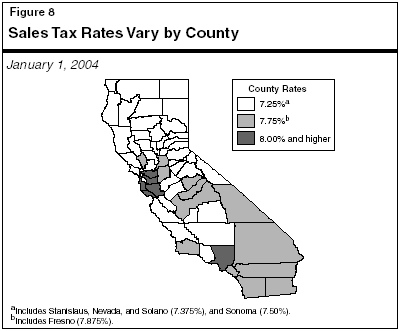
Combined SUT Rates. The combined state and local SUT rate varies significantly across California due to differences in the local optional rates that are levied. As depicted in Figure 8, the combined SUT rate currently ranges from 7.25 percent (for those counties with no optional rates) up to 8.5 percent (for the City and County of San Francisco). No county currently imposes the maximum allowable SUT rate of 8.75 percent.
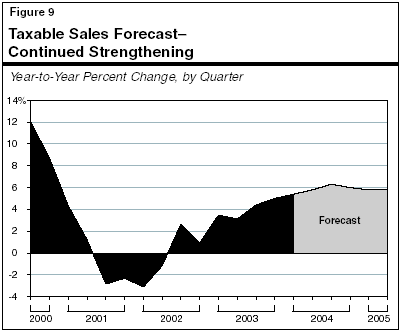
The key determinant of sales tax receipts is the performance of consumer and business spending on taxable items. After falling in both 2001 and 2002, taxable sales increased about 3 percent in the first half of 2003 and by slightly over 4.5 percent during the second half of the year. While we have yet to receive industry detail on the sources of the improvement, we believe that the 2003 increases were primarily related to a revival in business investment spending in the second half of the year (which as noted above accounts for about 30 percent of total taxable sales). Other positive factors included a strong housing market—which boosted sales of building materials, appliances, and home furnishings—and a reasonably healthy holiday shopping season.
Outlook—Continued Growth in 2004 and 2005. We forecast that taxable sales will continue to strengthen, increasing by 5.9 percent in 2004 and 5.8 percent 2005 (see Figure 9). The main positive forces will continue to be healthy business investment and home construction. Consumer spending is forecast to grow moderately, roughly in line with personal income. As with the rest of the country, we believe that household spending in California will be somewhat restrained by high levels of consumer debt.
Farmer Bros. Co. Legal ChallengeThe California Franchise Tax Board has been involved in a legal dispute with the Farmer Bros. Co., a California coffee manufacturer. The state has lost in this dispute at both the Superior Court and Appellate Court levels and, unless reversed by the Supreme Court, these adverse court rulings will have a major negative revenue impact on the General Fund budget. The case involves California's treatment of dividend income under its corporation tax law. Specifically, in determining a company's tax liability, California law allows companies to exclude most of the dividends they receive from another company, if the dividend-paying company also is doing business in California and has had its income subject to California taxation. The basis for this exclusion is that such dividends represent the distribution of earnings that were already subject to income taxation in California, and by allowing the company receiving the dividends an exclusion, the state is avoiding the "double taxation" of such earnings. This exclusion is not allowed, however, for dividends from companies doing business exclusively outside of California regardless of whether the company paying the dividend is subject to income taxes in another state. In the court case at hand, the plaintiff challenged the above law on the grounds that it violates the U.S. commerce clause, by favoring businesses that do business and pay taxes in California over those who do not do business in California. As noted above, Farmer Bros. Co. prevailed against the state at both the Superior Court and Appellate Court levels. The state has, however, appealed the Appellate Court's ruling to the Supreme Court, which has set February 20, 2004 as the date by which it will decide whether or not to hear the case. If the court does not accept the case, or if the state ultimately loses the case at the Supreme Court level, California would be faced with paying net tax refunds of between roughly $0.5 billion and $1.5 billion to the plaintiff and other affected taxpayers, according to the Franchise Tax Board. The exact magnitude and timing of such refunds is not clear at this time. In addition, the state could face ongoing annual revenue reductions of $180 million under a worst-case scenario. |
Based on our forecast of taxable sales, we project that SUT receipts will total $23.7 billion in 2003-04, $25.1 billion in 2004-05, and $26.5 billion in 2005-06. The great majority of the year-to-year changes in these amounts are related to underlying growth in the economy and taxable sales. In contrast, SUT-related law changes play a relatively minor role in the overall revenue totals. Our SUT revenue estimate is similar to the budget forecast—the current-year estimate is down by just $24 million and our budget-year forecast is up by $68 million.
The CT is levied at a general tax rate of 8.84 percent on California taxable profits. Banks and other financial institutions subject to the CT pay an additional 2 percent tax, which is in lieu of most other state and local levies. Corporations that qualify for California Subchapter "S" status are subject to a reduced 1.5 percent corporate rate. In exchange, the income and losses from these corporations are "passed through" to their shareholders where they are subject to the PIT.
Approximately two-thirds of all CT revenues come from multistate and multinational corporations. These companies have their consolidated U.S. income apportioned to California based on a formula involving the share of their combined property, payroll, and sales that is attributable to this state. California's CT allows for a variety of exclusions, exemptions, deductions, and credits, many of which are similar or identical to those provided under the federal corporate profits tax. Major examples include the research and development tax credit and net operating loss carryforward provisions, whereby companies can use a portion of their operating losses incurred in one year as a deduction against earnings in subsequent years Under legislation enacted in 2002, due to the state's tight budgetary situation, corporations were not able to use these losses to offset their income during 2002 and 2003. However, such deductions will be allowed once again in 2004, and the percentage of losses which may be carried forward has been increased in accordance with the above-noted 2002 legislation.
The key determinant of CT receipts is the strength of corporate profits reported on California tax returns by businesses. After falling in 2001 and most of 2002, California earnings rebounded in 2003 (see Figure 10). This turn-around is partly related to the intensive cost-cutting efforts undertaken during the prior two years and the related productivity gains that materialized in 2003. Looking ahead, we forecast that taxable California corporate profits will increase by another 12 percent in 2004 and by 9.5 percent in 2005. While productivity growth will continue to play a key role, the majority of the anticipated profit growth during the next two years is related to expanded sales both at home and abroad.
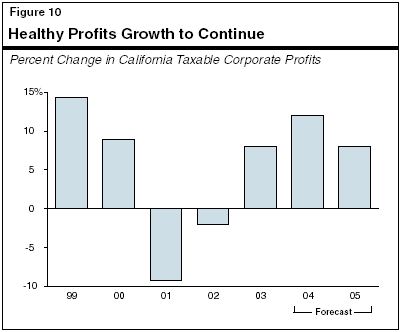
We forecast that CT receipts will be $7.5 billion 2003-04, a 9.5 percent increase from the prior year, and $7.6 billion in 2004-05, an increase of 1.5 percent. The relatively small budget-year increase primarily reflects the conclusion of the two-year suspension of the net operating loss deduction after 2003. Absent this and other special factors shown earlier in Figure 2, the underlying increase in CT collections would be over 10 percent, or more in line with the underlying growth in California taxable profits. It also should be noted that our estimates do not include the significant potential negative effects on corporate tax revenues of the Farmer Bros. Co. legal challenge (see nearby shaded box). Our CT forecast is similar to budget forecast in both 2003-04 and 2004-05.
The remaining 9 percent of total 2004-05 General Fund revenues and transfers consists primarily of taxes on insurance premiums, estates, alcoholic beverages, and tobacco products. It also includes interest income and a large number of fees, loans, and transfers. We forecast that combined revenues from all of these other sources will fall from $9.4 billion in 2002-03 to $8.4 billion in 2003-04, and then further to $5.8 billion in 2004-05. About $4 billion of the annual totals are related to ongoing taxes and fees, which we expect will grow modestly over time. The remainder is related to new proposals and numerous one-time factors. For example:
Estate Tax Phase-Out Continuing. Our forecast includes the impact on the state of a provision included in the federal tax reduction package enacted in the spring of 2001 which is resulting in the phase-out of revenues from California's "pick-up" estate tax. We specifically estimate that revenues from this tax will fall from $647 million in 2002-03 to $400 million this year, to $175 million in 2004-05, and to $100 million in 2005-06.
As shown in Figure 11, the Governor's budget assumes that special funds revenues will total $18.3 billion in 2003-04 and $20.8 billion in 2004-05. About one-third of the budget-year total is related to motor vehicle-related taxes and fees. These include the vehicle license fee, which is in-lieu of the property tax and whose proceeds are distributed to local governments, mostly for their general purposes. They also include fuel taxes and registration fees, which support transportation-related spending. The increases in registration fee revenues in 2003-04 and 2004-05 are related to rate increases enacted with the 2003-04 budget.
|
Summary of the
Budget’s |
|||||
|
2002-03 Through
2004-05 |
|||||
|
Revenue
Source |
Actual |
2003-04 |
2004-05 |
||
|
Estimated |
Percent |
Projected |
Percent |
||
|
Motor Vehicle
Revenues: |
|
|
|
|
|
|
License fees
(in lieu) |
$1,885 |
$1,917 |
1.7% |
$1,970 |
2.8% |
|
Fuel taxes |
3,203 |
3,300 |
3.1 |
3,322 |
0.7 |
|
Registration,
weight, and |
1,987 |
2,269 |
14.2 |
2,591 |
14.2 |
|
Subtotals |
($7,074) |
($7,486) |
(5.8%) |
($7,882) |
(5.3%) |
|
Other Sources: |
|
|
|
|
|
|
Sales and use
tax |
$2,484 |
$2,570 |
3.5% |
$3,952 |
53.8% |
|
Cigarette and
tobacco taxes |
941 |
940 |
-0.1 |
917 |
-2.5 |
|
Interest
earnings |
134 |
124 |
-7.3 |
115 |
-7.5 |
|
Other
revenues |
7,044 |
8,651 |
22.8 |
8,510 |
-1.6 |
|
Transfers and
loansa |
-2,446 |
-1,453 |
40.6 |
-573 |
60.6 |
|
Totals |
$15,230 |
$18,318 |
20.0% |
$20,803 |
13.6% |
|
|
|||||
|
Detail may not total due to rounding. |
|||||
|
a
Includes loans from transportation funds to the General Fund. |
|||||