Analysis of the 2005-06 Budget BillLegislative Analyst's Office
|
Both the U.S. and California economies grew at a solid pace in 2004. As shown in Figure , U.S. real gross domestic product (GDP) expanded by 4.4 percent, the largest gain since 1999. Employment grew modestly despite continued cost-cutting and merger activity by businesses. Prices for oil and raw materials jumped during the year, but overall inflation accelerated only modestly. Looking ahead, we expect economic growth at both the nation and in California to slow some, but continue at moderate pace through the forecast period.
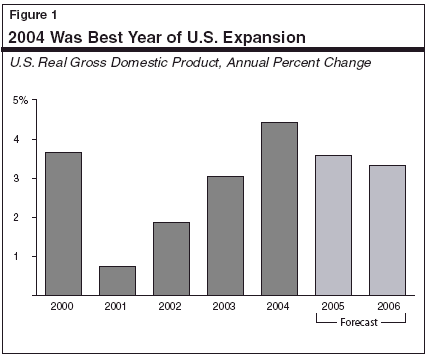
Economic growth in 2004 was driven by a sharp acceleration in business spending and continued above-average gains in consumption. As indicated in Figure 2 :
The current expansion has been characterized by intense competition and a major focus by businesses on reducing costs and finding efficiencies. Over the recent expansion period, these actions have boosted productivity gains, restrained inflation, and contributed to large increases in business profits.
At the same time, however, the intense focus on costs and efficiencies also translated into extremely slow improvement in labor market conditions through 2003, as businesses remained extremely reluctant to add to their payrolls. Economists had become concerned that the lack of hiring would eventually undermine consumer confidence, leading to a downward spiral in spending and output in the economy. However, these concerns eased once employment started to grow in 2004. The lack of stronger job growth remains a concern—for example, it was a factor cited for the decline in one key consumer confidence survey index in January. However, the continued strength in retail spending and home sales suggests that these concerns have not yet had a chilling effect on actual spending by households. (We more fully discuss recent productivity increases and their implications for the economy in the box on page 22.)
|
What Is Behind Recent Strong Productivity Increases? One of the more significant developments over the past decade has been the acceleration in productivity (defined as output per hour worked in the economy). Over the long term, productivity growth is a key determinate of output and income in the economy—with strong productivity translating into rising wealth and living standards. In recent years, high productivity growth contributed to low prices and strong profit growth. On the other hand, it has also been cited as a factor behind the lack of job growth, since businesses have been able to expand production without adding workers. Given these developments, future productivity growth has implications for inflation, job growth, and output growth in the years ahead. Historical Perspective. As shown in the accompanying figure, nonfarm business productivity in the U.S. economy has increased at an average annual pace of 2.3 percent during the past 55 years. The growth rate exceeded that average during much of the 1950s and 1960s, then fell below the average in the 1970s and early 1980s—an era when the economy was absorbing many younger and less experienced workers—before partially recovering in the 1980s and early 1990s. In the second half of the 1990s, the average rate accelerated again—to 2 percent per year in 1995-1999 period and to 3.6 percent during the past five years.
Factors Behind Recent Gains. Economists generally agree that two related factors are principally responsible for the recent surge in productivity gains—expanded use of information technology (IT) and an increase in "competitive intensity" in many sectors of the economy. • Growth in IT. This factor has affected economywide productivity in two ways. First, the IT industry is characterized by innovation, rapidly expanding capabilities, and high-valued products. The rising share of total output attributable to this highly productive industry has, by itself, contributed to economywide productivity growth during the past 10 to 15 years. Second, there is evidence that—after many false starts in the 1990s—investments made by companies in IT products are finally paying off in the form of streamlined inventory management, and improvements in marketing, purchasing, and production activities. • Intense Competition. A second and closely related factor cited by economists has been increased competitive intensity that emerged in the mid-1990s in a wide variety of industries ranging from retailing, manufacturing, airlines, banking, and telecommunications. Factors cited for the increased intensity include deregulation and globalization. In this highly competitive environment, productive companies—those that are most successful in organizing work flows, holding down costs, and targeting markets—are expanding at the expense of their less productive counterparts. Outlook. Most forecasters assume that the nearly 4 percent annual increases will subside as the pace of mergers and cost-cutting activities slows and businesses focus more on expanding operations to meet future growth. We forecast that productivity growth will settle into the range of 2.5 percent per year over the forecast period. Such gains would still be quite high compared to gains recorded during similar stages of past expansions. We believe that the continued gains will benefit both businesses, in the form of higher profit margins, and their employees, who will benefit from lower prices and potentially larger wage gains. At the same time, the productivity increases we are projecting also imply that job growth will remain well below the rates in previous economic expansions. |
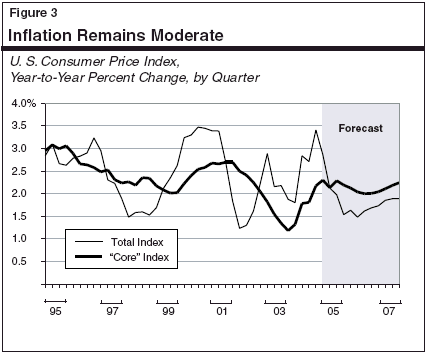
Inflation accelerated significantly in 2004, but the increase was relatively mild in view of the dramatic jump that occurred in energy and raw material prices. As indicated in Figure 3, growth in the U.S. consumer price index (CPI) rose from 1.8 percent in the first quarter of 2004 to 3.4 percent by the final quarter of the year. Much of the increase, though, was concentrated in the energy-related components. The CPI excluding the volatile food and energy categories (which is often referred to as the "core rate" of inflation) rose much more modestly during the year—from 1.3 percent to only 2.2 percent. The rapid growth in energy-related prices was largely absorbed by businesses and not "passed along" to customers in the form of higher prices. The lack of more widespread price increases was a welcome development. Higher inflation would have quickly translated into higher short- and long-term interest rates, which would have had damaging effects on housing and other sectors of the economy.
Although high energy prices and the lack of strong job growth remain a concern to consumers, most recent indicators suggest that the economy is entering 2005 with significant momentum. For example:
Because of data limitations, gross domestic product data are not reported on a current quarterly basis at the state level. (Currently, such estimates are available on an annual basis only through 2003.) Given the lack of current state-level output data, economists focus on the information that is available for jobs and personal income. In the current environment, however, the slightly weaker job growth in California is providing an incomplete picture of California's economic performance compared to the rest of the nation.
This is because while job growth is lagging slightly behind other states, a variety of other reports suggest that sales and output growth is probably exceeding the nation (see Figure 4). Specifically:
|
Figure 4 California’s Economic Picture |
|
|
|
ü Sales, output, and profits are strong, as evidenced by: |
|
· Strong real estate construction. |
|
· Booming exports. |
|
· Strong company reports of sales and profits. |
|
· Healthy gains in business-related tax receipts. |
|
ü Job growth lagging, due to: |
|
· Intense focus on cost cutting and efficiencies, particularly in high-tech. |
|
· Declining government employment. |
One key to the divergent trends between jobs and other growth indicators is that the competitive pressures discussed earlier are extremely intense in California's high-tech industries. These trends are particularly evident in Silicon Valley, which continues to experience mergers, acquisitions, restructurings, and job cuts, even as sales and profits of its major companies rebound.
A basic question related to California's economic picture is: Exactly how strong is employment growth? As shown in Figure 5, two surveys of employment are providing decidedly different pictures of employment strength in this state. Specifically:
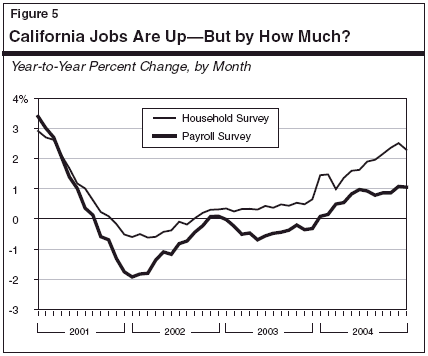
While there is often some discrepancy between the two series, the current difference is much larger than normal. It may reflect the growth in use of independent contractors (which are picked up in the household survey but not in the payroll survey), and rapid job growth in newly created small businesses (which are often missed in initial payroll surveys and only appear after annual benchmark revisions). While the payroll series with its larger sample size is normally a better indicator of employment trends, the household series is presently more consistent with other measures of growth evident in California at this time.
Even the modest gain in the payroll series during 2004, however, is an improvement from the prior two years, when this series was showing job losses. The overall growth in payroll employment reflects a 4.8 percent year-over-year gain in construction, a 3.1 percent increase in businesses and professional services, and more modest increases in most other private sector categories. Government employment fell 0.7 percent, reflecting tight budgets at the state and local government levels.
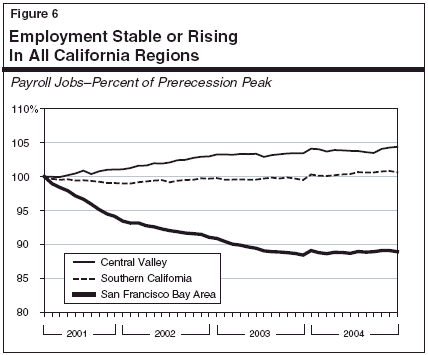
California's job downturn during 2001 through mid-2003 was concentrated in the Bay Area. As shown in Figure 6, that region lost nearly 12 percent of its job base between 2001 and mid-2003, reflecting major declines in the high-tech industry. In contrast, job losses in Southern California were mild and the Central Valley continued to grow during the period. As Figure 6 indicates, the overall improvement in California's job picture is largely the result of (1) continued steady, albeit slow, growth in Southern California and the Central Valley and (2) the stabilization in the Bay Area's job market.
The budget's economic forecast, which was prepared in early December, assumes that economic growth will ease some from the 2004 pace, but that growth will continue at a moderate pace in both 2005 and 2006. It assumes that jobs and personal income will accelerate as a result of a stepped-up pace of business hiring.
As shown in Figure 7, the budget forecasts that real GDP growth will slow from 4.4 percent in 2004 to 3.3 percent in 2005, and further to 3 percent in 2006. The administration assumes that both consumer spending and business investment will ease from the 2004 pace, as rising interest rates diminish home mortgage refinancing and the fiscal stimulus from the previous federal tax cuts fades. Finally, the forecast assumes that inflation will retreat from 2004 levels, as the result of less upward pressure from oil prices.
|
Figure 7 Summary of the Budget's Economic Outlook |
||||
|
|
||||
|
|
|
|
Forecast |
|
|
|
2003 |
2004 |
2005 |
2006 |
|
U.S. Forecast |
|
|
|
|
|
Percent change in: |
|
|
|
|
|
Real gross domestic product |
3.0% |
4.4% |
3.3% |
3.0% |
|
Personal income |
3.2 |
5.2 |
4.9 |
5.4 |
|
Wage and salary employment |
-0.3 |
1.0 |
1.7 |
1.2 |
|
Consumer Price Index |
2.3 |
2.6 |
2.3 |
2.0 |
|
Unemployment rate (%) |
6.0 |
5.5 |
5.3 |
5.5 |
|
Housing starts (000) |
1,850 |
1,940 |
1,830 |
1,690 |
|
California Forecast |
|
|
|
|
|
Percent change in: |
|
|
|
|
|
Personal income |
3.1% |
5.6% |
5.8% |
6.0% |
|
Employment: |
|
|
|
|
|
Payroll survey |
-0.4 |
1.0 |
1.8 |
1.8 |
|
Household survey |
0.4 |
1.8 |
1.8 |
1.6 |
|
Taxable sales |
4.3 |
5.7 |
5.7 |
5.6 |
|
Consumer Price Index |
2.3 |
2.7 |
2.9 |
2.5 |
|
Unemployment rate |
6.7 |
6.2 |
6.2 |
6.3 |
|
New housing permits |
197 |
210 |
199 |
195 |
The administration's forecast also assumes that California's economy will expand at a moderate pace in both 2005 and 2006. It assumes that businesses will step up the pace of hiring, which will result in an acceleration in wages and jobs. It specifically projects that the state's personal income growth will accelerate from 5.6 percent in 2004 to 5.8 percent in 2005 and 6 percent in 2006, and that job growth (as measured by the payroll survey) will accelerate from 1 percent in 2004 to 1.8 percent in both of the subsequent two years.
Our economic outlook has changed only modestly since our November 2004 fiscal forecast. We continue to believe that economic output will slow some in 2005 from last year, but that the national and state economies will continue to expand at a moderate pace.
As shown in Figure 8, we project that real GDP growth will shift down from 4.4 percent in 2004 to 3.6 percent in 2005 and 3.3 percent in 2006. This reflects a slightly slower pace in consumer spending and business investment, partly offset by improvement in the foreign trade deficit. Specifically:
|
Figure 8 Summary of the LAO's Economic Outlook |
||||
|
|
||||
|
|
|
Forecast |
||
|
|
2004 |
2005 |
2006 |
2007 |
|
U.S. Forecast |
|
|
|
|
|
Percent change in: |
|
|
|
|
|
Real gross domestic product |
4.4% |
3.6% |
3.3% |
3.3% |
|
Personal income |
5.4 |
5.2 |
5.7 |
5.6 |
|
Wage and salary employment |
1.0 |
1.8 |
1.5 |
1.1 |
|
Consumer Price Index |
2.7 |
2.1 |
1.6 |
1.8 |
|
Unemployment rate (%) |
5.5 |
5.3 |
5.3 |
5.3 |
|
Housing starts (000) |
1,933 |
1,815 |
1,702 |
1,669 |
|
California Forecast |
|
|
|
|
|
Percent change in: |
|
|
|
|
|
Personal income |
5.6% |
5.5% |
5.7% |
6.0% |
|
Employment: |
|
|
|
|
|
Payroll survey |
0.8 |
1.5 |
1.5 |
1.6 |
|
Household survey |
1.8 |
2.0 |
1.7 |
1.5 |
|
Taxable sales |
6.4 |
5.7 |
5.4 |
6.0 |
|
Consumer Price Index |
3.0 |
2.8 |
1.9 |
2.1 |
|
Unemployment rate |
6.1 |
5.4 |
4.9 |
4.8 |
|
New housing permits |
209 |
204 |
184 |
192 |
In other developments, inflation is forecast to ease some in 2005 and 2006, reflecting more stable prices for energy products, and modest increases in other categories. Solid (although slower) productivity growth and continued intense competition are also expected to restrain price increases in the forecast period. In this environment, we expect continued slow but steady increases in interest rates.
Oil Prices. After jumping from $35 per barrel at the beginning of 2004 to $55 per barrel in late October, oil prices fell back to below $45 in late 2004, before partly rebounding to near $50 as of late January. The price will continue to fluctuate in the months ahead, as updated reports of inventories, production, and demand are issued. However, we forecast the overall trend will be downward, with prices averaging around $40 per barrel by the end of 2005. Factors suggesting somewhat lower prices include (1) slowing worldwide economic growth, especially among major oil importers such as China and (2) increases in drilling and oil production. We would note, however, that the oil market remains quite vulnerable to supply disruptions and other factors.
Federal Policies. Federal policies had a stimulative impact on the economy in 2002 through 2004, as tax reductions were spent by consumers and increased federal defense purchases boosted growth in the aerospace sector. However, federal policies will become much less stimulative in 2005 and beyond, as the effects of tax cuts fade and financing of the deficit adds upward pressure on interest rates. Given that there is still plenty of liquidity in worldwide credit markets, we expect the upward pressure on interest rates to be modest in the near term. Although social security reforms that are being discussed could have significant effects on the economy, the timing and nature of these effects could vary widely, depending on policies that are eventually adopted.
We believe that overall sales and output growth of California firms will continue at a solid but moderating pace over the next two years, reflecting slowdowns in consumer and business spending. We expect that, while business earnings growth will ease, an accelerated pace of hiring will result in a modest increase in employment growth during the year. As shown in Figure 8:
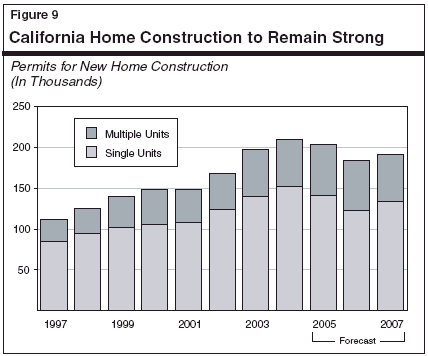
Outlook for Individual Geographic Regions and Industries. We expect that employment growth will encompass all major economic regions in 2005 and 2006. In terms of industry sectors, we also expect growth to be broad-based, encompassing services, trade, finance, manufacturing, and construction. The one industry sector that will continue to lag is the combined state and local government sector, which will continue to be affected by difficult budget circumstances facing governments in California.
Gasoline Prices. We forecast that, while seasonal factors will likely push gasoline prices upward from their present levels in 2005, they will remain slightly below the peaks reached last summer. This forecast assumes that that (1) crude oil prices will remain below last year's levels and (2) serious shortages in California refinery capacity will not develop—whether from unexpectedly strong demand or refinery problems. These assumptions are obviously subject to major risks, and while the economy was resilient to energy price increases last year, substantially higher gasoline prices could have a more significant negative effect in 2005 and 2006.
Figure 10 compares our forecasts for the nation and California to our November 2004 forecasts, as well as to a variety of other economic projections made in recent months by other forecasters. These include the projections made by the University of California, Los Angeles (UCLA) Business Forecast Project in December 2004, the consensus forecast published in the Blue Chip Economic Indicators (January 2005), the consensus outlook forecast in the Western Blue Chip Economic Forecasters (February 2005), and the 2005-06 Governor's Budget forecast.
|
Figure 10 Comparisons of Recent Economic Forecastsa |
|||
|
(Percent Changes) |
|||
|
|
Forecast |
||
|
|
2004 |
2005 |
2006 |
|
United States Real GDP: |
|
|
|
|
LAO November |
4.3% |
3.4% |
3.5% |
|
UCLA December |
4.4 |
3.0 |
2.6 |
|
DOF January |
4.4 |
3.3 |
3.0 |
|
Blue Chip "Consensus"b January |
4.4 |
3.6 |
3.4 |
|
LAO February |
4.4 |
3.6 |
3.3 |
|
California Payroll Jobs: |
|
|
|
|
LAO November |
0.9% |
1.4% |
1.5% |
|
UCLA December |
0.8 |
1.6 |
1.7 |
|
DOF January |
1.0 |
1.8 |
1.8 |
|
Blue Chip Consensusc February |
0.9 |
1.7 |
1.5 |
|
LAO February |
0.8 |
1.5 |
1.5 |
|
California Personal Income: |
|
|
|
|
LAO November |
5.9% |
5.5% |
5.8% |
|
UCLA December |
5.6 |
5.2 |
5.0 |
|
DOF January |
5.6 |
5.8 |
6.0 |
|
Blue Chip Consensus c February |
5.3 |
5.5 |
5.3 |
|
LAO February |
5.6 |
5.5 |
5.7 |
|
California Taxable Sales: |
|
|
|
|
LAO November |
6.5% |
5.6% |
5.6% |
|
UCLA December |
6.0 |
4.8 |
5.1 |
|
DOF January |
5.7 |
5.7 |
5.6 |
|
Blue Chip Consensus c February |
5.2 |
5.3 |
5.0 |
|
LAO February |
6.4 |
5.7 |
5.4 |
|
a Acronyms used apply to Legislative Analyst's Office (LAO); University of California, Los Angeles (UCLA); and Department of Finance (DOF). |
|||
|
b Average forecast of about 50 national firms surveyed in January by Blue Chip Economic Indicators. |
|||
|
c Average forecast of organizations surveyed in February by Western Blue Chip Economic Forecast. |
|||
Overall, there is not a great deal of variation among recent forecasts, with most outlooks calling for continued moderate economic growth. The figure shows that our updated forecast for the nation is similar to the consensus of forecasters polled in January by Blue Chip Economic Indicators. However, it is slightly higher than either the UCLA or administration's January projections. With respect to California, our forecast for personal income growth is modestly higher than the UCLA December projection, but slightly lower than the budget forecast.
The economic outlook is subject to numerous risks from both abroad and at home. One of the main near-term risks relates to further price increases for oil and other raw materials. In 2004, the economy was hit with sharply rising costs for these commodities. These increases did not, however, translate into a more generalized rise in inflation, as businesses were able to absorb the costs through offsetting efficiencies.
Our forecast assumes that the economy will not be beset by a second round of sharp price increases that would push prices for oil and raw materials to well above last year's levels. If such a shock were to occur—either from faster-than-expected growth in worldwide demand or from supply disruptions—it would be increasingly difficult for U.S. businesses to hold the line on their product prices. The result would be more inflation, higher interest rates, and weaker growth, particularly in the interest-sensitive sectors of the economy. The impacts could be particularly significant in California, where many individuals have financed recent expensive home acquisitions with large variable-rate mortgages. For these households, a rise in market interest rates would translate into substantial increases in monthly mortgage payments, leaving less funds for other purchases.
California's demographic trends both directly and indirectly affect the state's economy, revenue collections, and expenditure levels. For example, they influence the size of the labor force, the demand for homes and automobiles, the volume of taxable sales, and the amount of income taxes paid. Similarly, the population and its age distribution affect school enrollments and public programs in many other areas, such as health care and social services. Consequently, the state's demographic outlook is a key element both in estimating economic performance and in assessing and projecting the state's budgetary situation.
Figure 11 summarizes our updated state demographic forecast. We project that California's total population will rise from an estimated 37.1 million in 2005 to 37.7 million in 2006, and 38.3 million in 2007. These population projections use as their starting point published 2000 Census data for California, and have not been adjusted to correct for issues related to potential undercounting (for a detailed discussion of the issue of undercount in the Census, see page 32 of The 2003-04 Budget: Perspectives and Issues).
|
Figure 11 Summary of the LAO’s California Demographic Forecast |
|||
|
(Population in Thousands) |
|||
|
|
2005 |
2006 |
2007 |
|
Total population (July 1 basis) |
37,172 |
37,747 |
38,320 |
|
Changes in population: |
|
|
|
|
Natural change (births minus deaths) |
314 |
316 |
318 |
|
Net in-migration (in-flows minus out-flows) |
266 |
259 |
255 |
|
Total changes |
581 |
575 |
573 |
|
Percent changes |
1.6% |
1.6% |
1.5% |
Slight Slowing Projected. The state's population is projected to grow at an average rate of about 1.6 percent annually over the next three years. This is down slightly from the 1.7 percent average for the 2002 through 2004 period. Birth rates are forecast to stabilize at historically low levels, and net in-migration is projected to continue its modest downward trend.
In numeric terms, the number of new Californians being added each year—about 576,000 people—is well above the size of such cities as Long Beach, Fresno, and Sacramento, and very similar to such states as Wyoming.
California's population growth can be broken down into two major components—natural increase (the excess of births over deaths) and net in-migration (persons moving into California from other states and countries, minus people leaving the state for other destinations). The population growth associated with natural increase accounts for just over one-half of California's projected annual growth over the forecast period and is assumed to be fairly stable. Net in-migration accounts for the other roughly one-half of the growth over the period, but varies with California's economic cycle.
Natural Increase. We project that the natural-increase component will contribute an average of 316,000 new Californians annually over the forecast period. This reflects stable birth rates, but growth in the female population of child-bearing age groups.
Net In-Migration. The population growth associated with net in-migration is projected to continue its downward trend. This component dropped from 388,000 in 2001 to 284,000 in 2004, due to declines in net in-migration from both other states and other countries. The drop was partly related to California's economic downturn in the early part of this decade. We expect a modest partial rebound in domestic migration during 2006 and 2007, as the state's economy strengthens.
The implications of demographic trends for the budget depend not only on the total number of Californians, but also on their characteristics. California is well known for having one of the world's most dynamic and diverse populations, including an increasingly rich ethnic mix and a large number of in-migrants. The state's age and ethnic mix is shown in Figure 12.
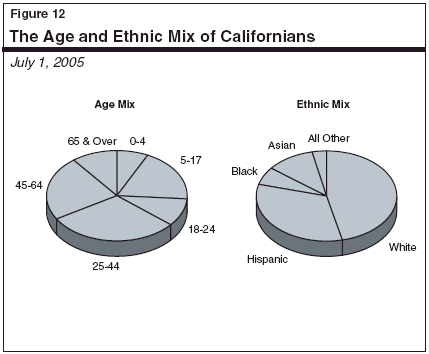
The age-related characteristics of California's population growth are especially important from a budgetary perspective, given their implications for such program areas as education, health care, and social services. Figure 13 shows our forecasts for both the percentage and numeric changes in different population groups. The 45-to-64 age group (baby boomers) continues to be the fastest growing segment of the population. About 919,000 new people are expected to move into this age category over the next three years, as the tail end of the baby-boom generation moves into its mid-40s.
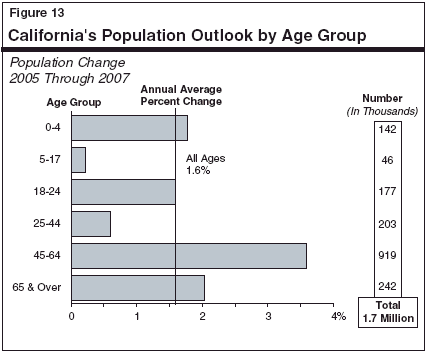
California's continued strong population growth—including its age, ethnic, and migratory characteristics—can be expected to have many implications for the state's economy and public services in 2005-06 and beyond. For example, strong growth of the 45-to-64 age group generally benefits tax revenues since this is the age category that normally earns the highest wages and salaries. Alternatively, the below-average growth in the 5-to-17 age groups imply slower growth in K-12 school enrollments. More general examples of demographic influences include the following: