Analysis of the 2005-06 Budget BillLegislative Analyst's Office
|
The budget proposes to provide a $2.5 billion (6 percent) increase in K-12 Proposition 98 funding from the 2004-05 level. Most of the new funding is used to fully fund attendance growth, and provide a cost-of-living adjustment (COLA) plus an additional $329 million to restore part of a prior-year COLA. Adjusting for deferrals funding, schools would receive $7,377 per pupil, or 5.2 percent, more than revised per pupil expenditures in the current year. The Governor proposes not to fund a $1.1 billion increase in funding in the current year that would be needed to meet the targeted funding level in the bill suspending Proposition 98 for 2004-05. The two-year savings from this proposal is $2.3 billion. The Governor proposes to transfer from the state to school districts and community colleges a $469 million State Teachers' Retirement System cost obligation (the K-12 share is $433 million).
Figure 1 displays all significant sources for K-12 education for the budget year and two previous years. As the figure shows, Proposition 98 funding constitutes over 70 percent of overall K-12 funding. Proposition 98 funding for K-12 increases $2.5 billion (6 percent) from the 2004-05 level. However, other funding for K-12 falls by a combined $723 million (see Figure 1).
|
K-12 Education Budget Summary |
|||||
|
(Dollars in Millions) |
|||||
|
|
Actual |
Revised |
Proposed |
Change From 2004‑05 |
|
|
Amount |
Percent |
||||
|
K-12 Proposition 98 |
|
|
|
|
|
|
State General Fund |
$28,154 |
$30,992 |
$33,117 |
$2,125 |
6.9% |
|
Local property tax revenue |
13,656 |
11,192 |
11,593 |
401 |
3.6 |
|
Subtotals, Proposition 98 |
($41,810) |
($42,183) |
($44,710) |
($2,527) |
(6.0%) |
|
Other Funds |
|
|
|
|
|
|
General Fund |
|
|
|
|
|
|
Teacher retirement |
$469 |
$1,050 |
$502 |
-$549 |
-$52.3% |
|
Bond payments |
890 |
1,674 |
1,825 |
151 |
9.0 |
|
Other programs |
254 |
720 |
441 |
-280 |
-38.8 |
|
State lottery funds |
873 |
810 |
810 |
� |
� |
|
Other state programs |
112 |
110 |
105 |
-5 |
-4.5 |
|
Federal funds |
7,154 |
7,584 |
7,533 |
-51 |
-0.7 |
|
Other local funds |
5,195 |
5,206 |
5,217 |
10 |
0.2 |
|
Subtotals, other funds |
($14,948) |
($17,155) |
($16,433) |
(-$723) |
(-4.2%) |
|
Totals |
$56,758 |
$59,339 |
$61,143 |
$1,804 |
3.0% |
|
K-12 Proposition 98 |
|
|
|
|
|
|
Average daily attendance (ADA) |
5,958,356 |
6,015,984 |
6,063,491 |
47,507 |
0.8% |
|
Budgeted amount per ADA |
$7,017 |
$7,012 |
$7,374 |
$362 |
5.2 |
|
Totals may not add due to rounding. |
|||||
Local Government Deals Require Higher General Fund Support for Proposition 98. The $2.5 billion increase in K-12 Proposition 98 funding is supported mainly by the General Fund ($2.1 billion). Since 2003-04 the K-12 share of Proposition 98 supported by the General Fund has increased from 67 percent in 2003-04 to 74 percent in the proposed budget. The main cause of the increased General Fund share of Proposition 98 is transfers of local property tax revenues from schools to local government to meet the requirements of the vehicle license fee (VLF) "swap" and the "triple flip" payment mechanism for the deficit reduction bond passed by the voters in March 2004. The Department of Finance (DOF) forecasted that underlying local property tax revenues would grow by 9 percent, which would have provided almost $1.1 billion in year-to-year growth. However, technical adjustments to the VLF swap and triple flip amounts require an additional $675 million to be transferred from schools to local government. Thus, the growth in local property tax revenues in 2005-06 is only $401 million (3.6 percent).
Proposed Reductions in Non-Proposition 98 Spending. The budget proposes to decrease non-Proposition 98 funding for K-12 by a net of $723 million in 2005-06. The key changes include:
The Governor's budget provides an additional $362 per pupil, a 5.2 percent increase from the current year. Figure 2 shows per pupil spending in actual dollars over the last decade. The figure shows two distinct trends�a fast growth period in the late 1990s, and a slow growth period between 2000-01 and 2004-05. Spending per pupil increased in each year of this period. However, these spending levels do not take into account the effects of inflation.
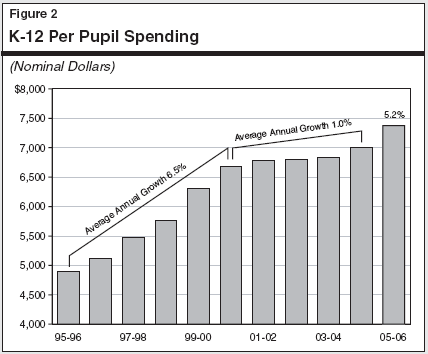
Figure 3 adjusts per pupil spending for inflation. K-12 spending since 2000-01 has not kept pace with rising costs, declining 1.3 percent per year, on average, between 2000-01 and 2004-05. Looking at changes over the last decade, spending (in inflation-adjusted terms) has increased by approximately $930 per pupil (14 percent). The Governor's proposal would end the recent trend of reduction, growing per pupil spending 2.3 percent after adjusting for the effect of inflation.
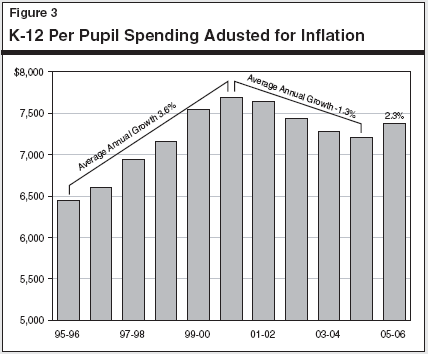
Figure 4 displays the major K-12 funding changes from the 2004-05 Budget Act. In the current year, the Governor's budget reflects a net $89 million increase resulting mainly from higher-than-expected attendance. In 2005-06, the Governor's budget proposes about $2.5 billion in new K-12 expenditures for the following purposes.
|
Major K-12 Proposition 98 Changes |
|
|
(In Millions) |
|
|
2004‑05 Budget Act |
$42,087.3 |
|
Additional K-12 revenue limit |
$93.2 |
|
Other |
-4.7 |
|
2004‑05 Revised K-12 Spending Level |
$42,183.3 |
|
Revenue Limit |
|
|
Cost-of-living adjustments (COLAs) |
$1,222.1 |
|
Growth |
234.7 |
|
Deficit factor reduction |
329.3 |
|
Subtotal |
($1,786.1) |
|
Categorical Programs |
|
|
COLAs |
$427.6 |
|
Growth |
160.0 |
|
Restore categoricals funded with one-time funds |
146.5 |
|
Other |
6.5 |
|
Subtotal |
($740.6) |
|
Total Changes |
$2,526.7 |
|
2005‑06 Proposed |
$44,710.0 |
|
Change From Revised 2004‑05 |
|
|
Amount |
$2,526.7 |
|
Percent |
6% |
Figure 5 shows Proposition 98 spending for major K-12 programs adjusted for funding deferrals. The budget provides almost $33 billion for revenue limits, $3.2 billion for special education, and almost $1.7 billion for K-3 class size reduction (CSR).
|
Major K-12 Education Programs |
||||
|
(Dollars in Millions) |
||||
|
|
Revised |
Proposed |
Change |
|
|
Amount |
Percent |
|||
|
Revenue Limits |
|
|
|
|
|
General Fund |
$19,513.2 |
$20,912.8 |
$1,399.7 |
7.2% |
|
Local property tax |
10,859.1 |
11,245.3 |
386.2 |
3.6 |
|
Subtotals |
($30,372.3) |
($32,158.2) |
($1,785.8) |
(5.9%) |
|
Categorical Programs |
|
|
|
|
|
Special education b |
$3,051.2 |
$3,239.2 |
$188.0 |
6.2% |
|
K-3 class size reduction |
1,651.8 |
1,671.6 |
19.8 |
1.2 |
|
Child development and care |
1,097.4 |
1,177.9 |
80.5 |
7.3 |
|
Targeted Instructional Improvement Block Grant c |
930.2 |
974.4 |
44.2 |
4.8 |
|
Adult education |
606.5 |
646.1 |
39.6 |
6.5 |
|
Economic Impact Aid |
536.2 |
585.2 |
48.9 |
9.1 |
|
Regional Occupation Centers and Programs |
393.3 |
419.5 |
26.2 |
6.7 |
|
Instructional Materials Block Grant |
363.0 |
380.2 |
17.2 |
4.8 |
|
Public School Accountability Act |
249.2 |
249.2 |
� |
� |
|
Deferred maintenance |
250.4 |
267.4 |
17.0 |
6.8 |
|
Home-to-school transportation |
541.9 |
567.7 |
25.8 |
4.8 |
|
School and Library Improvement Block Grant c |
402.5 |
421.6 |
19.1 |
4.8 |
|
Professional Development Block Grant c |
239.1 |
248.6 |
9.5 |
4.0 |
|
Pupil Retention Block Grant c |
164.3 |
174.1 |
9.8 |
6.0 |
|
Mandated supplemental instruction (summer school) |
281.3 |
293.5 |
12.2 |
4.3 |
|
Other |
1,161.7 |
1,255.0 |
93.3 |
7.9 |
|
Deferrals and other adjustments |
-111.2 |
-19.3 |
91.9 |
-82.6 |
|
Subtotals |
($11,810.7) |
($12,551.9) |
($741.2) |
(6.3%) |
|
Totals |
$42,183.0 |
$44,710.1 |
$2,527.0 |
6.0% |
|
a
Amounts adjusted for deferrals. We count funds toward the fiscal year in
which school districts programmatically commit |
||||
|
b Special education includes both General Fund and local property tax revenues. |
||||
|
c
Chapter 871, Statutes of 2004 (AB 825, Firebaugh), created these
new categorical block grants. The 2004‑05 amounts |
||||
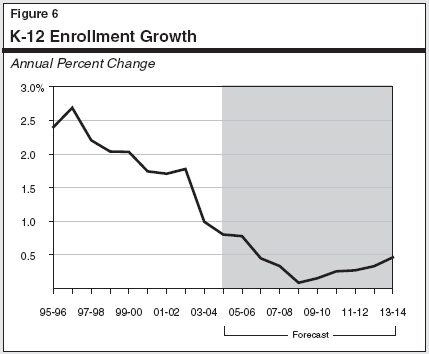
Enrollment growth significantly shapes the Legislature's annual K-12 budget and policy decisions. When enrollment grows slowly, for example, fewer resources are needed to meet statutory funding obligations for revenue limits and K-12 education categorical programs. This leaves more General Fund resources available for other budget priorities both within K-12 education and outside it. Conversely, when enrollment grows rapidly (as it did in the 1990s), the state must dedicate a larger share of the budget to education. In light of the important implications of enrollment growth, we describe below two major trends in the K-12 student population.
The enrollment numbers used in this section are from DOF's Demographic Research Unit and reflect aggregate, statewide enrollment. While the enrollment trends described here will likely differ from those in any given school district, they reflect the overall patterns the state is likely to see in the near future.
K-12 Enrollment Growth to Slow Significantly. K-12 enrollment is projected to increase by about 0.8 percent in 2005-06, bringing total enrollment to about 6.3 million students. Figure 6 shows how enrollment growth has steadily slowed since the mid-1990s. The figure also indicates that K-12 enrollment growth will continue to slow until 2008-09, when it will turn upward.
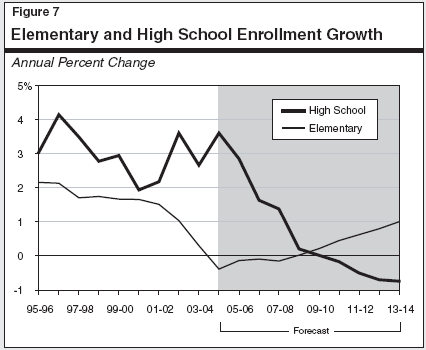
Divergent Trends in Elementary and High School Enrollment. Figure 7 shows that the steady decline in K-12 enrollment growth masks two distinct trends in elementary (grades K-8) and high school (grades 9 through 12) enrollment. Elementary school enrollment growth has gradually slowed since 1995-96. This enrollment is expected to decline annually between 2004-05 and 2008-09. In contrast, high school enrollment growth has been growing rapidly, with a 3.6 percent increase in 2004-05. Beginning in the budget year, growth is expected to slow sharply, becoming negative in 2010-11. Expected growth from the current year to 2007-08 is approximately 115,000 pupils (6 percent). Between 2007-08 and 2013-14, however, enrollment will fall by almost 40,000 students.
Budget and Policy Implications. These enrollment trends have significant budgetary and policy implications for issues such as CSR, teacher demand, and facilities investment. A few of the major implications include: