Analysis of the 2008-09 Budget Bill: Perspectives and Issues
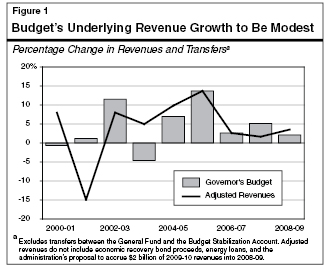
As discussed in “Part II” of this volume, significant economic slowing occurred in 2007 and very subdued economic performance is expected for the nation and state in 2008 and 2009. Given this, as shown in Figure 1 , very modest revenue growth occurred in 2006–07 and is forecast for the remainder of 2007–08 and 2008–09. As a result, the Governor’s budget forecasts that underlying revenues for these three years are down by a combined $9.3 billion from what was forecast in the 2007–08 Budget Act. To partially offset this weakness in state income, the administration has proposed $5.5 billion in additional revenues, largely from borrowing and accounting changes. This leaves the administration’s revenues down $3.8 billion from what was projected at the time the 2007–08 budget was enacted. Our own estimate of revenues is down another $1.5 billion from the budget forecast.
In this part, we provide background information relating to the revenue outlook, discuss recent revenue developments, summarize the budget’s revenue projections, and present our own revenue forecast.
The 2008–09 Governor’s Budget projects that California state government will receive $129.8 billion in revenues in 2008–09. These revenues are deposited into either the General Fund or a variety of special funds. Figure 2 shows that:
- General Fund Revenues. Nearly 80 percent of total state revenues are deposited into the General Fund. These revenues are then allocated through the annual budget process for such programs as education, health, social services, and criminal justice.
- Special Funds Revenues. The remaining roughly 20 percent of revenues are received by special funds and are primarily earmarked for specific purposes, such as transportation, local governments, and targeted health and social services programs.
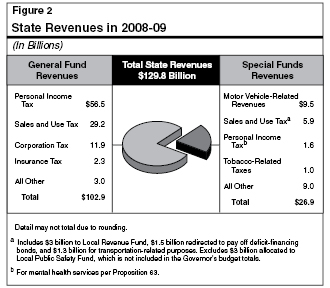
As the figure shows, some revenues—namely, personal income and sales tax receipts—support both the General Fund and special funds.
Sources of General Fund Revenues. Figure 2 also indicates that about 95 percent of total General Fund receipts in the budget year are attributable to the state’s “Big 3” taxes—the personal income tax (PIT), the sales and use tax (SUT), and the corporation tax (CT). The remainder is related to a variety of smaller taxes (including insurance, tobacco, and alcoholic beverage taxes), investment earnings, tribal gambling compacts, state lands’ royalties, fees, and various transfers from special funds.
Although the budget does not include any significant tax changes to help deal with the budget problem, it does contain several proposals that would have significant impacts on state General Fund revenues. As shown in Figure 3, these proposals would generate roughly $5.5 billion in 2007–08 and 2008–09, and include:
- $3.3 billion in proceeds from the sale of additional deficit–financing bonds, which are available in 2007–08.
- A one–time gain of $2 billion in 2008–09 from accruing a portion of the September 2009 PIT ($1.2 billion) and CT ($0.8 billion) estimated payments to June 2009. Under current accounting treatment, these revenues would be scored in 2009–10. Revenues in future years also would be accrued in this same manner.
- Increased revenues of about $150 million in 2008–09, and growing amounts thereafter, from augmenting Franchise Tax Board (FTB) and Board of Equalization (BOE) tax enforcement and compliance activities.
- Reinstatement of the 12–month rule for applying the use tax to out–of–state purchases of vessels, vehicles, and aircraft, to generate $5 million in 2007–08 and $21 million in 2008–09 and thereafter.
|
|
|
Figure 3
2008-09 General Fund Revenue Changes
Proposed in the Governor's Budget |
|
(In Millions) |
|
|
Fiscal Impact |
|
|
2007-08 |
2008-09 |
2009-10 |
|
Sale of Deficit-Financing Bonds |
$3,313 |
— |
— |
|
Accrual Change |
|
|
|
|
Personal Income Tax |
— |
$1,154 |
$58 |
|
Corporation Tax |
— |
847 |
42 |
|
Subtotals |
— |
($2,001) |
($100) |
|
Enforcement and Revenue-Enhancing Measures |
— |
$151 |
$252 |
|
Use Tax |
|
|
|
|
One-year test for Vessels, Vehicles, and
Aircraft |
$5 |
$21 |
$21 |
|
Totals |
$3,318 |
$2,173 |
$373 |
|
|
The updated budget forecast assumes that underlying General Fund revenue growth (that is, growth after adjusting for the proceeds of the deficit–bond sale and accrual change) will be modest in both 2007–08 and 2008–09, as it was in 2006–07. The budget’s General Fund revenue projections are summarized in Figure 4.
|
|
|
Figure 4
Summary of the Budget's
General Fund Revenue Forecast |
|
(Dollars in Millions) |
|
|
|
2007-08 |
|
2008-09 |
|
|
Actual 2006-07 |
Estimated Amount |
Percent Change |
|
Projected Amount |
Percent Change |
|
Taxes |
|
|
|
|
|
|
|
Personal income |
$51,943 |
$52,681 |
1.4% |
|
$56,458 |
7.2% |
|
Sales and use |
27,445 |
27,689 |
0.9 |
|
29,215 |
5.5 |
|
Corporation |
11,158 |
10,675 |
-4.3 |
|
11,937 |
11.8 |
|
Insurance |
2,178 |
2,075 |
-4.7 |
|
2,276 |
9.7 |
|
Other |
485 |
481 |
-0.9 |
|
491 |
2.3 |
|
Other Revenues, Transfers, and Loans |
|
|
|
|
Deficit-financing bond
proceeds |
— |
$3,313 |
— |
|
— |
— |
|
Other revenues |
$2,225 |
3,096 |
39.2% |
|
$2,470 |
-20.2% |
|
Transfers |
453 |
749 |
— |
|
57 |
— |
|
Totals |
$95,887 |
$100,759 |
5.1% |
|
$102,904 |
2.1% |
|
|
|
Detail may not add due to rounding. |
|
|
2006–07 Actual. The budget shows that 2006–07 General Fund revenues and transfers totaled $95.9 billion, a 2.6 percent increase from 2005–06. This revised estimate is down $125 million from the level assumed in the 2007–08 Budget Act. This decline relative to the budget act is the net result of a variety of factors, including accrual adjustments by the State Controller and “settle–up” transfers from the General Fund to the Mental Health Fund relating to Proposition 63 (November 2004).
2007–08 Estimate. The administration’s forecast assumes that current–year General Fund revenues and transfers will be $100.8 billion, a 5.1 percent increase from the prior year. Although this growth rate reflects the revenue–reducing effects of such economic factors as a slowdown in profits, taxable spending, and capital gains, it also is buoyed by the $3.3 billion in proceeds from the sale of additional deficit–financing bonds. Absent this one–time factor, the underlying growth rate is a very modest 1.6 percent. The revised current–year revenue figure is down $1.5 billion from the 2007–08 Budget Act.
2008–09 Forecast. The budget forecasts that budget–year General Fund revenues and transfers will be $102.9 billion, a 2.1 percent increase from 2007–08. After adjusting for one–time factors in both the current and budget years (the deficit–financing bonds and revenue accrual change), the underlying growth rate is about 3.5 percent. The revised budget–year revenue figure is down $2.2 billion from that assumed in the 2007–08 Budget Act.
Figure 5 shows our projections of General Fund revenues for 2007–08 through 2009–10. These projections are based on our economic and demographic forecasts presented in “Part II” of this volume and incorporate the impacts of the Governor’s revenue–related policy proposals. For the current and budget years combined, we are estimating that General Fund revenues will fall below the budget forecast by $1.5 billion. We specifically forecast that:
|
|
|
Figure 5
Summary of the LAO's General Fund Revenue
Forecast |
|
(Dollars in Millions) |
|
|
|
Estimated
2007‑08 |
|
Projected
2008‑09 |
|
Projected
2009‑10 |
|
|
Actual 2006‑07 |
Amount |
Percent Change |
|
Amount |
Percent Change |
|
Amount |
Percent Change |
|
Taxes |
|
|
|
|
|
|
|
|
|
|
Personal income |
$51,943 |
$52,965 |
2.0% |
|
$55,967 |
5.7% |
|
$58,875 |
5.2% |
|
Sales and use |
27,445 |
27,529 |
0.3 |
|
29,013 |
5.4 |
|
30,387 |
4.7 |
|
Corporation |
11,158 |
10,253 |
-8.1 |
|
11,534 |
12.5 |
|
11,483 |
-0.4 |
|
Insurance |
2,178 |
2,085 |
-4.3 |
|
2,251 |
8.0 |
|
2,386 |
6.0 |
|
Other |
485 |
478 |
-1.3 |
|
487 |
1.7 |
|
495 |
1.7 |
|
Other Revenues, Transfers, and Loans |
|
|
|
|
|
|
|
Deficit-financing
bond proceeds |
— |
$3,313 |
— |
|
— |
— |
|
— |
— |
|
Other revenues |
$2,225 |
2,452 |
10.2% |
|
$3,053 |
24.5% |
|
$2,445 |
-19.9% |
|
Transfers |
453 |
749 |
— |
|
57 |
— |
|
60 |
— |
|
Totals |
$95,887 |
$99,823 |
4.1% |
|
$102,361 |
2.5% |
|
$106,131 |
3.7% |
|
|
|
Detail may
not total due to rounding. |
|
|
- In 2007–08, General Fund revenues and transfers will total $99.8 billion, a 4.1 percent increase from 2006–07. Absent the deficit–financing bond proceeds, however, our revenue growth is very weak—only 0.6 percent. Our estimate is down $935 million from the administration’s. The biggest piece of this involves a timing difference regarding when the assumed $500 million from the sale of EdFund will be received. Most of the remainder reflects the net effects of a variety of differences involving the Big 3 taxes—each of a few hundred million dollars in magnitude. Compared to the administration, we are down for the SUT and CT and higher for the PIT.
- In 2008–09, General Fund revenues and transfers will total $102.4 billion, a 2.5 percent increase from the current year. After adjusting for special factors, our growth is around 4 percent. Our forecast is down by $543 million from the budget projection, but over $1 billion when the EdFund timing difference is removed. We are lower by hundreds of millions of dollars for each of the Big 3 taxes, as well as being down for tribal gambling revenues and interest income.
- In 2009–10, revenues and transfers will total $106.1 billion, an increase of 3.7 percent. Excluding various one–time factors, the underlying growth rate is roughly 5.8 percent.
Consistent with the soft growth we are projecting for such key revenue–determining variables as taxable sales, corporate profits, and capital gains, our underlying revenue growth rates for each of the years are below our estimate of the change in statewide personal income.
Deterioration in the Economy. The single most important factor explaining our lower revenue estimates is that economic conditions at both the national and state levels have deteriorated since the budget’s estimates were put together. As discussed in the following pages, this has reduced our projections for all key revenue–determining economic variables.
Mixed, Though on Balance Negative, Recent Revenue Receipts. The budget forecast is largely completed by the administration in early December, prior to when key information about year–end economic and revenue activity becomes available. Especially important is the strength of the PIT and CT estimated and miscellaneous tax payments that come in just before the end and right after the start of the calendar year. The performance of these payments has often been an early indicator of the strength of final PIT and CT payments remitted in the upcoming spring. The year–end December receipts include estimated and other payments made before 2007 ends in order to qualify for being deducted on 2007 federal PIT and CT tax returns. January revenues include the remainder of estimated payments on 2007 PIT liabilities, due on the 15th of that month. For 2007–08, the budget’s projected revenue collections for these two months was very substantial—over $20 billion. The available information, as of this writing, indicates that the performance of these recent revenue receipts and the SUT, while mixed, was on balance negative:
- On the positive side, cumulative receipts through January for the PIT and CT combined were up slightly from the January budget estimate—by $29 million. On the negative side, however, cumulative SUT revenues were down $166 million and PIT withholding came up short in January.
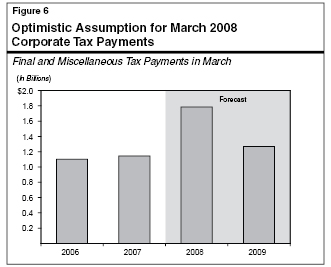
- The most striking recent revenue development, however, involved December corporate tax receipts. They fell short of the 2007–08 Budget Act estimate by about $600 million. This weakness does not show up in the administration’s scoring of December cash because it took this shortfall into account when it prepared its revised monthly cash projections once its revised full–year revenue estimates had been finalized. However, when doing this, it also assumed that most of the shortfall was a cash–flow anomaly and would be recouped as final corporate tax payments in March 2008 when final returns are due. Its rationale is that because corporate profits have been soft, many taxpayers may have already met most of their 2007 prepayment obligations before December, thus explaining that month’s weakness.
Although only time will tell if the department is correct, Figure 6 shows that the size of the administration’s CT receipts expected in March is very large compared to recent years, and thus an optimistic assumption.
Lower Estimate for Tribal Gambling Revenues. The administration is assuming $584 million in revenues from tribal gambling compacts in the current and budget years combined, primarily from the amended compacts approved by the voters earlier this month. We believe this amount is optimistic, by $173 million. This results from using more realistic assumptions than the administration about both the speed with which new slot machines would be put in place and the amount of revenues generated per machine.
Interest Income and Oil–Related Differences. As discussed later, we also are lower than the administration for interest income on invested General Fund balances, but higher on state lands’ royalties. When these partially offsetting factors are combined with the tribal gambling difference above, we are down on these three items from the administration for the current and budget year combined by $61 million.
As indicated above, the great majority of General Fund revenues are attributable to the state’s three major taxes—the PIT, SUT, and CT. The performance of these taxes will have a dominating influence on the overall
revenue outlook. In the following sections, we discuss in more detail recent developments and the outlook for each of these key revenue sources.
The PIT is, by far, the state’s largest revenue source, accounting for 55 percent of total estimated General Fund revenues in 2008–09. In general, the PIT is patterned after federal law with respect to reportable types of income, deductions, exemptions, exclusions, and credits. Under the PIT, taxable income is subject to marginal rates ranging from 1 percent to 9.3 percent, with the top rate applying to taxable income in excess of $89,628 for joint returns in 2007 (or $44,814 for taxpayers filing single returns). An additional 1 percent rate is imposed on the portion of incomes in excess of $1 million (for a total marginal rate of 10.3 percent for affected taxpayers). The proceeds of this surcharge, which was implemented following approval of Proposition 63 in November 2004, are allocated to a special fund to support various mental health programs. California also imposes a PIT Alternative Minimum Tax (AMT) of 7 percent along the lines of the federal AMT.
We forecast that PIT receipts will total $53.0 billion in 2007–08, a 2 percent increase from the prior year. We also forecast that PIT receipts will increase by 5.7 percent, to $56.0 billion, in 2008–09 and by an additional 5.2 percent, to $58.9 billion, in 2009–10. Compared to the budget forecast, our current projection of PIT revenues is up by $284 million in the current year and down by $491 million in 2008–09, or below the administration by $208 million for the two years combined.
The main determinants of PIT collections in a given fiscal year are the annual tax liabilities for the two income years falling within the fiscal year, any special adjustments that have to be made to these liabilities, and the timing of the cash payments associated with them. The latter include withholding, quarterly estimated payments, final payments, and refunds.
As noted at the outset, our forecast is based on the Governor’s policies. Therefore, our revenue estimates assume the Governor’s proposal to accrue a portion of the revenues associated with the September 2009 PIT prepayment into 2008–09, and to continue this thereafter. This increases our 2008–09 revenues by somewhat over $1 billion. Without this accrual change, PIT revenue growth in 2008–09 would be much lower—less than 4 percent.
We also include in our projections the administration’s adjustments totaling $74 million for the various PIT revenue–generating tax enforcement and compliance activities by FTB that the Governor has proposed.
Lastly, our projections, like the administration’s, include transfers out of the General Fund of PIT revenues equal to a bit over $400 million in both 2007–08 and 2008–09, to settle–up the Proposition 63 amount due to the Mental Health Fund.
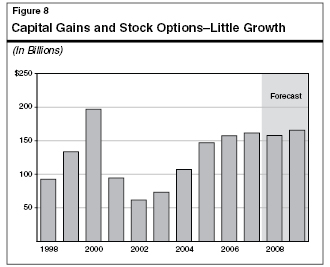
Liability Growth. Figure 7 shows that, after growing quite rapidly in both 2004 and 2005, PIT liability growth eased in both 2006 and 2007 to under 5 percent. These reduced growth rates are consistent with the slowing in California’s economy and the state’s housing market downturn. These developments have especially taken a toll on real estate–related profits and capital gains. For example, we estimate that, after booming by 60 percent in 2004 and over 45 percent in 2005, capital gains grew by only 4 percent in 2006 and were flat in 2007. This, in turn, has had a magnified negative effect on California’s PIT liabilities, since business–related profits and capital gains tend to accrue to high–income taxpayers, which are subject to California’s top income tax rates.
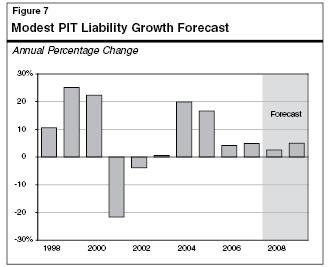
We project that PIT liability growth will drop to below 3 percent in 2008 when the economy will be at its weakest, before rising back to 5 percent in 2009. An important element in our forecast is our outlook for capital gains and stock options. Together, these items totaled close to $160 billion and accounted for more than $14 billion in PIT liabilities in 2006. Figure 8 shows that while we do not expect a major decline in their combined amount in the following three years, they will be fairly flat.
The SUT is the General Fund’s second largest revenue source, accounting for 28 percent of estimated total revenues in 2008–09. The main SUT component is the sales tax, which is imposed on retail sales of tangible goods sold in California. Some examples of sales tax transactions include spending on clothing, furniture, computers, electronics, appliances, automobiles, and motor vehicle fuel. Purchases of building materials that go into the construction of homes and buildings are also subject to the sales tax, as are purchases of computers and other equipment used by businesses. The largest exemption from SUT is for most food items consumed at home. The great majority of services are not directly subject to the sales tax in California.
The second component of the SUT—the use tax—is imposed on products bought from out–of–state firms by California residents and businesses for use in this state. With the exception of purchases of vessels, vehicles, and aircraft (which must be registered), out–of–state purchases are difficult to monitor, and the state is prohibited under current federal law from requiring most out–of–state sellers to collect the use tax for California. As a result, use tax receipts account for only a small portion of total SUT revenues.
The total SUT rate levied in California is a combination of several different individual rates imposed by the state and various local governments. These include:
- State Rate. The basic state SUT rate is currently 6.25 percent. The largest single component is the 5 percent state General Fund rate. Also included in the overall state rate are two half–cent rates whose proceeds are deposited into (1) the Local Revenue Fund, which supports health and social services program costs associated with the 1991 state–local realignment, and (2) the Local Public Safety Fund, which was approved by the voters in 1993 for the support of local criminal justice activities. The final component of the state’s SUT rate involves Proposition 57. Under that measure, which was approved by the voters in March 2004, 0.25 percent of the Bradley–Burns rate (discussed below) is diverted to a state special fund for purposes of repayment of the deficit–financing bonds. These bonds were issued in 2004 and more recently in 2008 to help deal with the state’s budget problem. (The diverted local sales taxes are being replaced by a shift of property taxes from schools, which are in turn reimbursed by Proposition 98 payments to schools by the state General Fund. As a result of these various steps, state government is ultimately responsible for the bonds’ repayment.) The diversion of sales tax revenues will remain in effect until the bonds are paid off, which the administration is projecting to do in 2012–13.
- Uniform Local Rate. This is a uniform local tax rate of 1 percent levied by all counties (the so–called Bradley–Burns rate). Of this total, 0.25 percent is deposited into county transportation funds, while the remaining 0.75 percent is allocated to city and county governments for their general purposes. This latter rate will return to 1 percent once the deficit–financing bonds are paid off.
- Optional Local Rates. The final overall SUT rate component involves optional local tax rates, which local governments are authorized to levy for any purpose. These taxes, which require local voter approval, are normally levied on a countywide basis—primarily for transportation–related purposes. They are generally levied in 0.25 percent or 0.5 percent increments and cannot exceed 1.5 percent in total (except in San Francisco and San Mateo Counties).
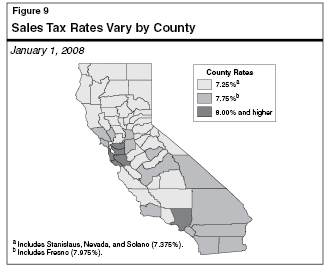
Combined SUT Rates Throughout California. The combined state and local SUT rate varies significantly across California due to differences in the local optional rates that are levied (see Figure 9). The combined SUT rate currently ranges from 7.25 percent (for those counties with no optional rates) up to 8.75 percent. On a weighted–average basis, calculated using the amount of taxable sales in different counties and their respective SUT rates, the statewide rate is currently 7.94 percent.
We forecast that SUT receipts will total $27.5 billion in 2007–08, a weak 0.3 percent increase from the prior year. Revenues from this source are projected to increase to $29.0 billion in 2008–09 (up 5.4 percent from the current year) and to $30.4 billion in 2009–10 (a 4.7 percent increase). Compared to the budget forecast, our SUT revenue estimate is down $160 million in 2007–08 and by $202 million in 2007–08, for a two–year shortfall of $362 million.
The key factors behind our forecasted General Fund SUT collections are (1) modest increases in taxable sales and (2) large amounts are deposited in transportation–related special funds.
Taxable Sales. Figure 10 shows that taxable sales generally experienced strong growth in 2004 and 2005, but slowed sharply in 2006 as the economy started decelerating. Then, in 2007, growth dropped to only 0.8 percent. This deterioration has been especially driven by the decline in California’s real estate market and its adverse impact on sales of building materials, home furnishings, and related household items. However, it also is related to the negative impacts of higher gasoline prices on consumer spending on big–ticket items, particularly light vehicles sales (cars, smaller trucks, and SUVs). California also appears to have experienced a fairly soft holiday shopping season, which added to the underlying weakness related to housing and autos.
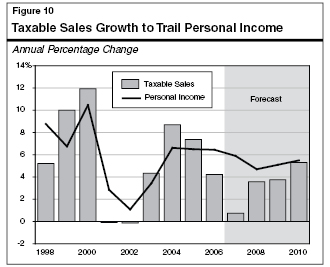
We expect that taxable sales growth will be a modest 3.6 percent in 2008, with the first one–half of the year especially weak. Then, we forecast that taxable sales growth will pick up a bit in 2009, averaging 3.8 percent, as the housing market continues to stabilize. As Figure 10 indicates, we expect taxable sales growth to trail growth in personal income in both years. Our taxable sales forecasts consider the effects of a variety of factors including personal income, housing activity, employment, the savings rate, unemployment, general inflation, and gasoline prices and consumption.
Public Transportation Account (PTA)–Related Revenues. A second factor depressing sales tax revenues to the General Fund in the current and budget years is a large and growing amount of revenues from gasoline and diesel fuel sales tax that goes to the PTA instead of the General Fund. These revenues include the so–called spillover of SUT revenues, gasoline sales tax revenue associated with Proposition 111, and diesel sales tax revenues. Currently, the largest of these items, the spillover, is based on a formula established in the early 1970s that basically compares taxable sales of gasoline to taxable sales of all other products. (This formula was established at the time California extended the SUT to gasoline sales and in exchange reduced the SUT rate, with the aim of the formula being to ensure that any extra monies raised by this action would go to transportation.) Under this formula, the transfer increases when the share of total taxable sales that is attributable to gasoline increases. Thus, it is sensitive to both gasoline prices and consumption. In practice, the spillover has tended to increase during periods of high gasoline prices, and decrease, or disappear, during periods of low gasoline prices. We forecast that PTA–related SUT revenues totaled $947 million in the prior year and will reach $1,137 million in 2007–08 and $1,247 million in 2008–09. These amounts are based on our forecasts for taxable sales and the prices and consumption of fuel. (As we discuss in a write–up in the
Analysis of the 2008–09 Budget Bill, beginning in 2008–09, one–half of all spillover will be used each year to offset General Fund expenditures on transportation. Please see “Funding for Transportation Programs” in the “Transportation” chapter of the Analysis.)
Other Adjustments. Our SUT forecast also includes $58 million in budget–year revenues for the various SUT revenue–generating tax enforcement and compliance activities by BOE that the Governor has proposed. In addition, it includes revenues of $5 million in 2007–08 and $21 million in 2008–09 due to the Governor’s proposal to reinstate the 12–month rule for applying the use tax to out–of–state purchases of vessels, vehicles, and aircraft.
The CT is the third largest state revenue source, accounting for 12 percent of total estimated revenues in 2008–09. The tax is levied at a general rate of 8.84 percent on California taxable profits. Banks and other financial institutions subject to the CT pay an additional 2 percent tax, which is in lieu of most other state and local levies. Corporations that qualify for California Subchapter “S” status are subject to a reduced 1.5 percent corporate rate. In exchange, the income and losses from these corporations are “passed through” to their shareholders where they are subject to PIT. Similarly, businesses that are classified as Limited Liability Companies (LLCs) pay a minimum tax and fee at the corporate level. Their income and losses are passed through to their owners, where they are subject to the PIT. California also imposes a corporate minimum tax and a 6.65 percent AMT.
Approximately two–thirds of all CT revenues come from multistate and multinational corporations. These companies have their consolidated U.S. income apportioned to California based on a formula involving the share of their combined property, payroll, and sales that is attributable to this state.
California’s CT allows for a variety of exclusions, exemptions, deductions, and credits, many of which are related to, similar to, or identical to those provided under the federal corporate profits tax. Key examples include the research and development (R&D) tax credit and net operating loss carry forward provisions. Under the latter, companies can use operating losses incurred in one year as a deduction against earnings in subsequent years. Under legislation enacted in 2002, corporations were not able to use these losses to offset their income in tax years 2002 and 2003. However, such deductions were allowed again beginning in 2004, and the percentage of losses which may be carried forward and deducted against future tax liabilities jumped from 65 percent under prior law to 100 percent for losses incurred starting in 2004. In “Part V” we propose limiting allowable net operating loss deductions again, as well as R&D credits that may be claimed, to help deal with the budget problem.
Revenues Have Been Slowing. After many years of near–stagnant growth, revenue collections from the CT grew rapidly between 2001–02 and 2005–06. In 2006–07, however, growth slowed to around 8 percent, as corporate profits started to slow along with the economic activity generally.
We forecast that CT receipts will be $10.3 billion in 2007–08, an 8 percent drop from the prior year. Thereafter, we forecast that revenues will grow to $11.5 billion in 2008–09 (a 12 percent increase) and remain at that level in 2009–10.
Our estimates take into account our projected changes in taxable business profits, as well as such factors as tax credits and audit collections. Our CT forecast also includes $14 million in budget–year revenues for the various CT revenue–generating tax enforcement and compliance activities by FTB that the Governor has proposed. Finally, as for the PIT, our revenue estimates assume the Governor’s proposal to accrue a portion of the revenues associated with the September 2009 CT prepayment into 2008–09, and to continue this thereafter. This latter factor increases our 2008–09 revenues by a bit over $760 million. Without this accrual change, our CT revenue growth in 2008–09 would be much lower—about 5 percent.
Our CT revenue forecast is below the budget estimate by $422 million for the current year and $403 million for the budget year, or $825 million for the two years combined.
The key determinant of CT tax revenues is California taxable profits. As shown in Figure 11, these profits were up by a strong 25 percent in 2004 and 22 percent in 2005, reflecting widespread earnings increases. Profits growth then started to drop off, coming in at a still healthy, but much slower, 8 percent in 2006 as the economy started to cool and the housing market’s problems started to emerge. In 2007, as these trends continued, profits growth slowed sharply to an estimated 4 percent.
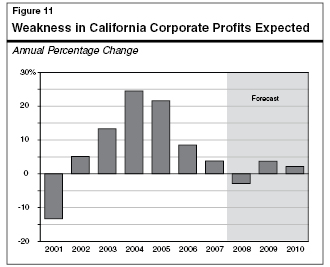
Further Profits Slowing Expected. Looking ahead, we forecast that taxable California corporate profit growth will deteriorate even more and experience an actual decline in 2008 of 3 percent, before returning to a modest growth of 4 percent in 2009 off of this lower base. Although some industry sectors will continue to experience gains, many others will not—especially those relating to the housing sector, real estate–related financial activities, manufacturing operations providing home construction materials, and financial firms associated with the mortgage market’s problems. Our California profits forecast considers the impacts of such factors as national profit trends (given that so many of our firms are multinational and multistate enterprises), proprietor’s income (which is closely related to profits and for which very timely data are available), employment activity, and financial market performance such as stock market developments.
The remaining 5 percent of total 2008–09 General Fund revenues and transfers consists primarily of taxes on insurance premiums, alcoholic beverages, and tobacco products. It also includes interest income; tribal gambling receipts; oil–related royalties; and a large number of fees, loans, and transfers.
We forecast that combined revenues from all of these other sources will rise from $5.3 billion in 2006–07 to $9.1 billion in 2007–08, before falling to $5.8 billion in 2008–09 and $5.4 billion in 2009–10. These totals and their year–to–year variation are affected by a variety of factors, some of a unique one–time nature and others of a more ongoing nature. Relative to the administration, our revenues in this category are down $637 million in the current year but up $553 million in the budget year, or down $84 million for the two–years combined.
As noted earlier, 2007–08 revenues include $3.3 billion in one–time deficit–financing bond proceeds that will be used to help address the budget problem. These proceeds, which are borrowed money and not revenues in the true sense, are nevertheless included in the revenue totals for budgetary accounting purposes.
This is the state’s fourth largest individual revenue source and involves a tax of 2.35 percent on most types of insurance premiums written. We project that revenues will reach $2.1 billion in 2007–08, $2.3 billion in 2008–09, and $2.4 billion in 2009–10. This moderate growth reflects steady increases in taxable insurance premiums for homeowners, automobiles, and other types of coverage, partially offset by declines for workers’ compensation. The projections include downward adjustments to revenues of $175 million in 2007–08 and $100 million in both 2008–09 and 2009–10 associated with a BOE appeals case. For the current and budget years combined, our projections are very close to the administration‘s—down $15 million.
We project that the interest income the state will receive from investing its idle funds on a short–term basis will be $478 million in 2007–08 and $420 million in 2008–09. This compares to $533 million in 2006–07. The drop reflects the combination of (1) declining interest yields earned on the state’s invested funds and (2) the state’s tighter fiscal situation, which affects its fund balances available to invest at any given time. For the current and budget years combined, our projections are down $104 million compared to the administration.
The Governor’s budget assumes that tribal gambling compact payments to the General Fund will total $154 million in 2007–08 and $430 million in 2008–09. (The 2008–09 figure does not include $40 million of tribal payments to be transferred to the account that distributes funds to non–compact tribes.) We believe that these estimates are overstated. The administration has assumed that five Southern California tribes—including the four tribes affected by the recent approval of Propositions 94, 95, 96, and 97—grow their casinos’ customer bases and expand slot machine operations much more rapidly than we expect to be the case. For the current and budget years combined, we estimate that General Fund compact revenues will be below the budget forecast by $173 million.
These monies, which largely represent the proceeds the state receives under profit–sharing agreements with the oil field operators, are projected to total $320 million in 2007–08 and $304 million in 2008–09 and thereafter. This high level of revenues compared to earlier years reflects the recent rise in world crude oil prices and, thus, the value of the oil that our properties produce. For the current and budget years combined, our projections are up $217 million above the administration‘s. This reflects an updated revenue projection by the State Lands Commission since the budget came out to capture the effects of recent oil price increases.
Special funds revenues are related to a variety of sources:
- About $9.5 billion (or 35 percent of the budget–year total) is related to motor vehicle–related revenues. These include the vehicle license fee, which is assessed in lieu of the property tax and whose proceeds are distributed to local governments. They also include fuel taxes and registration fees, which support transportation–related spending.
- Another $5.9 billion is related to the SUT. Of this total, (1) about $3 billion is used to fund health and social services programs that were realigned from the state to local governments beginning in the early 1990s, (2) $1.5 billion is related to the diversion of local sales taxes for deficit–financing bond debt service, and (3) about $1.3 billion is used for transportation programs.
- Roughly $1.6 billion is related to the high–income PIT surcharge for mental health programs under Proposition 63.
- $976 million is from tobacco taxes that have been approved by voters in various elections.
- The remaining special funds revenues are related to a wide variety of sources, including an energy resource surcharge and beverage container redemption fees. The special fund totals are also affected by various transfers and loans between funds.
As shown in Figure 12, the Governor’s budget assumes that special funds revenues will total $25.3 billion in the current year (a 2 percent
increase) and $26.9 billion in 2008�09 (a 6.4 percent increase). A variety
of
|
|
|
Figure 12
Summary of the Budget's
Special Funds Revenue Forecast |
|
(Dollars in Millions) |
|
|
|
2007‑08 |
|
2008‑09 |
|
|
Actual
2006-07 |
Estimated
Amount |
Percent
Change |
|
Projected
Amount |
Percent
Change |
|
Motor Vehicle Revenues |
|
|
|
|
|
|
|
License fees (in lieu) |
$2,270 |
$2,332 |
2.7% |
|
$2,392 |
2.6% |
|
Fuel taxes |
3,433 |
3,504 |
2.1 |
|
3,565 |
1.8 |
|
Registration, weight and
miscellaneous fees |
2,850 |
2,969 |
4.2 |
|
3,545 |
19.4 |
|
Subtotals |
($8,553) |
($8,805) |
(2.9%) |
|
($9,503) |
(7.9%) |
|
Sales and Use Tax |
|
|
|
|
|
|
|
Realignment |
$2,862 |
$2,887 |
0.8% |
|
$3,013 |
4.4% |
|
Deficit-financing bonds |
1,411 |
1,443 |
2.2 |
|
1,522 |
5.5 |
|
Transportation |
951 |
1,158 |
21.8 |
|
1,343 |
16.0 |
|
Subtotals |
($5,225) |
($5,488) |
(5.0%) |
|
($5,878) |
(7.1%) |
|
Other Sources |
|
|
|
|
|
|
|
Personal income tax
surcharge |
$1,375 |
$1,493 |
8.6% |
|
$1,565 |
4.8% |
|
Cigarette and tobacco taxes |
963 |
952 |
-1.1 |
|
976 |
2.5 |
|
Interest earnings |
474 |
379 |
-20.1 |
|
339 |
-10.4 |
|
Other revenues |
8,109 |
8,285 |
2.2 |
|
8,692 |
4.9 |
|
Transfers and loans |
77 |
-130 |
— |
|
-70 |
— |
|
Totals |
$24,776 |
$25,271 |
2.0% |
|
$26,884 |
6.4% |
|
|
|
Detail may not
total due to rounding. |
|
|
factors are affecting the year–to–year growth rates, including varying amounts of sales tax spillover revenues going to transportation and other transfers between funds. Special funds revenues from ongoing tax sources are projected to increase by roughly 4 percent in 2007–08 and 7 percent in 2008–09. The budget–year growth rate reflects moderate increases in SUT and PIT special funds tax revenues, and modest increases in vehicle license fees, motor vehicle fuel taxes, and tobacco taxes.
Return to Perspectives and Issues Table of Contents, 2008-09 Budget AnalysisReturn to Full Table of Contents, 2008-09 Budget Analysis