Analysis of the 2008-09 Budget Bill: Perspectives and Issues
The Governor’s budget proposes total spending in 2008–09 of $128.8 billion, including $101 billion from the state’s General Fund and $27.8 billion from its special funds (see Figure 1). This total budget–year spending is $3.4 billion lower than current–year spending—a decrease of 2.6 percent—due to the Governor’s proposed budget reductions. Of total budget–year spending, General Fund spending accounts for about 78 percent. This proposed total spending level translates into $3,351 for every Californian, or $353 million per day.
|
|
|
Figure 1
Governor's Budget Spending Totals |
|
(Dollars in Millions) |
|
|
|
|
Change |
|
|
2007-08 |
2008-09 |
Amount |
Percent |
|
Budget Spending |
|
|
|
|
|
General Fund |
$103,373 |
$100,998 |
-$2,375 |
-2.3% |
|
Special Fundsa |
28,836 |
27,774 |
-1,062 |
-3.7 |
|
Totals |
$132,209 |
$128,772 |
-$3,437 |
-2.6% |
|
|
|
a Reflects LAO
adjustments as detailed in text. |
|
Detail may not
add due to rounding. |
|
|
Spending Totals Reflect Budget Reductions. The Governor’s proposed 2008–09 budget includes $10.7 billion ($9.1 billion General Fund) in budget–balancing reductions, which touch most areas of state government. In some of the administration’s budget summaries, these reductions are excluded from program spending totals or shown as a separate line item. In contrast, the displays in this publication always allocate the reductions to their respective program area. This helps provide an accurate reflection of how each program’s spending would change under the Governor’s proposals. With respect to special funds, the budget’s published information shows 2008–09 budget–balancing reductions of $1.5 billion. However, nearly all of the proposed reductions would not impact the amount of spending from special funds. Instead, the reductions would reduce the amount of federal funds received by the state, which are excluded from most state budget summaries. (The administration reports that it did not have sufficient time in preparing the budget documents to break out the reductions between state special funds and federal funds.) Under the Governor’s proposals, federal funds would be reduced by $1.7 billion, partially offset by about $200 million in increased special funds and reimbursements. The displays in this publication make adjustments to the spending totals to accurately reflect the proposed split of the reductions and, thus, do not tie to the budget’s published spending information tables.
Figure 2 shows the allocation of the proposed $128.8 billion of total state spending in 2008–09 among the state’s major program areas. Both General Fund and special fund expenditures are included in order to provide a meaningful comparison of state support among broad program categories, since special funds provide the bulk of support in some areas (such as transportation).
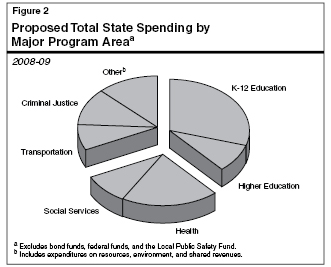
The figure shows that K–12 education receives the largest share of spending—30 percent of the total. (K–12 education also receives additional funding from the local property tax and State Lottery.) When higher education is included, education’s share rises to 39 percent. Health and social services programs account for 29 percent of proposed total spending, while transportation (8 percent) and criminal justice (12 percent) account for the major portions of the remainder.
Background. The General Fund is the main source of support for state programs, funding a wide variety of activities. For example, it is the major funding source for K–12 and higher education programs, health and
social services programs, criminal justice programs, as well as tax relief provided through the budget.
Proposed Spending. The Governor proposes General Fund spending of $101 billion for 2008–09, a decrease of 2.3 percent. As has been the case in recent years, the year–to–year changes in many programs are being affected by special factors, such as funding redirections and one–time actions. As shown in Figure 3:
- General Fund spending for K–12 Proposition 98 programs is proposed to be $35.5 billion, a 5.4 percent decline from the current year. This reflects the administration’s proposal to suspend the Proposition 98 minimum guarantee by $4 billion. Accounting for local property tax revenue growth, total combined state and local funding for K–12 Proposition 98 would decline by 2.2 percent.
- General Fund Proposition 98 spending for community colleges is proposed to total $4 billion, a 2.2 percent decline from the current year. This reduction reflects the proposed suspension of Proposition 98, partially offset by budget–year funding to restore current–year apportionment reductions and accommodate enrollment growth. Accounting for local property tax growth, community college funding would rise slightly in 2008–09, up 0.9 percent.
|
|
|
Figure 3
General Fund Spending by Major Program |
|
(Dollars in Millions) |
|
|
|
|
Proposed 2008‑09 |
|
|
Actual 2006‑07 |
Estimated 2007‑08 |
Amount |
Percent Change |
|
Education |
|
|
|
|
|
K-12 Proposition 98 |
$37,264 |
$37,473 |
$35,461 |
-5.4% |
|
Community Colleges
Proposition 98 |
4,030 |
4,116 |
4,027 |
-2.2 |
|
UC/CSU |
5,883 |
6,231 |
6,035 |
-3.1 |
|
Other |
4,120 |
6,027 |
5,587 |
-7.3 |
|
Health and Social
Services |
|
|
|
|
|
Medi-Cal |
$13,406 |
$14,064 |
$13,585 |
-3.4% |
|
CalWORKs |
2,018 |
1,481 |
1,547 |
4.5 |
|
SSI/SSP |
3,534 |
3,641 |
3,748 |
2.9 |
|
In-Home Supportive Services |
1,474 |
1,630 |
1,633 |
0.2 |
|
Other |
8,580 |
8,762 |
8,786 |
0.3 |
|
Criminal Justice |
$11,802 |
$13,036 |
$13,122 |
0.7% |
|
Transportation |
$2,980 |
$1,439 |
$1,485 |
3.3% |
|
All Other |
$6,323 |
$5,474 |
$5,983 |
9.3% |
|
Totals |
$101,413 |
$103,373 |
$100,998 |
-2.3% |
|
|
- University of California and California State University combined funding is proposed to be $6 billion, a 3.1 percent decline from the current year. Most of the reduction is unallocated by the administration and would be partially offset by student fee increases.
- Medi–Cal funding is proposed to total $13.6 billion, a 3.4 percent decline from the current year. The reduction reflects a number of budget reduction proposals, including a 10 percent provider payment reduction and the elimination of some optional benefits for adults.
- California Work Opportunity and Responsibility to Kids (CalWORKs) spending would increase by 4.5 percent to $1.5 billion in the budget year. This reflects rising costs due to the granting of a 4.25 percent cost–of–living adjustment (COLA) and one–time savings in 2007–08, partially offset by budget–year savings from a CalWORKs reform package.
- Supplemental Security Income/State Supplementary Program spending is proposed to total $3.7 billion, an increase of 2.9 percent. The Governor proposes to suspend the June 2008 and June 2009 COLAs provided for in current law.
- In–Home Supportive Services (IHSS) spending is proposed to total $1.6 billion, a 0.2 percent increase from the current year. Higher costs from increased caseload are offset by proposed reductions in domestic service hours.
- Criminal justice funding is proposed to increase by 0.7 percent to $13.1 billion. The relatively flat amount reflects some rising costs offset by the Governor’s correctional early release and summary parole proposals.
- Transportation spending from the General Fund is proposed to total $1.5 billion, an increase of 3.3 percent from the current year. This reflects the expected growth in the General Fund transfer of gasoline sales tax revenues to transportation programs required under Proposition 42 (March 2002).
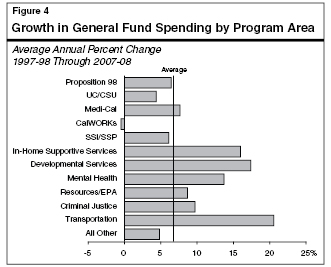
Growth in Spending. Since 1997–98, General Fund spending has averaged about 7 percent annual growth. Figure 4 illustrates that this annual growth rate varies considerably by major state program. For instance, General Fund spending on transportation has increased at the fastest rate due to the passage of Proposition 42. Several health and social services programs—IHSS, developmental services, and mental health—have averaged double–digit growth over the past decade. Resources and environmental protection spending has increased an average of almost 9 percent due to increased debt–service payments attributable to the passage of a number of general obligation bonds over the period. On the other hand, General Fund spending on CalWORKs has fallen slightly since 1997–98 (the program’s first year of spending as part of welfare reform)—due to declining caseloads and various funding shifts.
Background. Special funds are used to allocate certain tax revenues (such as gasoline and certain cigarette tax receipts) and various other income sources (including many licenses and fees) for specific functions or activities of government designated by law. In this way, they differ from General Fund revenues, which can be allocated by the Legislature among a variety of programs. About 35 percent of special fund revenues come from motor vehicle–related levies and another 22 percent come from sales taxes. The remainder comes from numerous source—including a 1 percent surcharge on personal income taxes, tobacco taxes, charges, and fees.
Proposed Spending. In 2008–09, the Governor proposes special fund spending of $27.8 billion. This is a 3.7 percent decrease from the current–year total. As shown in Figure 5, the budget includes a 12 percent decrease in special fund spending on transportation between the current and budget year. This decline mainly reflects a much lower level of motor fuel sales tax revenues projected to be available in the Public Transportation Account for local transit projects. (Per existing law, some of this funding is instead being used to offset transportation expenses previously supported by the General Fund.) The spending decline is also related to one–time capital outlay expenditures by the California Highway Patrol and the Department of Motor Vehicles in 2007–08. A budget–year decrease of 11 percent for the California Public Utilities Commission results from reductions in supplemental payments to telephone companies, which are made to reduce the price difference of telephone service between high– and lower–cost areas. The large current–year increase in the Department of Mental Health reflects the ramp–up of spending associated with voter approval of Proposition 63 in November 2004.
|
|
|
Figure 5
Special Funds Spending by Major Program Area |
|
(Dollars in Millions) |
|
|
|
|
Proposed 2008‑09 |
|
|
Actual
2006‑07 |
Estimated
2007‑08 |
Amount |
Percent
Change |
|
Transportation |
$5,866 |
$8,120 |
$7,138 |
-12.1% |
|
Local government subventions |
6,368 |
5,985 |
6,819 |
13.9 |
|
Resources related |
2,634 |
3,651 |
3,418 |
-6.4 |
|
Public Utilities Commission |
1,211 |
1,383 |
1,231 |
-11.0 |
|
Department of Mental Health |
371 |
1,531 |
1,528 |
-0.2 |
|
All other |
6,104 |
8,164 |
7,639 |
-6.4 |
|
Totals |
$22,554 |
$28,836 |
$27,774 |
-3.7% |
|
|
Local Public Safety Funds Excluded. The budget’s special funds spending total for 2008–09 excludes expenditures of roughly $3 billion from the Local Public Safety Fund (LPSF). Such spending is also excluded from the current– and prior–year totals. Our view is that LPSF revenues are state tax revenues expended for public purposes, and should be counted. This treatment is consistent with how the budget treats other dedicated state funds, such as the Motor Vehicle License Fee Account (which, like the LPSF, is constitutionally dedicated to local governments) and the Cigarette and Tobacco Products Surtax Fund (Proposition 99). In both of these cases, the budget does include these funds in its spending totals. Although we believe that spending from the LPSF constitutes state spending, we do not include it in our figures in order to facilitate comparisons with the Governor’s budget.
In addition to the $128.8 billion of proposed 2008–09 spending from the General Fund and special funds, the budget also proposes $56 billion in spending from federal funds and another $14 billion from bond proceeds. If expenditures from bond proceeds and federal funds are included in total state spending, proposed 2008–09 spending exceeds $198 billion.
About $56 billion in federal funds are proposed to be spent through the state budget in 2008–09. (This is about one–fourth of the $242 billion in total federal funds allocated to California. The remaining three–fourths are allocated directly to local governments, businesses, or individuals within the state.) About $33 billion (59 percent) of the total federal funds in the budget are for various health and social services programs, such as Medi–Cal, CalWORKs, and IHSS. Education receives another $10 billion (18 percent) of the total, and transportation is expected to receive $4 billion (7 percent). As noted earlier, the Governor’s budget reductions would reduce federal funds spending in 2008–09 by $1.7 billion.
Bonds are primarily sold by the state to finance large infrastructure projects, such as school facilities, water projects, and state buildings. From a budgetary perspective, the cost of bonds is reflected when the actual debt–service payments (comprised of bond–related principal and interest payments) are made. From a programmatic perspective, bond spending is tracked when the bond proceeds are used, such as for construction projects or grant funding. Below, we discuss infrastructure bond spending from both of these perspectives.
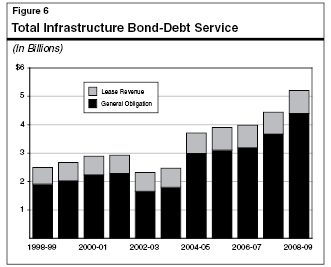
Infrastructure Debt Service. For 2008–09, the budget proposes General Fund debt–service expenditures of $5.2 billion, of which $4.4 billion is for general obligation bonds and about $810 million is for lease–revenue bonds. The use of bond financing has risen sharply in recent years, especially with respect to general obligation bonds. Since 1970, voters have authorized a total of $122 billion in general obligation bonds. Of this amount, $85 billion has been authorized since 2000—with $43 billion approved by the state’s voters in 2006 alone. The increase in bond financing has led to a sharp increase in the amount of spending on infrastructure debt service (see Figure 6). Specifically, total infrastructure debt service has doubled over the past decade, from $2.5 billion in 1998–99 to $5.2 billion in 2008–09. These costs will continue to rise as additional bonds are sold to fund the November 2006 general obligation bond package and the AB 900 (Solorio) lease–revenue prison construction bond package. If adopted, the Governor’s proposal for $48 billion in additional general obligation bonds would push these costs even higher.
Spending of General Obligation Bond Proceeds. The Governor’s budget proposal estimates that the state will spend $13.8 billion in general obligation bond proceeds for capital projects in 2008–09. This includes $6.7 billion for education, $3.9 billion for transportation, and $3.2 billion for resources and other areas. This total is up 5.8 percent from the $13.1 billion in current–year spending. More than $10 billion in spending in each year is associated with the November 2006 bond package.
Spending of Lease–Revenue Bond Proceeds. In addition to general obligation bonds, the state also uses lease–revenue bonds to finance the construction and renovation of capital facilities. Lease–revenue bonds do not require voter approval, and their debt service is paid from annual lease payments made by state agencies using the facilities financed by the bonds (funded primarily through General Fund appropriations). For 2008–09, the budget proposes $319 million in new spending from lease–revenue bond proceeds for such purposes as the construction of correctional facilities and forest fire stations.
In addition to borrowing for capital outlay purposes, the state has undertaken significant borrowing in recent years to help address budgetary shortfalls. Including the proposed sale of $3.3 billion in deficit–financing bonds in 2007–08, the state will begin 2008–09 with $25 billion in budget–related debt outstanding from private investors, schools, local governments, transportation, and other special funds. As illustrated in Figure 7, this consists of:
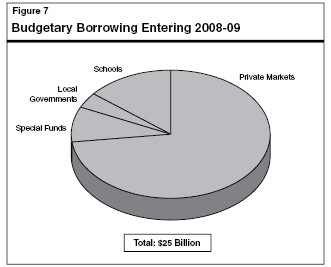
- About $18 billion from private credit markets, with roughly $10 billion from the deficit–financing bonds and the remainder from tobacco–related bonds. The basic mechanism for repayment of the state’s deficit–financing bonds is the “triple flip” which diverts one–quarter of a cent of sales tax revenues to debt payments. Supplementary payments on the deficit–financing bonds are made through the Budget Stabilization Account (BSA).
- Around $2.3 billion from deferred transportation payments and various special fund loans, primarily in the resources areas.
- About $1 billion from local governments related to deferred reimbursements of noneducation state–mandated costs.
- About $3.6 billion in obligations related to Proposition 98 education—from the settle–up of past minimum guarantee payments and legislation regarding the 2004–05 suspension of the guarantee.
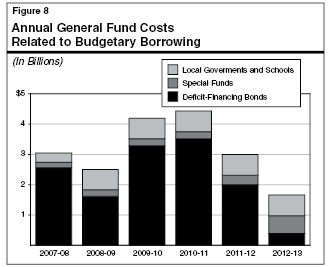
As shown in Figure 8, scheduled repayments of this budgetary borrowing will decline in 2008–09. This reflects the Governor’s proposal to suspend the 2008–09 BSA transfer on a one–time basis—which eliminates the supplementary deficit–financing bond repayment in the budget year.
The resumption of supplementary repayments in 2009–10 results in total General Fund budgetary borrowing debt–service costs of $4.2 billion, rising to a peak of $4.4 billion in 2010–11. After 2010–11, the deficit–financing bond payments decline significantly in two consecutive years—reflecting the end of BSA supplementary payments in 2011–12 pursuant to constitutional provisions (reaching a $5 billion cap on total BSA repayments) and the complete pay off of the bonds early in 2012–13.
Background. In 1979, California’s voters established a state appropriations limit (SAL) when they approved Proposition 4. The SAL places an “upper bound” on the amount of tax proceeds that the state can spend in any given year, and grows annually by a population and cost–of–living factor. Most state appropriations are subject to SAL. Certain appropriations, however, are exempt—including those for subventions to schools and local governments, capital outlay, and tax relief. If actual tax proceeds exceed SAL over a two–year period, the excess must be divided among taxpayer rebates and Proposition 98 education funding.
Expenditures Projected to Be Well Below the Limit. Due to the downturn in the state’s economy and its adverse effects on the state’s revenues, expenditures supported by taxes fell during the early years of this decade. (Spending supported by borrowed funds in those years does not count against SAL.) Although tax–supported spending has rebounded in recent years, a large gap still remains between the limit and spending subject to it. In 2007–08, appropriations subject to the limit are $16 billion below the limit, and in 2008–09, the gap narrows to $11 billion.
Statutory and Discretionary COLAs. Each year, the budget includes funds for cost–of–living adjustments, commonly referred to as COLAs. The purpose of these adjustments is to compensate for the adverse effects of inflation on the purchasing power of the previous year’s funding level. Existing law authorizes automatic COLAs for over two dozen programs, mostly in the areas of K–12 education, social services, health, and the judiciary. These are generally referred to as statutory COLAs. These COLAs are based on a variety of different formulas. For example, the COLAs that are applied to social services programs are based on the California Necessities Index, COLA adjustments for the trial courts are related to growth in the SAL factor, and general apportionments and some categorical programs in Proposition 98 are currently linked to the U.S. gross domestic product price deflator for state and local governmental purchases. Other programs receive COLAs on a discretionary basis, through decisions made during the annual budget process.
In a number of cases as the 2008–09 budget was being prepared, programs were provided COLAs in the workload budget but then reduced or eliminated by across–the–board or other types of reductions. For instance, the workload budget provided K–12 education with a 4.94 percent COLA in accordance with statute. Yet, K–12 education was then subject to an across–the–board reduction which eliminated the COLA. Please see departmental or program write–ups in the
Analysis for discussion of specific COLA issues, including a discussion in the “Education” chapter regarding a proposed change to the K–12 education COLA.
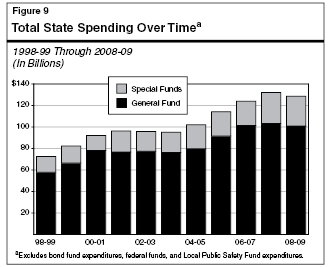
Total Spending. Figure 9 shows total state spending over the decade 1998–99 through 2008–09 (as proposed) by General Fund and special fund categories. Total spending grows over this period from $72.6 billion to $128.8 billion—an average annual growth rate of roughly 6 percent. In the early part of the period, spending surged as rapid increases in capital gains and stock options increased available revenues. Beginning in 2001–02, however, total state spending flattened for several years as the state faced drops in revenues and consistent budget shortfalls. Despite the shortfalls, spending did not significantly decline due to numerous one–time funding shifts, deferrals, and other forms of budgetary borrowing. The one–time factors included an accounting change to Medi–Cal, increased federal funds (which temporarily offset state spending), savings related to a restructuring of debt–service payments, and a two–year shift of property taxes from local governments to schools (resulting in savings to the General Fund). As revenues rebounded, spending grew sharply in 2005–06 through 2007–08, reflecting such factors as funding increases primarily in education and criminal justice, the conclusion of the property tax shift, and repayments of budgetary debt.
Inflation–Adjusted Spending. Part of the spending growth discussed above is related to the effects of a growing population and rising prices over time. Figure 10 shows total state spending after adjusting for these factors. It indicates that:
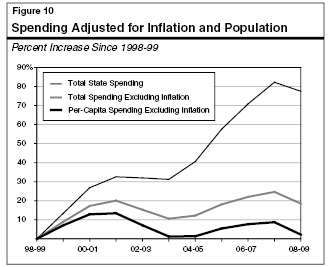
- After adjusting for inflation, real spending has grown by roughly 18 percent over the entire period, or an annual average growth rate of roughly 1.7 percent.
- Real per–capita spending—which adjusts for both inflation and population growth—would increase by about 2.2 percent over the period under the Governor’s plan, for an average annual rate of 0.2 percent.
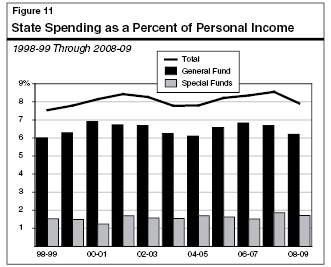
Spending Relative to the State’s Economy. Figure 11 shows how state spending has varied over recent years as a percentage of total California personal income (which is a broad indicator of the size of the state’s economy). Spending increases in recent years pushed this ratio to a peak of 8.6 percent in 2007–08. Under the Governor’s budget, however, the ratio of total state spending to California personal income would decline to 7.9 percent in 2008–09, as personal income is projected to rise modestly while spending would decline.
Return to Perspectives and Issues Table of Contents, 2008-09 Budget AnalysisReturn to Full Table of Contents, 2008-09 Budget Analysis