2009-10 Budget Analysis Series: Social Services
California’s major social services programs provide a variety of benefits to its citizens. These include income maintenance for the aged, blind, or disabled; cash assistance and welfare–to–work services for low–income families with children; protecting children from abuse and neglect; providing home–care workers who assist the aged and disabled in remaining in their own homes; and subsidized child care for families with incomes under 75 percent of the state median. Under the Governor’s budget proposal, General Fund expenditures for the state’s social services programs would be $8.7 billion in 2009–10, about 9.1 percent of proposed General Fund expenditures for all purposes.
Most social services are administered at the state level by the Department of Social Services (DSS), the Department of Child Support Services (DCSS), and the other Health and Human Services Agency (HHSA) departments. The actual delivery of many services at the local level is carried out by 58 separate county welfare departments. The major exception is SSI/SSP, which is administered mainly by the U.S. Social Services Administration. Below, we summarize the purpose and operation of the state’s major social services programs.
Supplemental Security Income/State Supplementary Program
The SSI/SSP provides monthly cash grants for low–income aged, blind, or disabled individuals and couples. The SSI portion of the grant is supported by federal funds and the SSP portion is a state–only supplement to the federal grant. Under current law, a federal COLA is applied to the federal portion of the grant every January, and a state COLA is applied to the combined state and federal grant each June.
The state contracts with the U.S. Social Security Administration to administer the SSI/SSP benefit payments. Generally, to be eligible for the program, an applicant’s income, with some exceptions for certain sources of income, must be at or below the amount of the SSI/SSP monthly grant ($870 for individuals). Additionally, an individual is usually ineligible for SSI/SSP if he or she has assets in excess of $2,000 ($3,000 for couples), with certain exclusions, such as homes and vehicles. To qualify for SSI/SSP on the basis of age, an individual must be age 65 or older. To be eligible for the grant based on disability, an applicant must demonstrate that he or she is unable to work because of a permanent or long–term mental or physical impairment.
State–Only Program for Legal Immigrants. The state–only funded CAPI provides a monthly cash grant to legal immigrants who are aged, blind, or disabled. This program serves those who meet SSI/SSP eligibility requirements, but who are not otherwise eligible to receive SSI/SSP due to their immigration status.
CalWORKs
The CalWORKs program was created in 1997 in response to the 1996 federal welfare reform legislation, which created the federal Temporary Assistance for Needy Families (TANF) program. CalWORKs provides cash grants and welfare–to–work services to families whose income is inadequate to meet their basic needs.
To be financially eligible for CalWORKs, a family’s income must be below a specified income level (for example, $1,170 per month for a family of three) and meet specified asset limits. Grants vary by family size and where they reside. Currently, the maximum monthly grant for a family of three is $723 in higher–cost counties. Current law applies a COLA to the maximum grant each July. Once on aid, families may remain eligible for aid despite having significant additional earnings because of program rules establishing an “earned income disregard,” which does not count substantial earned income when determining the family’s grant. In addition, CalWORKs families receive a monthly Food Stamp allotment as described more fully below. Generally, able–bodied adults are limited to five years of cash aid, while children are not subject to such time limits.
Work Requirements. Federal law generally requires that states ensure that at least 50 percent of their cases with adults be working either 20 or 30 hours per week, depending on the age of the youngest child. (Federal law provides states with credits that reduce this obligation if they reduce their welfare caseloads.) Failure to meet the net federal work participation rate (WPR) may result in substantial federal financial penalties on the state.
California law governing the CalWORKs program requires single parents to work 32 hours per week or participate in related education and training activities. Higher weekly hours are required for two–parent cases. Able–bodied adults, who are required to participate, receive child care and other services to help them work, obtain training, or find work. Able–bodied adults are generally limited to five years of cash assistance. If an adult reaches the five–year limit, the family’s grant is reduced by the amount attributable to the adult and the children continue to receive aid in a program known informally as the “safety–net.” Children with ineligible parents (such as undocumented persons) receive a “child–only” grant throughout their time on aid.
Funding. To receive the $3.7 billion federal TANF block grant, California must meet a maintenance–of–effort (MOE) requirement of $2.9 billion. Although the MOE requirement is primarily met through state and county spending on CalWORKs, some state spending in other programs and departments is also counted toward satisfying the requirement.
Food Stamp Program
The federal Food Stamp program provides monthly benefits to low–income households and individuals to assist them with food purchases. Generally, to qualify for the Food Stamp program, a household’s gross income must be below 130 percent of the federal poverty level, and the household must meet other financial eligibility criteria, including an asset limit of $2,000 (with exclusions for homes and vehicles).
Participants in the Food Stamp program receive monthly benefits on Electronic Benefit Transfer cards, similar to debit cards, which can be used at participating stores. The maximum food stamp allotment depends on household size. For example, the maximum monthly allotment is $463 for a household of three.
The cost of the federal food benefits is borne entirely by the federal government. Associated administrative costs are shared between the federal government (50 percent), the state (35 percent), and the counties (15 percent). We note that a recently enacted federal law, the Food, Conservation, and Energy Act of 2008 (Public Law 110–246), renames the Food Stamp program the Supplemental Nutrition Assistance Program, or SNAP.
State–Only Food Stamp Program for Noncitizens. The California Food Assistance Program provides state–funded monthly benefits to legal noncitizen adults between 18 and 65 years of age who have resided in the United States for less than five years, but otherwise meet all federal food stamp eligibility requirements.
In–Home Supportive Services
The IHSS program provides in–home care for persons who cannot safely remain in their own homes without such assistance. In order to qualify for IHSS, a recipient must be aged, blind, or disabled and in most cases have income at or below the level necessary to qualify for SSI/SSP.
After the IHSS application, a county social worker visits the home of the recipient and uses a uniform assessment tool to determine the number of hours for each type of IHSS service that a recipient qualifies for in order to remain safely in his/her own home. Assistance is provided with such tasks as cleaning, meal preparation, bathing, grooming, and helping with medications and prosthetic devices. The IHSS recipients are sent a notice informing them of the number of authorized hours for each task. Typically, social workers conduct reassessments annually to determine whether the services needed by the recipient have changed.
Once the recipient is authorized IHSS service hours, he or she must find an IHSS provider to perform those services. In the IHSS program, the recipient is considered to be the employer, who has the responsibility to hire, train, supervise, and fire their provider.
Nevertheless, representatives of IHSS providers are authorized under state law to participate in collective bargaining with the county for uniform salary and benefit levels in their jurisdictions. Currently, the state contributes a share of the cost of wages and benefits for each IHSS worker up to $12.10 per hour. Any wage or benefit costs above $12.10 per hour are paid for by counties and the federal government.
Child Welfare System
The purpose of California’s child welfare system is to prevent, identify, and, when necessary, respond to allegations of child abuse and neglect. Following a report of child abuse or neglect, county Child Welfare Services (CWS) social workers are obligated under state law and regulations to take various steps to resolve the situation. Social workers investigate such allegations and provide services to children who have been identified as victims, or potential victims, of abuse or neglect. Services may also be provided by counties to the families of the children to address such concerns.
When an investigation indicates further actions are warranted, CWS social workers may temporarily or permanently remove children from their homes for health and safety reasons and place them in Foster Care. Children are typically placed in Foster Care by the action of a juvenile court, which provides ongoing supervision of what are known as dependency cases. A Foster Care placement can be with either an individual family or a group home setting. Family and group providers receive monthly grant payments for the 24–hour care and supervision of the child.
Children in Foster Care may eventually be reunified with their parents or placed in adoption or guardianship when family reunification is not possible. In most cases, adoptive parents and guardians are eligible for monthly grants paid through either AAP or the Kin–GAP program. When a child is reunified with his or her family, or permanently placed with an adoptive family or guardian, the court generally dismisses the dependency case and CWS services end.
The child welfare system is supported by federal, state, and county funds. With the exception of the Kin–GAP program, children in the programs described above are eligible for support from federal funding if their parents have incomes below specified levels. Typically, about 75 percent of Foster Care children are federally eligible.
Community Care Licensing
The Community Care Licensing (CCL) Division of DSS develops and enforces regulations designed to protect the health and safety of individuals in 24–hour residential care facilities and day care. The CCL oversees the licensing of about 86,000 facilities, including child care centers, family child care homes, foster family and group homes; adult residential facilities; and residential facilities for the elderly. Counties who have opted to perform their own licensing operations monitor approximately 11,000 of these facilities.
In order to receive and maintain a license to operate a community care facility, applicants and providers are charged an initial licensing fee and an annual renewal fee. Depending on facility type and capacity, application fees range from $60 to $10,000, while annual fees range from $60 to $5,000. The CCL program is supported with federal funds, General Fund, and fee revenue.
Department of Child Support Services
In California, both parents have a legal duty to provide financial support for their children. The goal of DCSS is to collect support payments from a noncustodial parent on behalf of the custodial parent and the child.
Once a custodial parent applies for assistance in collecting child support, local child support agencies (LCSAs) work to (1) locate absent parents; (2) establish the paternity of a child; (3) obtain, enforce, and modify child support payment orders; and (4) collect and distribute child support payments. Using a statutory guideline, which reflects both parents’ income and time with their children, local courts determine the amount of the child support order. Orders may be enforced in various ways including the withholding of wages and unemployment benefits, interception of tax return refunds, and the placement of liens on real property.
When a family receiving child support is also receiving public assistance, DCSS distributes the first $50 per month collected from the non–custodial parent to the custodial parent and child. Any additional amount is deposited in the state General Fund to partially offset the state’s costs for providing public assistance. Generally, if the family is not receiving public assistance, the money collected by DCSS goes to the custodial parent.
The DCSS is supported by a combination of state (34 percent) and federal (66 percent) funds.
Total Spending. From 2001–02 through 2008–09, General Fund spending on social services programs increased from $8.3 billion to $10.2 billion, an average annual increase of 3 percent. Figure 1 shows total spending from 2001–02 though 2009–10, as proposed by the Governor. For the budget year, the Governor proposes new special funds to offset General Fund spending. (These special funds are reflected in the small second “bar” on top of the General Fund bar for 2009–10.) As the figure shows, General Fund spending increased by about $500 million in 2002–03 and then grew very slowly through the end of 2005–06, when spending reached $9.2 billion. In 2006–07 General Fund spending increased by $600 million to $9.8 billion. General Fund spending fluctuated in 2007–08 and 2008–09 mostly due to TANF fund shifts rather than underlying changes in actual program costs. For 2009–10, the Governor’s budget would reduce spending by $1.5 billion down to $8.7 billion due to various proposed actions to address the state’s fiscal problems.
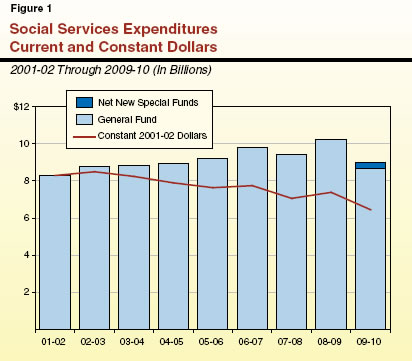
Adjusting for Inflation. Figure 1 also displays spending on social services programs adjusted for inflation (constant dollars). On this basis, total General Fund expenditures decreased from $8.3 billion in 2001–02 to $7.4 billion in 2008–09. If adopted, the Governor’s budget would reduce constant dollar spending to $6.4 billion, a reduction of 22 percent since 2001–02.
Comparison to Overall General Fund Spending. For most of this decade, General Fund spending on social services programs has ranged between 9.5 percent and 11.5 percent of total General Fund outlays. For 2008–09, social services’ share is estimated to be 11.2 percent. Under the Governor’s budget, social services’ share would drop to 9.4 percent in 2009–10, after adjusting for special fund shifts.
Spending growth rates vary widely by program. Figure 2 shows the average annual spending growth rate by program from 2001–02 through 2008–09. The SSI/SSP, the largest social services program, has been growing at a relatively steady pace of 3.3 percent. The second largest program is CalWORKs, which has been relatively flat throughout this period. The next largest program is IHSS, which has been growing relatively rapidly, at an average annual rate of just over 11 percent. Programs for children, including CWS, Foster Care, and AAP, have grown collectively at an average annual rate of 3.8 percent. All other social services programs, have collectively declined by an average of 1.8 percent annually.
Figure 2
Major Social Services Programs
Average Annual Spending Growth Rate |
2001‑02 Through 2008‑09
(General Fund) |
Program |
Rate |
SSI/SSP |
3.3% |
CalWORKs |
-0.1 |
IHSS |
11.2 |
Children's programs |
3.8 |
Child Support |
-1.4 |
County administration and automation |
6.4 |
All other |
-7.7 |
Total |
3.0% |
Program “Cost Drivers”
In general, the primary factors driving up costs for social services programs are changes in caseload, COLAs (if provided), county administrative costs, and labor costs for providing the services. Below, we discuss these factors as they pertain to the largest social services programs.
IHSS. As noted above, IHSS is by far the fastest growing social services program, as well as one the fastest growing programs in the state budget overall. The primary cost drivers are caseload, provider wages, and hours of services provided. From 2001–02 through 2008–09, IHSS General Fund expenditures increased by over $940 million (110 percent), despite a federal waiver which increased federal financial participation in the program. During the same time period, the caseload increased by 61 percent. The remaining 49 percent of the spending increase is mostly due to higher wages paid to providers. A small portion of the increase is attributable to an increase in the average number of service hours authorized for recipients.
SSI/SSP. Spending on SSI/SSP increased from $2.8 billion in 2001–02 to $3.5 billion in 2008–09, an increase of over $700 million (or 26 percent). The primary cost drivers in the SSI/SSP program are caseload growth and annual COLAs. From 2001–02 through 2008–09, the SSI/SSP caseload grew by about 15 percent. An additional 6.5 percent of the growth in the cost of the program is attributable to two state statutory COLAs provided between 2001–02 and 2008–09. (Over this time period legislation was enacted to suspend six other scheduled state statutory COLAs.) The remaining portion of growth is mostly due to increases in the CAPI caseload during this time period.
CalWORKs. General Fund spending on CalWORKs has been essentially flat during this decade, averaging about $2 billion each year. Modest caseload declines were partially offset by two COLAs granted during this time period (COLAs were statutorily suspended for six of the eight years), and some increases in spending on county administration and welfare–to–work services. We also note that, during this time period, hundreds of millions of TANF block grant funds were annually used to offset General Fund costs in other state programs. The CalWORKs caseload has just recently begun to increase, a trend that we discuss later in this analysis.
Programs for Children. From 2001–02 through 2008–09, General fund spending for various children’s programs increased collectively by just under $400 million (or 30 percent). Substantial spending growth in the AAP during this period accounts for about one–half of the total growth for these children’s programs. About one–third of the spending growth is attributable to discretionary investments in (1) child welfare, specifically the outcome improvement project (OIP), and (2) new services for emancipating foster youth.
No Regular Inflationary Adjustments for County Administration. From 2001–02 through 2008–09 counties were not provided annual inflationary adjustments to account for increases in their cost of doing business. At times, however, the Legislature has provided specific allocations of additional funding, such as with the OIP for child welfare or for CalWORKs administration, in part to recognize that county administrative costs for these programs have been increasing.
Overall Spending by Program
The Governor’s budget proposes General Fund expenditures of $8.7 billion for 2009–10, a reduction of $1.5 billion (15 percent) compared to proposed spending for 2008–09. Figure 3 shows proposed expenditures for the major programs. We note that the proposed spending for 2008–09 reflects almost $400 million in budget solutions proposed for the current year. Moreover, the amounts shown in Figure 3 for CWS/Foster Care/Adoptions Assistance reflect a General Fund reduction of $275 million that would be backfilled under the Governor’s budget plan with special funds from a proposed redirection of Proposition 10 funds.
Figure 3
Social Services Programs
General Fund Spending |
(Dollars in Millions) |
|
Actual
2007‑08 |
Proposed |
Change From 2008‑09 |
2008‑09 |
2009‑10 |
Amount |
Percent |
SSI/SSP |
$3,623.5 |
$3,514.5 |
$2,579.7 |
-$934.8 |
-26.6% |
CalWORKs |
1,481.7 |
1,996.5 |
1,958.2 |
-38.3 |
-1.9 |
In-Home Supportive Services |
1,686.5 |
1,798.7 |
1,603.3 |
-195.4 |
-10.9 |
CWS/Foster Care/Adoptions |
1,596.5 |
1,682.3 |
1,366.0 |
-316.3 |
-18.8 |
Department of Child Support Services |
326.4 |
400.2 |
330.0 |
-70.2 |
-17.5 |
County Administration/Automation |
451.0 |
500.6 |
540.2 |
39.7 |
7.9 |
All other social services programs |
266.8 |
322.6 |
299.1 |
-23.5 |
-7.3 |
Totals |
$9,432.4 |
$10,215.3 |
$8,676.5 |
-$1,538.9 |
-15.1% |
|
SSI/SSP = Supplemental Security Income/State Supplementary Program; CalWORKs = California Work Opportunity and Responsibility to Kids; CWS = Child Welfare Services. |
Proposed Budget Solutions
In the social services area, the Governor proposes about $385 million in solutions for 2008–09 and just over $3 billion in solutions for 2009–10. Figure 4 lists the Governor’s proposals for each program. Below, we summarize the major themes for these solutions. One common theme is that all of these solutions are ongoing rather than one–time. In the next section of this document, these solutions, along with other solutions that we have developed, are evaluated in more detail.
Figure 4
Governor’s Proposed Budget Solutions for Social Services |
(General Fund, In Millions) |
Program/Description |
Governor’s Budget |
2008‑09 |
2009‑10 |
SSI/SSP |
|
|
Reduce grants to federal minimum |
$180.1 |
$1,117.2 |
Eliminate CAPI (state only SSI/SSP for immigrants) |
20.0 |
129.6 |
Suspend June 2010 state COLA |
— |
27.0 |
CalWORKs |
10 percent grant reduction |
$45.2 |
$294.0 |
Child-only time limit (five-year limit for child-only cases) |
38.4 |
261.7 |
Modified safety net (five-year limit for cases with adult) |
36.4 |
260.7 |
Self-sufficiency reviews (recertification in person at six months) |
3.5 |
97.2 |
Suspend July 2009 COLA |
— |
79.1 |
Suspend pay-for-performance county incentives |
— |
40.0 |
Reduce childcare reimbursements to 75 percent of RMR |
— |
30.9 |
In-Home Supportive Services (IHSS) |
|
|
Reduce state participation in IHSS wages to minimum |
$44.5 |
$266.8 |
Eliminate domestic and related services for low functional index (FI) |
11.9 |
71.4 |
Eliminate SOC buyout for low FI |
6.4 |
46.0 |
Proposition 10 |
|
|
Eliminate state commission and redirect 50 percent of local funds to DSS
Children's programs |
— |
$275.0 |
Food Stamps |
|
|
Eliminate California Food Assistance Program |
— |
$37.8 |
Automation |
|
|
Delay Los Angeles replacement system by six months |
— |
$14.6 |
Totals |
$386.3 |
$3,049.1 |
|
CAPI = Cash Assistance Program for Immigrants; RMR = regional market rate; COLA = cost-of-living adjustment; SOC = share of cost;
DSS = Department of Social Services. |
- Grant Reductions and COLA Suspensions. For 2009–10, the proposed budget would achieve savings of over $1.1 billion in SSI/SSP and nearly $400 million in CalWORKs from grant reductions and COLA suspensions. We note that the COLAs are based on the change in the California Necessities Index (CNI). The Governor assumed the CNI would be 2.94 percent, but actual data indicate the CNI will be 1.53 percent.
- Benefit Terminations in CalWORKs. The budget proposes to create five–year time limits for children on CalWORKs whose parents are unwilling or unable to meet specified work participation requirements. These proposals would result in caseload savings of over $500 million.
- Wage–Related Changes. The budget proposes to reduce state participation in the wages paid to IHSS providers to the minimum wage. Counties and the federal government would share in any wage costs above the minimum wage. This proposal would result in savings of about $265 million.
- Redirection of Proposition 10 Funds. The budget proposes to ask the voters to eliminate the state Proposition 10 commission and reduce funding for local commissions by 50 percent. If approved by the voters, the $275 million in funds freed up by these changes would be used to offset General Fund costs for CWS, Foster Care, and AAP.
- Elimination of Benefits for Legal Noncitizens. The budget would achieve savings of almost $170 million by eliminating state–only funded cash and food assistance programs for legal immigrants.
Finally, we note that for many programs, the Governor proposes a package of solutions with interactive effects. If the Legislature rejects a given proposal, such a rejection could alter the solution value of other proposals.
Return to Social Services Table of Contents, 2009-10 Budget Analysis SeriesReturn to Full Table of Contents, 2009-10 Budget Analysis Series