LAO Contacts
- California Student Aid Commission
- University of California
- Hastings College of the Law
- California Community Colleges
- California State University

 Report in PDF
LAO Report
February 16, 2017The 2017-18 Budget
Higher Education Analysis
- Executive Summary
- Introduction
- Higher Education in Context
- University of California
- California State University
- California Community Colleges
- Hastings College of the Law
- California Student Aid Commission
- Summary of Recommendations
Executive Summary
In this report, we analyze the Governor’s higher education budget proposals. Below, we highlight key messages from the report.
Key Messages
UC’s Spending Plan Raises Several Issues to Consider. First, regarding enrollment, the state recently has begun setting the University of California’s (UC’s) enrollment target one year out to better align with UC’s admissions calendar. We recommend the Legislature continue this approach by setting a 2018‑19 enrollment target but waiting to set the specific target until after it has received two forthcoming reports. We recommend using trailer legislation to provide the associated funding in 2018‑19. Second, UC’s Academic Excellence initiative lacks clear objectives and detail. If UC is unable to provide sufficient justification for this initiative, we recommend redirecting the associated funding to higher priorities. Finally, the Legislature faces two other significant UC decisions in the coming year: (1) whether to use Proposition 56 funding to replace or augment existing funding for graduate medical education, and (2) whether to allow UC to increase nonresident enrollment in 2017‑18.
CSU Facing Notable Cost Pressures, Difficult Decisions Between Tuition Increases and Cost Increases. The California State University (CSU) faces significant cost pressures in the budget year—most notably, pressure to fund faculty bargaining agreements already ratified by the Board of Trustees last spring. Given recent compensation increases for faculty, pressure also exists to provide some compensation increase for other employee groups with expiring contracts. Another notable cost pressure is funding enrollment growth for eligible transfer students, some of whom have been denied admission in recent years. Were the Legislature to approve the General Fund level proposed by the Governor, CSU asserts it would be able to cover the costs of the previously ratified faculty contracts and some basic cost increases. It would not be able to provide compensation increases for other employee groups or enroll additional transfer students. Were the Legislature to want these other priorities funded, additional General Fund support or tuition revenue would be required. As tuition charges have been flat at CSU for the past six years, the Legislature may want to consider a tuition increase. A 2.5 percent tuition increase would generate enough revenue to support a 1 percent compensation pool and 1 percent enrollment growth for eligible transfer students.
California Community Colleges (CCC) Budget Proposals Could be Improved Around the Edges. The Governor proposes to increase apportionments $197 million to cover enrollment growth, a cost‑of‑living adjustment, and a further small unallocated increase. We recommend the Legislature approve these increases, as providing substantial ongoing, general purpose funding would help colleges address certain cost pressures, such as covering pension rate increases, as well as implement local priorities. The Governor also provides $150 million for a one‑time initiative. Though we recommend the Legislature dedicate some new funding for one‑time purposes, we have concerns with the Governor’s guided pathways initiative. In particular, the proposal departs from existing, successful pathway initiatives in key ways and lacks many important details. Nonetheless, the concept has potential and we recommend the Legislature ask the administration and the Chancellor to provide specific additional details about it during spring hearings.
Hastings College of the Law’s Recent Budgetary Approach Raises Concern. In 2016‑17, Hastings anticipates running a $6.4 million operating deficit. Under the Governor’s budget, this trend would continue, with Hastings running an even larger ($8.3 million) deficit in 2017‑18, ending the year with a $10.2 million reserve. Hastings’ recent budget problems stem primarily from its decision to provide more generous financial aid packages to incoming students—a strategy designed to attract higher quality students and boost the school’s prestige. To address its operating deficit, Hastings anticipates it soon will have to reduce spending on financial aid and increase tuition levels—effectively counteracting its earlier decisions. We recommend the Legislature question Hastings during spring budget hearings on its recent budgetary approach, as it appears not to achieve any long‑term objectives while potentially putting pressure on the state in future years to stabilize the school’s financial condition.
Recommend Restructuring State and Institutional Financial Aid Programs. The Governor proposes to phase out Middle Class Scholarships starting in 2017‑18. According to the administration, the phase out is intended to address a state budget shortfall while prioritizing state aid for financially needy students served through the Cal Grant program. We concur with the Governor that prioritizing aid for the financially neediest students is the more effective way to promote college access. Meeting this objective, however, is difficult due to the plethora of existing state and institutional aid programs, which have different eligibility criteria and rules. We recommend the Legislature explore ways to restructure these programs, such as by consolidating them into a single grant or establishing uniform and coordinated eligibility requirements. Such an approach would better position the Legislature to use available funds for optimizing college access and affordability.
Further Improvement Needed in Segments’ Performance and Performance Framework. The segments’ annual performance reports show that performance is improving in some instances but additional improvement is needed. For example, UC’s and CSU’s graduation rates have increased gradually over time, though even now less than 60 percent of CSU freshmen graduate within six years. At CCC, a slightly greater share of students is successfully moving from remedial into college‑level coursework, though overall completion rates are declining. Excess unit‑taking remains a problem at CSU and CCC, with the average CSU student taking 18 semester units (six courses) more than required to obtain a bachelor’s degree and the average CCC student generating more than double the required units for an associate degree. We think opportunities exist to improve the state’s overall performance framework. In particular, we recommend the Legislature direct the CCC Chancellor’s Office to adopt a redesigned performance measurement system that promotes greater transparency and more challenging targets. We also recommend the Legislature collaborate with all three segments to develop meaningful measures related to (1) efficiency and (2) outcomes for college graduates.
Introduction
In this report, we analyze the Governor’s higher education budget proposals. We begin by providing background on higher education in California. In the next five sections, we analyze the Governor’s budget proposals for (1) the University of California, (2) the California State University, (3) the California Community Colleges, (4) Hastings College of the Law, and (5) the California Student Aid Commission. In each of these sections, we provide relevant background, describe the proposals, assess the proposals, and make associated recommendations. The final section consists of a summary of the recommendations we make throughout the report. For many higher education budget tables not included in this report, please see “EdBudget Tables” on our website.
Back to the TopHigher Education in Context
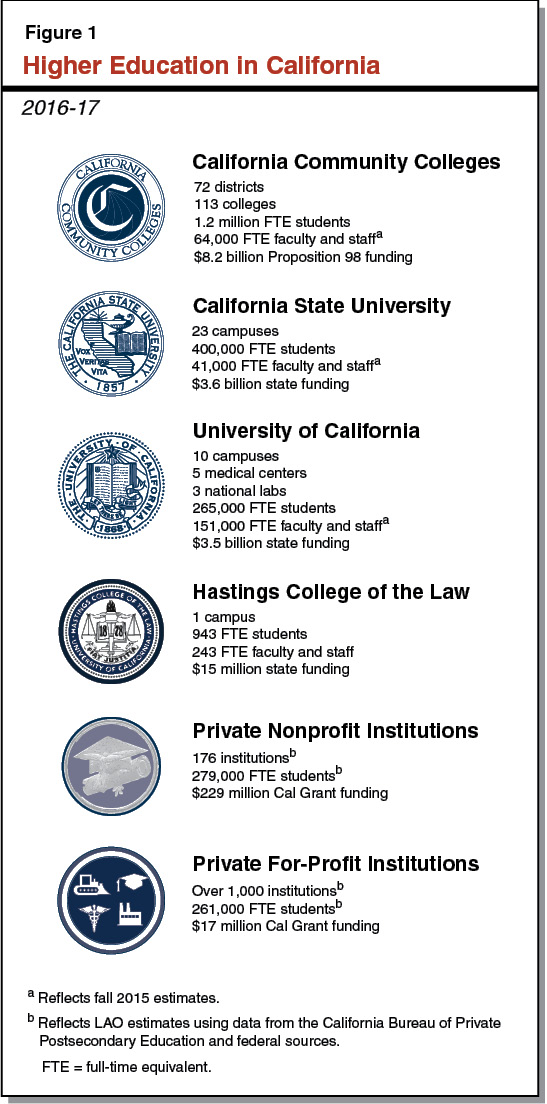
California Has Public and Private Higher Education Sectors. As Figure 1 shows, California has 113 California Community Colleges (CCC), 23 California State University (CSU) campuses, 10 University of California (UC) campuses, and 1 UC‑affiliated law school. Its private sector includes about 175 nonprofit colleges and universities and more than 1,000 for‑profit institutions. About three‑fourths of full‑time equivalent (FTE) enrollment in California is in the public sector. This share is somewhat higher than the share in the public sector in the rest of the nation (two‑thirds of FTE enrollment). California’s share of students in nonprofit colleges is lower than the rest of the nation, whereas its share in for‑profit colleges is similar to the rest of the nation.
Three Key Aspects of Higher Education in California. Below, we provide background on: (1) public higher education enrollment, (2) tuition and financial aid, and (3) institutional and student performance. In cases where data is available, we provide perspective on how California compares to other states. Throughout this section, we cite the most recent data available from government sources. In some cases, particularly for national comparison data, the most recent data is several years old.
Enrollment
Below, we discuss higher education eligibility policies, enrollment trends, and enrollment funding.
Eligibility
Master Plan Sets State’s Goals for College Access. Written in 1960, the California Master Plan for Higher Education established a number of key policies for the state’s public sector. Most notably, the Master Plan set forth each of the three segments’ missions and student eligibility policies. The state and the segments historically have based their enrollment, budget, and physical capacity decisions upon these policies.
Master Plan Assigns Each Public Segment a Different Mission. The Master Plan calls for CCC to provide basic skills instruction, career technical education, and lower‑division instruction. It also sets forth that CCC is to grant associate degrees and certificates as well as prepare students to transfer to four‑year colleges. It calls for CSU to focus on instruction leading to bachelor’s and master’s degrees. It envisions UC as the state’s primary public research university and directs it to grant bachelor’s, master’s, and doctoral degrees.
Master Plan Has Each Public Segment Differing in Selectivity and Cost. Each segment serves somewhat different student populations. The CCC system is to be open to all students over the age of 18, CSU is to be somewhat selective, and UC is to be the most selective segment. Each segment also has different expected costs. CCC has the lowest per‑student cost and UC the highest per‑student (given its research mission).
Master Plan Sets Different Eligibility Policies for Each Segment. The Master Plan envisions CCC as open access, allowing any adult to enroll without set eligibility criteria. By comparison, CSU and UC have eligibility criteria, with UC’s criteria being more selective. For freshman eligibility, UC is to draw from the top 12.5 percent of public high school graduates, whereas CSU is to draw from the top 33 percent. For transfer eligibility, UC is to admit students who have completed lower‑division coursework with at least a 2.4 grade point average, whereas CSU is to admit those having at least a 2.0 grade point average. The transfer function is intended both to (1) provide students who do not qualify for freshman admission an opportunity to earn a bachelor’s degree and (2) reduce costs for students seeking a bachelor’s degree by allowing them to attend CCC for their lower‑division coursework. The Master Plan does not include eligibility criteria for graduate students. Instead, it calls for the universities to consider graduate enrollment in light of workforce needs, such as for college professors and physicians.
UC and CSU Set Admission Requirements to Reflect Eligibility Policies. For freshmen, the university systems are responsible for setting specific admission criteria intended to reflect their respective eligibility pools. As a minimum criterion, both systems require high school students to complete a series of college preparatory courses known as the “A‑G” series. The series includes courses in math, science, English, and other subjects. To qualify for admission, students must complete this series while earning a certain combination of course grades and scores on standardized tests. In 2014‑15, 43 percent of high school graduates completed the A‑G series with a “C” or better in each course. For transfer students, the university systems set general education and pre‑major course requirements. Transfer students completing these courses and meeting the Master Plan’s grade point average requirements are eligible for admission.
Available Evidence Suggests Current Admission Criteria Not Perfectly Aligned to Eligibility Policies. In 2015, 13 percent of high school graduates were admitted to UC and 30 percent to CSU. The segments are likely drawing for admission from larger pools than these percentages, as some eligible students likely do not apply. For example, some eligible students might apply to UC but not CSU, and some eligible students might not apply to either institution, instead opting to attend community colleges, in‑state private universities, or out‑of‑state institutions. As a result, both university systems are very likely exceeding their Master Plan freshman eligibility targets. For transfer students, in fall 2016, UC reports that it admits all eligible applicants, whereas CSU reports denying admission to about 10,300 eligible applicants, mostly nonlocal applicants.
State Currently Conducting a Freshman Eligibility Study to Obtain Better Data. To gauge whether the universities are drawing from their freshman eligibility pools, the state periodically funds “eligibility studies.” These studies examine public high school graduates’ transcripts to determine the proportion of students meeting each university system’s admission criteria. If the proportion is significantly different from 12.5 percent and 33 percent for UC and CSU, respectively, the universities are expected to adjust their admission policies accordingly. For example, UC tightened its admission criteria after an eligibility study conducted in 2003 found it drawing from the top 14.4 percent of public high school graduates. The last eligibility study was conducted in 2007. The 2015‑16 budget provided $1 million for the Office of Planning and Research to complete a new eligibility study by December 1, 2016. (As of the release of this report, the study was not yet published.)
Legislature Recently Directed Segments to Develop Plans for Producing More Degree and Credential Holders. The Public Policy Institute of California prepared a baseline forecast showing UC and CSU awarding around 750,000 and 1.3 million bachelor’s degrees, respectively, between 2015‑16 and 2029‑30. The 2016‑17 budget requires UC and CSU to develop plans to produce 250,000 and 480,000 more bachelor’s degrees, respectively, than these baseline projections. To reach these targets, the budget specifies that the university systems could propose changes that would broaden eligibility, increase enrollment, or improve graduation rates. The 2016‑17 budget also requires CCC to develop a plan that recommends policy and budget changes needed to produce 1 million associate and vocational credentials between 2017 and 2027. Unlike for UC and CSU, no baseline projection was prepared for CCC. The segments are required to submit these reports to the Legislature by March 2017.
Enrollment Trends
Public Sector Enrollment Has Increased Over Past Decade. Over the past decade, resident enrollment at all three segments has increased. (In the box below, we discuss trends in nonresident enrollment.) Compared to 2005‑06, resident enrollment in 2015‑16 was 4 percent (about 44,000 FTE students) higher at CCC, 18 percent (about 58,000 FTE students) higher at CSU, and 12 percent (about 22,000 FTE students) higher at UC. Over this period, CCC enrollment was the most volatile—with a spread of almost 150,000 FTE students from its peak in 2008‑09 to its trough in 2012‑13. Average annual growth over this period was 0.5 percent at CCC, 1.8 percent at CSU, and 1.2 percent at UC. During the preceding two decades (1985‑86 through 2005‑06), average annual growth was 2 percent at CCC, 1.5 percent at CSU, and 2 percent at UC. In 2015‑16, total FTE enrollment reached almost 1,146,000 at CCC, 371,000 at CSU, and 210,000 at UC.
Nonresident Enrollment
All Three Segments Enroll Nonresident Students. Currently, nonresidents make up 17 percent of all students at UC, 6 percent at CSU, and 4 percent at CCC. At UC and CSU, a majority of nonresident students are undergraduates. Most graduate students are able to establish residency after one year of enrolling.
Nonresident Enrollment Varies Significantly By Campus. Within each segment, some campuses, typically high‑demand campuses, have much higher proportions of nonresident students than other campuses. For example, nonresidents comprise more than 20 percent of enrollment at UC’s four most selective campuses (Berkeley, San Diego, Los Angeles, and Irvine). Several selective CSU campuses (San Luis Obispo, San Diego, and San Jose) also enroll greater proportions than other CSU campuses. CCC campuses with notable proportions of nonresident students (such as Santa Monica and Santa Barbara) have higher enrollment demand due to their strong transfer programs.
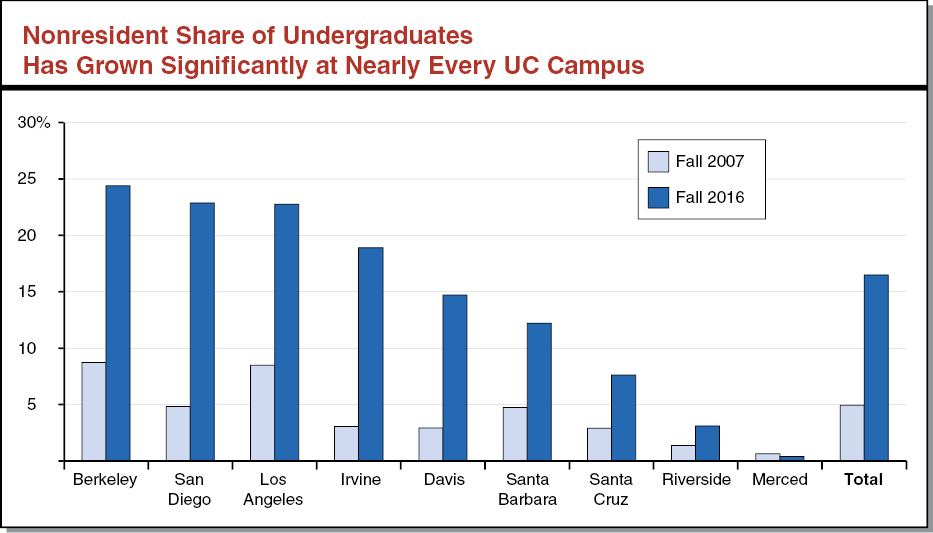
Undergraduate Nonresident Enrollment Has Notably Increased at UC. UC has experienced the largest growth in nonresident students in the recent past, particularly among undergraduates. UC undergraduate nonresident enrollment increased from about 7,100 students in 2007‑08 to an estimated 32,300 students in 2016‑17. Nonresidents’ share of the UC undergraduate student body more than tripled during this time. As the figure below shows, the share of nonresident undergraduates has grown at every UC campus, except for Merced. UC asserts that the growth in nonresident undergraduate students allowed it to further grow resident enrollment. This is because UC charges nonresidents a supplemental charge (around $27,000) that significantly exceeds their average expected cost (around $10,000).
Some UC and CSU Campuses Much More Selective Than Other Campuses. Though enrollment has been increasing at all three public segments, certain UC campuses (such as Berkeley and Los Angeles) continue to deny many applicants admission. Eligible freshmen applicants who are not accepted to their first choice campus are redirected to UC Merced. Differences in enrollment demand also exist across CSU campuses. High‑demand CSU campuses generally give enrollment priority to eligible applicants from their surrounding areas. Six campuses (Fresno, Fullerton, Long Beach, San Diego, San Jose, and San Luis Obispo), however, do not guarantee admission even to their local students.
Number of High School Graduates One Factor Driving Enrollment Demand. Enrollment demand for the three public segments is driven in part by changes in the number of high school graduates. Assuming no other change, an increase in the number of California high school graduates causes a proportionate increase in the number of students interested in attending one of the public segments. The relationship is particularly strong at CSU and UC. For these two segments, an increase in freshman enrollment contributes to an increase in transfer enrollment, as CSU typically enrolls one transfer student for every one freshman and UC aims to enroll one transfer student for every two freshmen. Increases in high school graduates also can have a future effect on transfer enrollment, as some of those students will work their way through the transfer process at CCC over the course of a few years.
In Near Term, High School Graduates Projected to Grow Very Slowly. The Department of Finance’s Demographic Unit does projections of high school graduates. Its most recent forecast projects high school graduates increasing from about 420,000 in 2016‑17 to 445,000 in 2023‑24, followed by declines in the following two years. Over this period (through 2025‑26), the projected average annual growth rate is less than 1 percent. (In our review, we found the Department of Finance’s projections of high school graduates have been fairly accurate one to two years out, but its model tends to underproject high school graduates five to ten years out.)
College Participation Rates Another Factor in Gauging Enrollment Demand. For any demographic group (for example, high school graduates), the percentage of individuals who are enrolled in college is that group’s college participation rate. Other factors remaining constant, if participation rates increase, then enrollment demand increases. Participation rates can change due to a number of factors, including state and institutional efforts to promote college going, the availability and attractiveness of other postsecondary and employment options, student fee levels, and the availability of financial aid.
Freshman College Participation Rates Somewhat Steady. The federal Department of Education estimates that the overall college participation rate of California high school graduates was 59 percent in fall 2012 (the most recent year of available data), somewhat below the fall 2010 rate of 62 percent. In both years, participation rates in California were slightly below the national average. Participation rates in California’s public sector also have been somewhat steady. Between fall 2007 and fall 2015, for example, participation rates have ranged between 7 percent to 8 percent at UC and 11 to 13 percent at CSU. (No comparable CCC data are available.)
Enrollment Funding
Traditionally, State Sets Enrollment Target for Each Segment. Under the traditional approach to funding enrollment, the state first considers the various factors discussed above and sets an enrollment target for each segment. Over the past few decades, the state typically has set one overall enrollment target for each segment rather than separate targets for undergraduate and graduate students. If the state increases a segment’s overall enrollment target, then the state decides how much associated funding to provide for enrollment growth.
UC and CSU Enrollment Growth Traditionally Funded Based on Marginal Cost Formula. In the case of the universities, the state for decades funded enrollment growth according to a “marginal cost” formula that estimated the cost of admitting one additional student. The most recently used formula assumed the universities would hire a new professor for roughly every 19 additional students and linked the cost of the new professor to the average salary of newly hired faculty. In addition, the formula included the average cost per student for faculty benefits, academic and instructional support, student services, instructional equipment, and operations and maintenance of physical infrastructure. The marginal cost formula was based on the cost of all enrollment (undergraduate and graduate students and all academic disciplines excluding health sciences). The state provided each system flexibility to determine how to distribute enrollment funding to its campuses. If the systems did not meet the enrollment target specified in the budget within a certain margin, then the associated enrollment growth funding reverted back to the state.
Over Past Decade, State Has Not Consistently and Clearly Linked Funding to Enrollment Growth for UC and CSU. The state began omitting enrollment targets in the 2008‑09 budget, when it entered the most recent recession and reduced base funding for UC and CSU. The purpose was to provide UC and CSU flexibility to manage state funding reductions. The state resumed enrollment funding from 2010‑11 through 2012‑13, but, in two of the three years, it did not require the universities to return money to the state if they fell short of the target. In 2013‑14 and 2014‑15, the state again chose not to include enrollment targets in the budget. Beginning in 2015‑16, the state resumed setting enrollment targets for UC and CSU, although its approach for UC differed somewhat from previous years. We describe this different approach below.
New Approach Recently Taken for UC. Whereas the state traditionally has set enrollment targets for the budget year, it recently began setting UC’s enrollment target for the subsequent academic year. This change was intended to give UC more time to respond to legislative direction. In the 2015‑16 budget, the state set a goal for UC to enroll 5,000 more resident undergraduate students by 2016‑17 (than the 2014‑15 level) and allocated an associated $25 million in ongoing funding for the growth. The state continued this practice in 2016‑17, setting an expectation that UC enroll 2,500 more resident undergraduate students in 2017‑18 than in 2016‑17. It providing an associated $18.5 million, contingent on UC providing sufficient evidence by May 1, 2017 that it would meet this goal. (The funding also is contingent on UC adopting a policy by the same deadline that limits nonresident enrollment.) The state did not set targets for graduate student enrollment in either year.
State Continues to Link Funding to Enrollment Growth for CCC. Whereas the state’s approach to funding UC and CSU enrollment has fluctuated in recent years, the state has maintained its traditional approach to budgeting for CCC enrollment growth. State law requires that CCC’s annual budget request for enrollment growth be based, at minimum, on changes in the adult population and excess unemployment (defined as an unemployment rate higher than 5 percent). The CCC also may request enrollment growth to cover “unfunded” (or over‑cap) enrollment. The Governor and Legislature do not have to approve enrollment growth at the requested level. As with UC and CSU enrollment, their decisions tend to reflect the state’s budget condition.
Back to the TopTuition and Financial Aid
Below, we examine affordability for undergraduate students from a variety of angles, beginning with a focus on student tuition and living costs, then turning to financial aid.
Tuition and Living Costs
State Currently Does Not Have a Tuition Policy. A tuition policy establishes how tuition levels are to be adjusted over time. Depending on the policy, the tuition charge either explicitly or implicitly represents the share of education cost to be borne by full‑fee‑paying students and the state. The state share of cost consists of the subsidy it provides directly to each of the higher education segments as well as the financial aid it provides to financially needy students to help them cover their tuition charges. Though California had a tuition policy for several years during the late 1980s and early 1990s, it has not had one the last couple of decades.
Tuition Highest at UC, Lowest at CCC. For full‑time undergraduate students, UC charges $12,294, CSU charges $5,472, and CCC charges $1,380 ($46 per unit for 30 units). Campuses in each system also charge additional fees for specific services or activities—such as student health services. Compared to similar public universities in other states, UC’s tuition and fees tend to be higher, whereas CSU’s tend to be much lower. CCC tuition and fees are the lowest in the country compared to other public community colleges, about one‑third of the national average
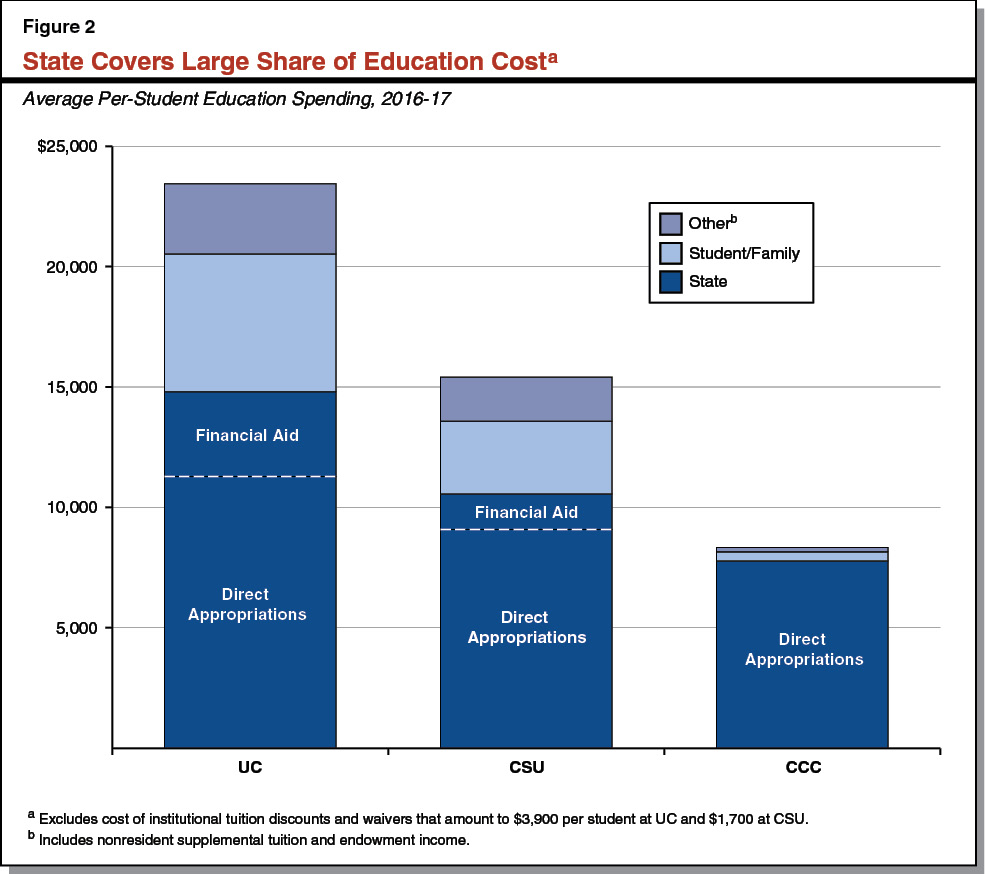
Students and Families Cover Only a Fraction of Education Costs, State Pays Much Larger Share. Tuition and fee levels vary across the segments because (1) their education costs are different, and (2) the state covers a different share of these costs. Figure 2 shows the proportion of education cost at each segment that is covered by students and families, the state, and other fund sources, such as nonresident supplemental tuition. The figure shows both state support in the form of direct appropriations to the segments as well as from state financial aid. At UC and CSU, the student and family share of education costs on average is 24 percent and 20 percent, respectively, with the state share comprising 63 percent at UC and 69 percent at CSU. Other fund sources cover 12 percent at each system. At CCC, the student and family share is only 5 percent, versus a state share of 94 percent. The average share of cost covered by students and families masks some differences, with the share for a particular student depending on the amount of financial aid he or she receives. Even students and families paying full tuition, however, pay much less than the cost of education. Specifically, they pay for 52 percent of education costs at UC, 36 percent at CSU, and 17 percent at CCC. (Not accounted for in the figure are federal grants and tuition tax credits that further reduce the average student and family share of education costs.)
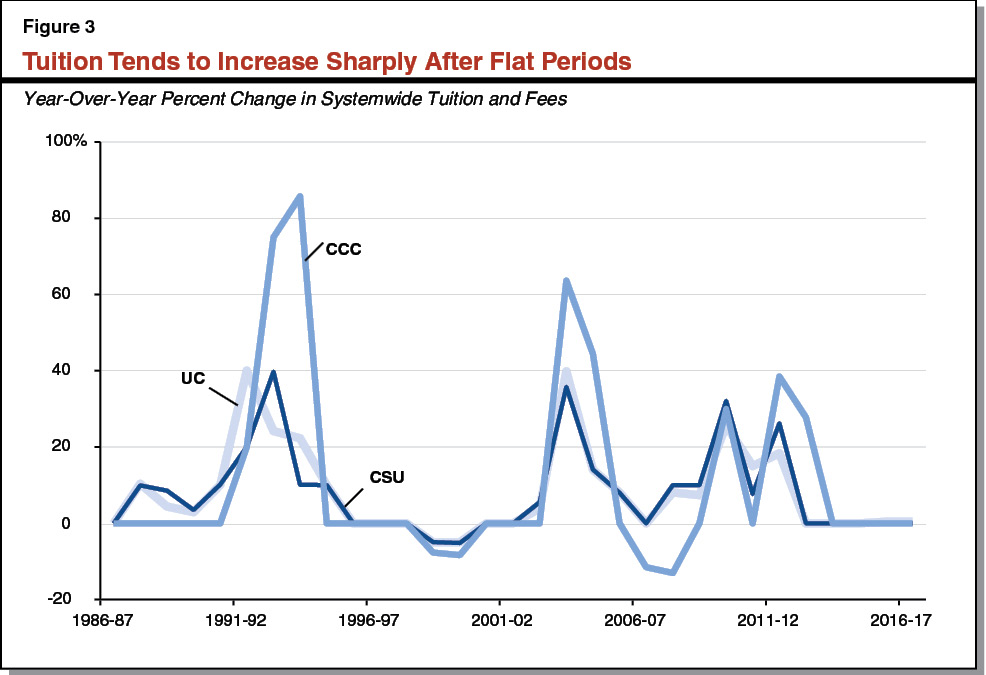
Tuition and Fees Tend to Be Volatile. As shown in Figure 3, tuition and fee levels in California tend to follow a pattern of flat periods punctuated by sharp increases. The flat periods generally correspond to years in which the state experienced economic growth, while the periods of steep increases generally correspond to years when the state experienced a recession. During recessions, the state has often balanced its budget in part by reducing state funding for the segments. UC and CSU, in turn, increased tuition charges to make up for the loss of state support, and the state increased fees at CCC. This pattern could be affected by the new state reserve requirements enacted under Proposition 2 (2014), which could mitigate state revenue losses during recessions.
Estimated Living Costs Vary Based on Several Factors. Apart from tuition, students incur other costs to attend college, including housing and food, personal expenses, books and supplies, and transportation. Estimated living costs vary across each system because each system determines for itself how to estimate these costs. Costs vary across campuses within each system because some expenses (such as housing) vary by location. Costs also vary depending on whether a student lives on campus, off campus not with family, or off campus with family. For example, as Figure 4 shows, UC estimates students living with family face the lowest costs—about 30 percent lower than students living off campus and almost 50 percent lower than students living on campus.
Figure 4
Living Expenses Vary by Student Living Arrangement
University of California, 2015‑16
|
On campus |
Off campus |
Living With Family |
|
|
Rent and food |
$14,199 |
$9,391 |
$4,700 |
|
Health carea |
2,130 |
2,169 |
1,818 |
|
Transportation |
687 |
1,247 |
1,659 |
|
Otherb |
1,700 |
1,884 |
2,032 |
|
Totals |
$18,716 |
$14,691 |
$10,209 |
|
aPrimarily reflects health insurance costs. Students insured through a family member are not required to purchase insurance. bIncludes expenses for clothing, entertainment, and recreation. |
|||
Financial Aid
Various Types of Financial Aid Help Students Cover Their Cost of Attendance. Types of financial aid include gift aid (grants, scholarships, and tuition waivers that students do not have to pay back); loans (that students must repay); federal tax benefits (that can reduce income tax payments or provide a tax refund); and subsidized work‑study programs (that provide income to students while making it more attractive for employers to hire students). Financial aid may be need based (for students who otherwise might be unable to afford college) or nonneed based (typically scholarships or other payments based on academic merit, athletic talent, or military service). Need‑based aid programs assess need based on the Free Application for Federal Student Aid, or FAFSA. The federal government has developed a formula that takes into account information reported on the FAFSA—such as household income, certain available assets, and number of children in college—to determine an expected family contribution (EFC) toward college costs. A student’s financial need is the total cost of attendance (tuition and living costs combined) at a particular campus less his or her EFC.
Many Financial Aid Programs Available for California Students. Figure 5 shows the main aid programs available to undergraduates attending one of California’s public higher education segments. Most programs are need based and most provide gift aid. If a student qualifies for more than one program, then campus financial aid offices “package” together aid for the student. Generally, a student’s aid package cannot exceed his or her estimated college costs (tuition and living combined). When packaging aid, campuses first prioritize awarding gift aid before moving on to awarding loans and work study. Campuses do not award tax benefits. Students and parents claim these benefits on their tax returns.
Figure 5
Major Financial Aid Programs for Undergraduates
(In Billions)
|
Program |
Source |
Expendituresa |
|
Gift Aid |
||
|
Pell Grant |
Federal |
$3.0 |
|
Cal Grant |
State |
1.7 |
|
CCC Board of Governor’s Fee Waiver |
State |
0.8 |
|
UC Grant |
State |
0.8 |
|
CSU State University Grant |
State |
0.6 |
|
Supplemental Education Opportunity Grant |
Federal/state |
0.1 |
|
Middle Class Scholarship |
State |
—b |
|
CCC Full‑Time Student Success Grant |
State |
—b |
|
Subtotal |
($7.0) |
|
|
Loans |
||
|
Direct Student Loans |
Federal |
$1.7 |
|
Parent PLUS Loans |
Federal |
0.4 |
|
Perkins Student Loans |
Federal |
0.1 |
|
Subtotal |
($2.1) |
|
|
Tax benefits |
||
|
Tuition credits and deductions |
Federal |
$1.4c |
|
Coverdell education savings account |
Federal/state |
—b |
|
Scholarshare savings plan |
Federal/state |
—d |
|
Subtotal |
($1.4) |
|
|
Work study |
Federal/state |
$0.1 |
|
Total |
$10.6 |
|
|
a2014‑15 for federal programs and 2015‑16 for state programs. bLess than $50 million. cEstimated based on nationwide expenditures. dNot available. |
||
Cal Grant Program Is the State’s Largest Aid Program. The state’s Cal Grant program guarantees gift aid to California high school graduates and community college transfer students who meet both financial need and academic criteria. Students who do not qualify for one of these entitlement awards may apply for a limited number of competitive grants if they meet other eligibility criteria. Awards cover full systemwide tuition and fees at the public universities and up to a fixed dollar amount toward costs at private colleges. The program also offers $1,678 stipends (known as access awards) for some students. Access awards are intended to help cover some living expenses, such as the cost of books, supplies, and transportation. State spending on Cal Grants has increased from $813 million in 2007‑08 to an estimated $2 billion in 2016‑17, primarily due to sharp increases in the number of award recipients as well as increases in award amounts for students at the public universities.
State Recently Created Two New Aid Programs. The newest state program (created in 2015‑16) is the Full‑Time Student Success Grant—a grant that supplements the Cal Grant access award for CCC students who are enrolled in 12 or more units. The 2016‑17 budget provides $41.2 million for the program to increase the access award by $600—bringing the total access award for qualifying CCC students to $2,078. In 2014‑15, the state created Middle Class Scholarships. This program provides partial tuition coverage for certain UC and CSU students with household income and assets each less than $156,000.
Each Segment Also Offers Institutional Aid. In addition to Cal Grants and Middle Class Scholarships, UC and CSU operate institutional need‑based programs. UC and CSU pay for these programs largely by redirecting a portion of tuition revenue generated from full‑fee‑paying students. When packaging financial aid, UC first applies any applicable federal and state aid on a student’s behalf and assumes each student must contribute $9,700 through work and borrowing. It then uses institutional aid to fill any remaining gap between available resources and the total cost of attendance. About two‑thirds of UC’s institutional aid covers tuition, with the remaining one‑third paying for living costs. By comparison, CSU uses its State University Grant program only to cover tuition for certain students based on their federal expected family contribution. It does not cover other costs of attendance. At CCC, the Board of Governors Fee Waiver program fully covers enrollment fees (but not other costs of attendance) for financially needy students. Institutional need‑based gift aid spending ranges from $803 million at CCC to $764 million at UC to $607 million at CSU.
Half of Public College Students Pay No Tuition, Many Also Receive Gift Aid for Living Expenses. As evident from the above descriptions, most state aid programs are geared toward paying tuition. These programs collectively cover full tuition for around 60 percent of undergraduate students at UC and CSU. At CCC, 44 percent of students receive full fee waivers, paying for two‑thirds of all course units taken. In addition, the federal Pell Grant program and some state programs also pay for some or all of financially needy students’ living expenses. Taken altogether, gift aid for financially needy students cuts their total college costs (tuition and living expenses) in half at the universities. For full‑time students attending CCC, gift aid covers a somewhat lower portion of the cost of attendance—about one‑third.
About Half of University Students Borrow to Pay for College, Very Few CCC Students Borrow. Each year, around 40 percent of UC and CSU undergraduates take out loans, with an average annual loan amount of $6,800 per borrower. Slightly more than half of UC and CSU students have loan debt at graduation, with debt at graduation averaging $19,500. At CCC, only 2 percent of students borrow each year, with an average annual loan amount of $5,500. Student borrowing in California tends to be lower than in other states. For example, about 60 percent of students at four‑year public universities nationally graduate with loan debt, with an average debt load upon graduation of $25,900. (These figures only include student loans, not other forms of debt, such as credit card debt.)
Student Loan Default Rates Low at UC and CSU, Higher at CCC. About 95 percent of all borrowing at UC, CSU, and CCC is through federal loans. For each cohort of undergraduate borrowers entering repayment in a given year, the federal government tracks the percentage of students defaulting within three years, by institution. Three‑year student loan default rates tend to be low at UC and CSU but higher at CCC. Specifically, while no UC campus has a rate greater than 3.6 percent and no CSU campus has a rate greater than 6.7 percent, the vast majority of CCC campuses have rates in excess of 10 percent. The average rate for all institutions nationally is 11.3 percent.
Federal Loans Have Income‑Driven Repayment Plans. The most common type of federal loan—federal direct loans—currently offers new borrowers seven repayment plans. Four of these plans, known as income‑driven repayment plans, vary loan repayments based on the income of the borrower as a way to improve affordability and reduce the likelihood of a student defaulting. For example, the Pay As You Earn Repayment Plan (PAYE) caps monthly repayments at 10 percent of a borrower’s discretionary income (defined as income earned above 150 percent of the poverty level, adjusted for location and household size). Each of these four plans also forgives any remaining loan balances after a set period of repayment. For example, PAYE forgives balances after 20 years of repayment, or 10 years of repayment for eligible borrowers in public service careers.
Back to the TopPerformance
Below, we provide background on the state’s higher education goals and performance measures, review UC’s and CSU’s performance, and then assess CCC’s performance. We then discuss (1) replacing an existing performance measure and (2) potentially adding a new measure.
Background
State Has Set Forth Broad Goals for Higher Education. Chapter 367 of 2013 (SB 195, Liu) establishes three major goals for higher education: (1) improve student access and success, such as by increasing college participation and graduation rates; (2) better align degrees and credentials with the state’s economic, workforce, and civic needs; and (3) ensure the effective and efficient use of resources to improve outcomes and maintain affordability. To monitor progress toward these goals, the law calls for the creation and adoption of performance measures that take into account the distinct missions of California’s higher education segments. In addition, the law states the Legislature’s intent that progress on these measures be reported and considered as part of the state’s annual budget process.
State Has Adopted Performance Measures for Universities. Separate from Chapter 367, Chapter 50 of 2013 (AB 94, Committee on Budget) established eight specific performance measures for UC and CSU. The measures include graduation rates, degree completions, units accumulated upon graduation, and funding per degree. For most measures, the segments must track results for specified student subgroups, including low‑income students and transfer students. Chapter 50 requires the segments to submit related performance reports to the Legislature by March 15 each year.
State Requires Universities to Set Annual Performance Targets. Beginning with the 2014‑15 Budget Act, UC and CSU also are to submit performance reports (commonly referred to as “academic sustainability plans”) by November 30 each year. In these reports, UC and CSU are to set performance targets for each of the above‑referenced statutory measures for each of the coming three years. The plans include several years of actual performance on each of the measures. The Governor proposes to eliminate the requirement for the universities to submit these November reports. In the nearby box, we discuss and assess this proposal.
Universities’ November Performance Reports
The Governor proposes to eliminate the provisional budget language that requires UC and CSU to submit performance reports to the Legislature each November. Given that these plans provide key performance data—including former targets, actual results, and future targets—we recommend the Legislature reject this proposal. Should the Legislature wish to reduce the universities’ reporting workload, we recommend the Legislature eliminate the segments’ statutorily required March performance reports. The March reports contain the same past actual data as the November reports but, unlike the November reports, do not include the universities’ performance targets and certain other useful information.
State Also Requires CCC to Set Performance Targets. Chapter 687 of 2014 (SB 876, Committee on Budget and Fiscal Review) required the CCC Board of Governors to identify performance measures and develop annual performance targets that are “challenging and quantifiable.” The Board of Governors adopted systemwide measures and identified initial targets in July 2014. The systemwide measures come largely from CCC’s Student Success Scorecard, which was developed in 2012. The measures are tracked for a cohort of students over a six‑year period.
Some State Funding Provided in Recent Years to Boost Performance. To date, the state has not adopted a performance funding formula that adjusts funding based upon the segments’ or individual campuses’ performance. The state, however, has provided some funding in recent years intended to improve institutional performance. Most notably, the state increased CCC’s Student Success and Support Program from $49 million in 2012‑13 to $482 million in 2016‑17. In other cases, the segments have chosen to dedicate otherwise unallocated resources for student success initiatives. Most notably, CSU is dedicating $48 million of its unrestricted ongoing base budget to fund its Graduation Initiative, which aims to increase degree completion rates and eliminate achievement gaps over a multi‑year period. The 2016‑17 Budget Act includes an additional $35 million one time for CSU to further the objectives of the Graduation Initiative.
Review of Universities’ Performance
To date, the universities have submitted three annual reports to the Legislature under the new requirements. Based on data from those plans, this section highlights UC’s and CSU’s performance results compared with their targets. Specifically, Figure 6 displays UC’s initial targets for 2015‑16, actual results, and new targets for 2019‑20. Figure 7 provides the same information for CSU.
Figure 6
UC’s Performance Measures and Targets
|
State Performance Measure |
Target for 2015‑16 |
Actual 2015‑16 Performance |
Target for 2019‑20 |
|
CCC Transfers Enrolled. Number and as a percent of undergraduate population. |
33,904 (18%) |
34,197 (18%) |
37,589 (18%) |
|
Low‑Income Students Enrolled. Number and as a percent of total student population. |
71,462 (39%) |
75,608 (40%) |
82,359 (40%) |
|
Graduation Rates |
|||
|
63% |
64% |
68% |
|
57% |
58% |
62% |
|
55% |
55% |
59% |
|
51% |
51% |
55% |
|
Degree Completions. Number of degrees awarded annually to: |
|||
|
34,200 |
34,519 |
39,756 |
|
14,600 |
14,866 |
16,396 |
|
18,600 |
14,497 |
15,580 |
|
21,800 |
24,660 |
28,017 |
|
69,100 |
63,882 |
73,181 |
|
First‑Year Students on Track to Graduate on Time. Percentage of first‑year undergraduates earning enough credits to graduate within four years. |
51% |
52% |
52% |
|
Funding Per Degree. State General Fund and tuition revenue divided by number of degrees for: |
|||
|
$107,771 |
$111,328 |
$126,029 |
|
Not reported |
Not reported |
$74,981 |
|
Units Per Degree. Average quarter units earned at graduation for: |
|||
|
187 |
183 |
183 |
|
100 |
95 |
95 |
|
Degree Completions in STEM Fields. Number of STEM degrees awarded annually to: |
|||
|
17,100 |
20,503 |
23,382 |
|
9,300 |
8,620 |
9,264 |
|
7,100 |
9,284 |
10,549 |
|
CCC = California Community Colleges and STEM = science, technology, engineering, and math. Source: UC Academic Sustainability Plans. |
|||
Figure 7
CSU’s Performance Measures and Targets
|
State Performance Measure |
Target for 2015‑16 |
Actual 2015‑16 Performance |
Target for 2019‑20 |
|
CCC Transfers Enrolled. Number and as a percent of undergraduate population. |
145,436 (36%) |
143,445 (36%) |
144,879 (36%) |
|
Low‑Income Students Enrolled. Number and as a percent of total student population. |
207,528 (50%) |
206,926 (50%) |
218,948 (51%) |
|
Graduation Rates |
|||
|
18% |
19% |
24% |
|
11% |
12% |
19% |
|
54% |
57% |
62% |
|
47% |
52% |
57% |
|
28% |
31% |
36% |
|
26% |
30% |
36% |
|
65% |
62% |
69% |
|
64% |
62% |
69% |
|
Degree Completions. Number of degrees awarded annually to: |
|||
|
37,915 |
38,770 |
47,803 |
|
43,152 |
47,034 |
51,415 |
|
18,938 |
20,788 |
22,248 |
|
40,482 |
51,226 |
64,080 |
|
106,788 |
112,832 |
127,706 |
|
First‑Year Students on Track to Graduate on Time. Percentage of first‑year undergraduates earning enough credits to graduate within four years. |
51%a |
52%a |
57%a |
|
Funding Per Degree. State General Fund and tuition revenue divided by number of degrees for: |
|||
|
$41,049 |
$40,781 |
$42,789 |
|
$51,670 |
$49,991 |
$46,780 |
|
Units Per Degree. Average semester units earned at graduation for: |
|||
|
139 |
138 |
138 |
|
140 |
141 |
141 |
|
Degree Completions in STEM Fields. Number of STEM degrees awarded |
|||
|
18,846 |
20,201 |
26,994 |
|
3,958 |
5,693 |
7,453 |
|
7,470 |
10,462 |
13,927 |
|
aCSU excludes students who do not return to CSU for their second year. Including these students reduces CSU’s performance by about 8 percentage points. CCC = California Community Colleges and STEM = science, technology, engineering, and math. Source: CSU Academic Sustainability Plans. |
|||
UC and CSU Met Their Targets for Graduation Rates for Freshmen And Have Raised Their Targets. Both UC and CSU have exceeded slightly their original targets for four‑year graduation rates for freshmen (for all freshman entrants as well as low‑income freshman entrants). Specifically, both segments ended up 1 percentage point higher than their original targets. For its six‑year graduation rate for freshman entrants, CSU surpassed its target of 54 percent, graduating 57 percent of its students. Both segments have set higher targets for 2019‑20. Figure 8 shows that the universities’ recent improvement is part of a long‑term trend of gradually increasing graduation rates.
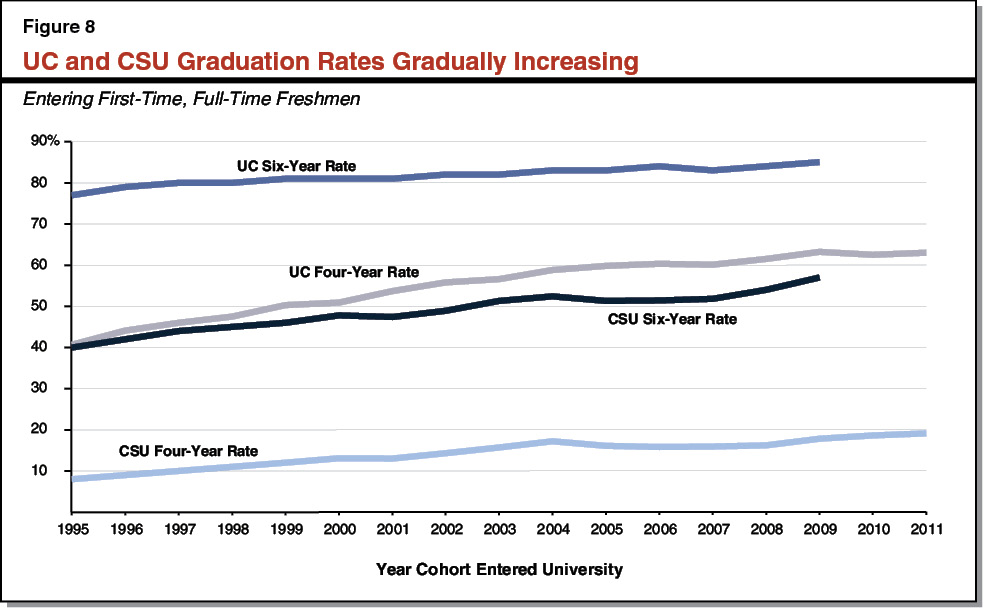
Targets for Graduation Rates for Transfer Students Mostly Met. A two‑year graduation rate for transfer students is analogous to a four‑year graduation rate for entering freshmen. Both UC and CSU either met or exceeded their original targets for two‑year graduation rates for CCC transfer students. The two‑year graduation rate for transfer students at UC has increased from 46 percent a decade ago to 55 percent today. The two‑year rate at CSU has increased from 21 percent to 31 percent over the same period. CSU did not meet its target for the three‑year graduation rate for transfer students (analogous to a six‑year graduation rate for freshmen entrants)—aiming for 65 percent but falling short at 62 percent. As with the graduation targets for freshmen entrants, both segments have set higher out‑year graduation targets for transfer students.
Excess Units Remain a Concern for CSU. Both university systems must track the number of units students have accumulated upon graduation. UC did better than its 2015‑16 target. UC’s 2015 graduating class (consisting of those who began as freshmen as well as transfer students) accumulated an average of four quarter units (one typical course) beyond the typical 180 quarter unit degree requirement. CSU also did better than its 2015‑16 target for entering freshmen. The average number of units accumulated upon graduation, however, was still 18 semester units (six courses) beyond the typical unit degree requirements. Moreover, CSU saw no reduction in accumulated units for students starting as transfers. Despite considerable efforts by the Legislature to improve the transfer process, transfer students who graduated from CSU during the 2015‑16 academic year accumulated an average of 141 semester units—21 semester units (seven courses) beyond the typical semester unit degree requirement.
Review of CCC’s Performance
Below, we review data on key community college performance outcomes and provide a recommendation relating to CCC’s performance measurement system.
At CCC, Rate of Students Progressing From Remedial to College‑Level Courses Improving . . . For CCC, one of the most important “milestone” performance measures is the percentage of students initially placed into precollegiate coursework that end up later passing college‑level math and English courses. Over time, CCC has improved slightly in this area. For remedial math, its progress rate has gone from 29 percent in 2010‑11 to 33 percent in 2014‑15. Progress rates for remedial English have increased from 42 percent to 45 percent over the same period.
. . . But Program Completion Rates Declining Slightly. Though a somewhat greater percentage of students are advancing from remedial courses through college‑level math and English courses, CCC program completion rates have been declining slightly in recent years. Program completion rates peaked at 49 percent in 2011‑12, dipping to 47 percent for 2014‑15. Completion rates decreased both for entering students that were initially assessed as underprepared and assigned to remedial courses, as well as students who were deemed prepared for college‑level coursework.
CCC’s Approach to Setting and Reporting Completion Targets Is Problematic. Figure 9 shows the CCC system’s performance measures. The targets for the first three performance measures cannot be displayed easily. This is because CCC does not set a single target for an incoming cohort of students to complete a program within a set period of time (the methodology that UC and CSU use). Furthermore, CCC rebenches those targets annually based on each cohort’s latest performance. As a result, CCC’s approach can lead to counterintuitive outcomes, such as the system meeting its target even as a cohort of students performs worse than prior cohorts.
Figure 9
CCC’s Performance Measures and Targets
|
Performance Measure |
Target for 2014‑15 |
Actual 2014‑15 Performance |
Target for 2015‑16 |
|
Completion Rate. First‑time students who completed a degree, certificate, 60 transferrable units, or transferred within 6 years of entry. |
—a |
47.1% |
—a |
|
Remedial Progress Rate. Students enrolling in remedial math or English or precollegiate English as a second language (ESL) who completed a college‑level course in that discipline within 6 years. |
—a |
33% in math 45% in English 29% in ESL |
—a |
|
CTE Completion Rate. CTE students who completed a degree, certificate, 60 transferable units, or transferred within 6 years of entry. |
—a |
51.4% |
—a |
|
Associate Degrees for Transfer. Number of these degrees completed annually. |
12,020 |
20,737 |
21,774 |
|
Equity Rate. Index showing whether a subgroup’s completion rate is low compared with overall completion rate. An index of less than 1.0 indicates underperformance. |
|||
|
African American |
0.79 |
0.75 |
Increase above 0.75 |
|
American Indian |
0.73 |
0.88 |
Stay above 0.8 |
|
Asian |
Stay above 0.8 |
1.31 |
Stay above 0.8 |
|
Hispanic |
Stay above 0.8 |
0.84 |
Stay above 0.8 |
|
Pacific Islander |
Stay above 0.8 |
0.81 |
Stay above 0.8 |
|
White, Non‑Hispanic |
Stay above 0.8 |
1.09 |
Stay above 0.8 |
|
Education Plan Rate. Percent of required students who have an education plan. |
Not reported |
57% |
Above 57% |
|
FTE Years Per Completion. A measure of efficiency showing amount of instruction, on average, required for each completion. (A student completing 60 units, the standard length of an associate degree or preparation for transfer, would generate two FTE years.) |
|||
|
Assessed as underprepared |
Below 5.3 |
4.98 |
Stay below 4.98 |
|
Assessed as prepared |
Below 2.85 |
2.72 |
Stay below 2.72 |
|
Overall |
Below 4.39 |
4.15 |
Stay below 4.15 |
|
Participation Rate. Number of students ages 18‑24 attending a community college per 1,000 California residents in the same age group. |
Above 264.7 |
266.6 |
Above 266.6 |
|
Participation Among Subgroups. Index comparing a subgroup’s share of enrollment with its share of the state population. An index of less than 1.0 indicates underrepresentation. |
|||
|
African American |
Stay above 0.8 |
0.9 |
Stay above 0.8 |
|
American Indian |
0.8 |
0.8 |
Stay above 0.8 |
|
Asian |
Stay above 0.8 |
1.19 |
Stay above 0.8 |
|
Hispanic |
Stay above 0.8 |
1.06 |
Stay above 0.8 |
|
Pacific Islander |
Stay above 0.8 |
1.10 |
Stay above 0.8 |
|
White, Non‑Hispanic |
Stay above 0.8 |
0.82 |
Stay above 0.8 |
|
aCCC is unable to provide this information. CTE = career technical education and FTE = full‑time equivalent. |
|||
For Other Performance Measures, CCC Has Set Very Low Bar. Though we were unable to display CCC’s three completion‑related performance measures, Figure 9 shows the six other measures that community colleges use. CCC’s targets for several of these measures are underwhelming as well as inconsistent with both legislative intent and the Board of Governors’ own policy on significantly improving outcomes. For example, in 2014‑15, 57 percent of students who were required to develop an education plan actually had one a year after enrolling. The Board of Governors’ expressed goal is for 100 percent of nonexempt students to have an education plan soon after enrolling. Nonetheless, for 2015‑16, CCC’s target is only to increase—by any amount—above 57 percent. Given the significant recent investments by the Legislature in student support services and the Board of Governors’ own policy, we think this target is much too low. Similarly, CCC students on average generate just over four FTE years to complete an associate degree or certificate or prepare for transfer. CCC’s target is to reduce this amount to four FTE years or less. Given that a student completing 60 units (the standard length of an associate degree) would generate two FTE years, we believe such a target is not sufficiently ambitious.
Recommend Legislature Direct CCC to Revise Performance Measurement System. To promote greater transparency and more challenging targets for CCC, we recommend the Legislature direct the Chancellor’s Office to redesign its performance measurement system. The new system should include performance targets that are clear and understandable and do not change for a given cohort as it moves through a program. Also, consistent with legislative intent, CCC should set challenging targets for all of its metrics. In addition, as part of its review and redesign, the Chancellor’s Office should consider adding shorter cohort periods (such as two years and three years) for its completion and remedial rate metrics. The current amount of time a cohort is tracked (over a six‑year period) results in a long lag time that makes it difficult to assess the extent to which the Legislature’s recent investments in CCC are affecting student outcomes.
A Modified Efficiency Measure
Funding Per Degree Does Especially Poor Job Measuring Efficiency. Among UC’s and CSU’s eight statutory performance measures, two of them—units accumulated per degree and funding per degree—are intended to focus on efficiency. By tracking how many excess units students take, we think units per degree is a useful and meaningful measure of efficiency. In contrast, funding per degree has no obvious nexus with efficiency. Worse, as implemented to date, the measure seems to be promoting inefficiency, as both UC and CSU have set out‑year targets to increase their funding per degree. Moreover, neither segment thinks the measure is useful.
Recommend the Legislature Work With UC and CSU to Develop a More Meaningful Efficiency Measure. For these reasons, we recommend the Legislature adopt trailer legislation replacing funding per degree with a more meaningful efficiency measure. To develop a more meaningful measure, we recommend the Legislature work with the segments and Department of Finance this spring to explore alternatives. Reasonable alternatives could include using data the segments already report to create a cost per student or cost per degree measure. In exploring a new measure, the Legislature also might consider involving CCC in its discussions and applying the new measure to that segment too.
A New Higher Education Performance Measure
State Law Indicates Intent to Track Graduates’ Outcomes. In articulating broad statewide goals for higher education, Chapter 367 identifies greater participation by low‑income students, higher completion rates for all students, and improved outcomes for graduates as important components of student access and success. While each segment has performance measures related to college participation and graduation, none of the segments’ currently adopted measures assesses how graduates do once they leave college and enter the workforce.
Consider Adding a Measure of Graduates’ Outcomes. Measuring students’ outcomes once they graduate from college could give the Legislature a fuller picture of the extent to which the state’s higher education system is meeting workforce needs and adding value to students. One possible new measure could track earnings of graduates by segment and campus. (The CCC Chancellor’s Office already operates a system‑level data system that reports earnings gains of recent graduates by program.) Another possible measure could track income mobility by segment and campus. A recent national study, for instance, has investigated the extent to which particular colleges and universities in the country serve students from lower‑income brackets who, over time, move into higher‑income brackets. We recommend the Legislature direct the three public higher education segments to report at spring budget hearings on potential measures of graduates’ outcomes, including the feasibility of adding an earnings or income mobility indicator.
Back to the TopUniversity of California
In this section, we provide an overview of UC’s budget, describe UC’s spending plan, assess that plan, and make associated recommendations. At the end of the section, we summarize UC’s new capital outlay requests.
Overview
Governor’s Budget Proposes Nearly $33 Billion From All Sources for UC in 2017‑18. As Figure 10 shows, UC’s total budget would increase by $839 million (2.6 percent) over the 2016‑17 level. About one‑quarter ($8.4 billion) of UC’s total funding consists of “core funds” (primarily state General Fund and student tuition revenue) that support the university’s undergraduate and graduate education programs. Core funding would increase by $191 million (2.3 percent). The remainder of UC funding comes primarily from its five medical centers, sales and services (including housing, bookstores, and academic extension), and the federal government (primarily for research and financial aid).
Figure 10
University of California Funding by Source
(Dollars in Millions)
|
2015‑16 Actual |
2016‑17 Revised |
2017‑18 Proposed |
Change Over 2016‑17 |
||
|
Amount |
Percent |
||||
|
Core Funds |
|||||
|
General Fund—ongoing |
$3,135 |
$3,279 |
$3,362 |
$83 |
2.5% |
|
General Fund—one time |
124 |
262 |
169 |
‑93 |
‑35.0 |
|
Subtotals |
($3,259) |
($3,541) |
($3,531) |
(‑$10) |
(‑0.3%) |
|
Resident tuition and fees |
$3,211 |
$3,371 |
$3,449 |
$78 |
2.3% |
|
Nonresident supplemental tuition |
833 |
976 |
1,050 |
74 |
7.6 |
|
Subtotals |
($4,044) |
($4,347) |
($4,499) |
($152) |
(3.5%) |
|
Lottery |
$38 |
$36 |
$36 |
— |
— |
|
Othera |
318 |
286 |
334 |
$49 |
17.1% |
|
Totals—Core Funds |
$7,660 |
$8,209 |
$8,401 |
$191 |
2.3% |
|
Other Funds |
|||||
|
Medical centers |
$9,467 |
$9,751 |
$10,044 |
$293 |
3.0% |
|
Sales and services |
6,045 |
6,308 |
6,497 |
189 |
3.0 |
|
Federal |
3,920 |
3,994 |
3,988 |
‑6 |
‑0.2 |
|
Privateb |
2,055 |
2,149 |
2,234 |
85 |
4.0 |
|
State special funds |
26 |
59 |
106 |
47 |
80.0 |
|
Other |
1,400 |
1,451 |
1,490 |
40 |
2.7 |
|
Totals |
$22,913 |
$23,711 |
$24,359 |
$648 |
2.7% |
|
Grand Totals |
$30,573 |
$31,921 |
$32,760 |
$839 |
2.6% |
|
aIncludes a portion of overhead funding on federal and state grants and a portion of patent royalty income. Also includes $50 million in funding freed up for core purposes by Proposition 56 funds. bConsists of private gifts and endowment earnings. |
|||||
Governor’s Budget Proposes $3.5 Billion General Fund Support for UC in 2017‑18. Figure 11 shows the proposed General Fund changes to UC’s budget in 2017‑18. The budget contains an $81 million (2.5 percent) unrestricted ongoing base increase and a $2 million ongoing increase for a specified medical program originally funded in the 2015‑16 budget. In addition, the Governor proposes to provide $169 million one time to help UC pay down its unfunded pension liability. The state provided $262 million in one‑time funding to UC in 2016‑17, including $171 million for the system’s pension liabilities. After factoring in all these adjustments, UC’s total General Fund appropriation would decline by $10 million (0.3 percent).
Figure 11
2017‑18 University of California General Fund Changes
(In Millions)
|
2016‑17 Revised Funding |
$3,541 |
|
Pay down unfunded pension liability (one time) |
$169 |
|
Provide unrestricted base increase (ongoing) |
81 |
|
Resume funding for medical education program (ongoing) |
2 |
|
Remove prior‑year one‑time funding |
‑262 |
|
Total Changes |
‑$10 |
|
2017‑18 Proposed Funding |
$3,531 |
Governor’s Budget Also Redirects $50 Million Freed Up From Proposition 56 Funds. Approved by voters in November 2016, Proposition 56 imposes new taxes on tobacco products and specifies the use of the resulting revenue. Among its numerous provisions, the law requires the state to allocate funding to UC for graduate medical education. To implement this provision, the Governor proposes to designate $50 million in Proposition 56 funding for graduate medical education and free up a like amount of existing state General Fund for other UC priorities. Under the proposal, the mix of funding for graduate medical education would change, but the overall funding level for graduate medical education would remain the same. The Governor describes the ultimate effect of this fund swap as providing the university with a total unrestricted base augmentation of $131 million (4 percent) in the budget year. The nearby box provides further information on UC‑related provisions in Proposition 56.
Proposition 56 Allocations to UC
Proposition 56 includes funding for two UC purposes, as described below.
Graduate Medical Education. The measure specifies that $40 million in Proposition 56 tax revenue is to go to UC for graduate medical education. Specifically, the measure indicates the funds are to “sustain, retain, and expand graduate medical education programs.” The measure further specifies that the funds are “for the purpose and goal of increasing the number of primary care and emergency physicians trained in California.” To this end, the measure requires UC to assess annually whether there are regional or statewide shortages of physicians for specific specialties (such as surgery or neurology). To the extent a demonstrated shortage of specialty physicians exists, UC may use funding to expand graduate medical education programs in those specialty areas. The measure does not explicitly prohibit UC from swapping out existing funding for graduate medical education with Proposition 56 funds. (Because the measure does not take effect until April 2017, UC would receive $10 million in 2016‑17. The Governor proposes carrying forward this amount, for total funding of $50 million in 2017‑18.)
Tobacco‑Related Disease Research. After covering various specified costs under the measure, Proposition 56 designates 5 percent of remaining tax proceeds be given to UC for tobacco‑related disease research. Prior to Proposition 56, some tax proceeds on tobacco products already were directed to tobacco‑related disease research administered by UC (which, in turn, provides grants to researchers throughout the state). Proposition 56 augments funding for this research. In 2017‑18, the Governor budget’s includes $81 million in Proposition 56 funds for this purpose. (Similar to the other UC‑related item, this amount includes an estimated $16 million carried forward from 2016‑17.) Unlike its provision for graduate medical education, Proposition 56 expressly prohibits UC from using this funding to supplant existing tobacco‑related disease research funding.
Governor’s Budget Assumes UC Will Receive $18.5 Million in 2016‑17 for Enrollment Growth in 2017‑18. The 2016‑17 Budget Act provides $18.5 million for UC to enroll 2,500 more resident undergraduate students in 2017‑18, a 1.4 percent increase over the estimated 2016‑17 level. To receive this funding, UC must meet two requirements by May 1, 2017: (1) provide evidence that it is on track to meet this enrollment expectation and (2) adopt a policy that limits nonresident enrollment. The Department of Finance assumes UC will meet these requirements and includes release of the enrollment funding as part of its budget plan. Because the amount provided in 2016‑17 would be released to UC in May or June 2017, UC intends to carry forward this amount into 2017‑18.
Governor’s Budget Does Not Assume Resident Tuition Increases. Though the administration does not assume tuition increases for resident students, the budget reflects 5 percent increases in both the Student Services Fee (charged to all students) and the undergraduate nonresident supplemental tuition charge. Coupled with assumptions about enrollment growth in 2017‑18, the budget assumes associated year‑over‑year increases of $152 million from tuition and fees.
UC Has Identified Additional Funding It Plans to Use in 2017‑18. Beyond the $191 million increase in core funding recognized in the Governor’s budget, UC has identified an additional $114 million as available in 2017‑18. Of the $114 million, $74 million is associated with tuition increases. In January 2017, the Board of Regents approved increases in resident tuition charges. Under this action, students will pay $11,502 in tuition in 2017‑18, a $282 (2.5 percent) increase over the 2016‑17 level. The board also identified $40 million in savings and redirected revenues. Specifically, UC indicates this funding consists of: (1) $14 million from phasing out financial aid for nonresident students, (2) $10 million in philanthropic donations, (3) $8 million in savings from improved procurement practices, (4) $5 million in savings from self‑insuring for certain risks, and (5) $3 million in new revenue from increased investment returns. Except for phasing out nonresident aid, which the state called for in the 2015‑16 budget, the revenues are the result of UC initiatives.
UC’s Spending Plan
In January 2017, the Regents adopted a core budget plan for 2017‑18. The plan incorporates the Governor’s General Fund proposal, as well as other core funds (including proposed tuition increases, nonresident enrollment growth, and savings) available for the university system to spend. After factoring in all of these available revenues, UC plans to increase ongoing spending by $412 million in 2017‑18. Figure 12 displays the elements of the plan. We describe each element below.
Figure 12
UC’s Spending Plan for 2017‑18a
(In Millions)
|
Increase |
|
|
Compensation |
|
|
General salary increasesb |
$112 |
|
Faculty merit increases |
32 |
|
Health benefit cost increases |
19 |
|
Pension cost increases |
18 |
|
Retiree health benefit cost increases |
8 |
|
Subtotal |
($189) |
|
Undergraduate Enrollment Growth |
|
|
Resident students (1.4 percent) |
$45 |
|
Nonresident students (3 percent) |
16 |
|
Subtotal |
($62) |
|
Academic Excellence |
$50 |
|
Financial Aid |
$49 |
|
Facilities |
|
|
Deferred maintenance |
$15 |
|
Debt service for previously approved projects |
15 |
|
Subtotal |
($30) |
|
Other |
|
|
Operating expenses and equipment |
$27 |
|
Student mental health |
5 |
|
Subtotal |
($32) |
|
Total |
$412 |
|
aExcludes spending items that assumed additional state funding above the Governor’s proposal. bIncludes a 3 percent increase for faculty and unrepresented staff and a 3.9 percent increase for represented staff. |
|
Designates $189 Million for Compensation Cost Increases. Nearly half of UC’s spending plan is for employee compensation increases. Of the total proposed compensation increase, $112 million would provide a 3.2 percent general salary increase for faculty and staff. In addition to this general salary increase, UC budgets $32 million to provide merit salary increases for tenure‑track faculty. UC also recognizes increases in health benefit and pension costs.
Builds In $62 Million for Resident and Nonresident Enrollment Growth. Consistent with state expectations, UC plans to spend $45 million to enroll 2,500 more resident undergraduate students in 2017‑18. Spending on resident enrollment growth is based on the marginal cost of education, which UC calculates to be $18,146 in 2017‑18. UC plans to spend an additional $16 million to enroll 1,000 (3 percent) more nonresident undergraduate students in 2017‑18. Nonresident enrollment growth would be funded from the base tuition charged to these students as well as a portion of nonresident supplemental tuition revenue.
Provides $50 Million for UC’s Academic Excellence Initiative. This proposal would continue past initiatives by UC to enhance funding for its instructional and research programs. Similar to these past initiatives, campuses would have discretion to set their own priorities for these monies. UC anticipates campuses would use the funds for a broad range of purposes, including reducing the student‑faculty ratio at certain campuses, providing additional start‑up research funding for new faculty, increasing stipends for graduate students, better maintaining facilities, and replacing more equipment.
Increases Financial Aid by $49 Million. Consistent with longstanding practice, UC plans to increase financial aid spending by redirecting a portion of tuition revenue to need‑based institutional aid. This increase is derived from (1) $26 million from tuition increases, (2) $18 million from increased tuition revenues generated from enrollment growth, and (3) $5 million from the Student Services Fee increase.
Augments Facility Spending by $30 Million. UC proposes spending $15 million on deferred maintenance projects. The university system also plans to spend $15 million to cover debt service payments on previously approved capital outlay projects.
Provides $27 Millionfor Operating Expenses and Equipment. UC annually budgets for various cost increases that are separate from employee compensation, such as instructional equipment, library materials, and utilities. In 2017‑18, UC estimates spending about $27 million (2.5 percent) more on these costs.
Provides $5 Million for Student Mental Health. In 2015‑16, UC adopted a plan to allocate a portion of Student Services Fee revenue to augment mental health services for students. In 2017‑18, UC anticipates a $4.6 million increase for this program.
Back to the TopAssessment
UC’s Spending Plan Raises Several Issues for the Legislature. We think the Governor’s funding plan and UC’s spending plan is a mixed bag, with some components more warranted than other components. Below, we provide our assessment of several key budget components—compensation, resident enrollment, nonresident enrollment, and academic excellence. (We assess the Governor’s Proposition 56 funding proposal, including his proposal regarding graduate medical education, in a separate publication.)
Compensation
Employee Compensation Is UC’s Largest Expense. Similar to most state agencies, employee compensation is UC’s largest cost, accounting for over 80 percent of its core budget. Employees funded from UC’s core budget include faculty, staff, and administrators.
State Has Taken Interest in UC Pension Policies. Over the past two years, the state has provided UC $267 million to help pay down the university system’s unfunded pension liability. As a condition of receiving this funding, the state required UC to adopt a lower pensionable salary limit for new employees than the limit under UC’s retirement program at the time. UC adopted the lower limit ($117,020, down from $265,000) in March 2016. UC redirected the associated savings to develop new defined contribution plans and accelerate the paydown of UC’s unfunded pension liability.
Evidence Suggests Compensation at UC Is Competitive. Past reviews of UC employment data, such as our December 2012 report, Faculty Recruitment and Retention at the University of California, have found that UC generally has been successful at recruiting top‑choice candidates and retaining faculty. More recent data suggest that UC continues to offer faculty highly competitive compensation packages. Figure 13 shows that fully tenured professors at nearly every UC campus earn higher salaries than their peers at other public universities with a similar level of research activity. As a system, UC also pays generally higher salaries for other faculty categories (such as associate professors, assistant professors, and lecturers). Certain pressures might be driving higher faculty salaries at UC. Most notably, some UC campuses compete with wealthy private universities, such as Yale or Stanford, for faculty. The higher cost of living in California relative to the rest of the country also might contribute to higher salaries.
Resident Enrollment
State’s Recent Approach to Setting UC’s Enrollment Targets Better Than Former Approach. Traditionally, the state budget has set resident enrollment targets for the budget year. This approach does not align well with UC’s admissions calendar, as UC makes most admission decisions for the coming fall term (when the vast majority of its incoming students start) in the early spring, prior to the enactment of the state budget in June. This means the state budget is enacted too late to influence UC’s fall admissions decisions. Recognizing this fact, the previous two state budgets (in 2015‑16 and 2016‑17) both have set enrollment targets one year after the budget year.
Recommend Legislature Continue Practice of Setting Targets One Year Out, but Allocate Associated Funding in That Year. We recommend the Legislature continue its recent approach and set enrollment expectations now for 2018‑19. Though we recommend setting the 2018‑19 target now, we recommend not funding the enrollment until needed (in 2018‑19). Specifically, we recommend the Legislature schedule funding for 2018‑19 in this year’s trailer legislation, rather than appropriating the monies in the 2017‑18 budget act. To ensure UC complies with the state’s enrollment expectation, we recommend the Legislature further specify in the trailer legislation that a certain portion of funding would revert to the state if UC falls below the target by a certain margin (for example, 10 percent).
Use Updated Information From March Report to Help Make Decision on Target for 2018‑19. We withhold making a recommendation on the exact amount of new resident enrollment to fund in 2018‑19 pending the Legislature’s receipt and review of (1) UC’s upcoming March bachelor degree production report and (2) the upcoming freshman eligibility study. Both reports will provide information that could inform the Legislature’s enrollment decisions for 2018‑19.
Nonresident Enrollment
Recent Concerns Regarding Nonresident Enrollment Growth at UC. Nonresident enrollment at UC has substantially increased in recent years. This increase has prompted concerns that nonresident students are displacing resident students across the system and at certain campuses. In response to this concern, the 2016‑17 budget requires UC to adopt a policy by May 1, 2017 that limits nonresident enrollment as a condition of receiving funding for resident enrollment growth.
Many Different Options for a Nonresident Policy. The 2016‑17 budget does not specify an exact policy regarding nonresident enrollment, instead giving UC flexibility to design it. UC has various choices to make in designing such a policy. These choices include: (1) whether to set a systemwide limit or a limit at each campus, (2) whether to set a proportionate limit (allowing the number of nonresident students to grow with resident students) or an absolute limit (setting a ceiling regardless of the number of residents), and (3) whether to set separate limits for nonresident undergraduate and graduate students.
Recommend Legislature Require UC to Report at Spring Budget Hearing. We recommend the Legislature direct UC to report during a spring budget hearing on (1) its proposed nonresident enrollment policy and (2) how its proposed nonresident enrollment growth for 2017‑18 aligns with this policy.
Academic Excellence
Program Lacks Clear Objectives. UC’s spending plan contains little detail on how the proposed $50 million for its Academic Excellence initiative would be spent. Without clearer objectives, we are concerned the initiative might not achieve legislative priorities. Furthermore, without clearly defined objectives, UC may continue to request additional funding for this program in future years without gauging whether the funding was accomplishing its purposes.
Recommend Legislature Reject Proposal Unless Stronger Justification Provided. Given these concerns, we recommend the Legislature require UC to report at a spring budget hearing on its Academic Excellence initiative. As part of the hearing, we recommend the Legislature direct UC to identify (1) the specific objectives of the initiative, (2) how progress toward those objectives will be measured and evaluated, and (3) the specific use of the proposed funds. If UC is unable to provide sufficient justification for this program, we recommend the Legislature redirect the associated funding to a higher priority.
Weighing State Funding Increases With Tuition Increases
Key Issue Will Be How to Pay for Cost Increases. After deciding what spending increases to support, the Legislature will want to consider how to cover these cost increases. If the Legislature supports UC’s spending plan and does not wish for students to pay more for their instruction, it could augment the Governor’s General Fund proposal and direct UC to hold resident tuition flat in 2017‑18. Alternatively, if the Legislature believes students should contribute to any approved spending increases beyond the Governor’s General Fund proposal, it could support the Regents’ tuition and fee increases.
Two Related Issues Affect UC’s Core Budget. Two other legislative decisions could affect funding for UC’s core budget in the coming year. The first decision concerns the Legislature’s goals for nonresident enrollment at UC. Were the Legislature to decide that UC should not proceed with enrolling more nonresident students in 2017‑18, the university would receive $19 million less in net funding. The second decision regards the Legislature’s goals for Proposition 56. Under the Governor’s approach, UC would supplant existing graduate medical education funding with Proposition 56 revenues, holding constant current medical residency slots. If the Legislature instead wishes to use Proposition 56 funds to expand medical residency slots, UC would have $50 million less in core funding than under the Governor’s proposal. Without associated adjustments to spending priorities, the Legislature likely would need to fund its desired spending level with additional state funding or tuition increases.
UC’s Capital Outlay Request
Under the state’s new capital outlay process for UC and CSU, each university system has the authority to use its main General Fund appropriation to service debt on bonds for academic facilities. Prior to funding, the segments must submit their academic facility projects for state review and approval. Under the new process, the Legislature has from February 1 to April 1 to review projects, with the Department of Finance finalizing project decisions by April 1. For 2017‑18, UC is requesting $161 million in bond fund authority for capital outlay and deferred maintenance projects. We summarize these projects below.
Proposes $111 Million for Seven Capital Outlay Projects in 2017‑18. Six projects (totaling $61 million in state funding) would correct seismic and life safety deficiencies for specific academic facilities, and one project (associated with $50 million in state funding) would entail constructing a new science facility at the Irvine campus. In addition to state funding, UC anticipates spending $103 million in nonstate funds on these projects. Figure 14 shows the seven proposed projects.
Figure 14
UC’s 2017‑18 Capital Outlay Request
(In Millions)
|
Project Classification |
Project Description |
Project Phase |
2017‑18 |
|
|
State Costs |
Non‑State Funds |
|||
|
Irvine |
||||
|
Program Expansion |
Construct new science facility to accommodate enrollment growth in three academic departments. |
D/C |
$50 |
$69 |
|
Los Angeles |
||||
|
Seismic and fire safety |
Correct seismic deficiencies and provide new fire safety system in one facility |
C |
25 |
21 |
|
Seismic safety |
Correct seismic deficiencies at the Neuropsychiatric Institute |
C |
25 |
13 |
|
San Francisco |
||||
|
Life safety |
Correct exit barriers at one facility |
D/C |
3 |
— |
|
Berkeley |
||||
|
Seismic safety |
Reinforce seismic support structures to historic facility. |
P/W |
3 |
— |
|
Demolition |
Demolish vacant and seismically deficient facility. |
W/C |
3 |
— |
|
Seismic safety |
Develop renovation and seismic correction plan for two facilities |
P |
2 |
— |
|
D = design; C = construction; P = preliminary plans; and W = working drawings. |
||||
Proposes $50 Million for Deferred Maintenance. In addition to these seven projects, UC requests authority to use $50 million in bond funding for deferred maintenance. (This deferred maintenance request is separate from the $15 million pay‑as‑you‑go proposal described earlier.) Of the $50 million, $15 million would fund a team of experts to visit each campus and assess the current condition of academic facilities. The goal of the program would be to provide a more accurate estimate of the system’s total deferred maintenance backlog and prioritize each facility according to its current condition, likelihood of failure, and life‑safety risk. UC estimates the assessment will take up to three years to complete. The remaining $35 million would fund deferred maintenance projects.
Unclear Why UC Does Not Regularly Assess Condition of Facilities. Having an understanding of the condition of facilities, building systems, and infrastructure obviously is important and would help in developing a more accurate estimate of UC’s maintenance backlog. UC’s proposal to conduct a facilities condition assessment, however, raises three concerns. First, it is unclear why UC could not produce such an estimate using staff in existing plant and facility divisions. Knowing facility conditions and system life spans seems a key responsibility of these divisions. Second, UC has not explained how it plans to continue monitoring its facilities upon completion of the comprehensive assessment. Without continued monitoring, UC’s one‑time assessment soon would become outdated. Third, we question the wisdom of using bonds, which are intended to spread major infrastructure costs over many years, for a one‑time facility assessment. Absent much stronger justification for the one‑time assessment, we recommend the Legislature encourage UC to direct the $15 million into maintenance projects.
Segment Lacks Plan to Eliminate Backlog and Improve Ongoing Maintenance Practices. UC would benefit from: (1) a long‑term funding plan to retire its backlog, and (2) a review of its current scheduled maintenance practices (such as setting funds aside when new systems are installed) so as to avoid the re‑emergence of future maintenance backlogs. Without both plans in place, the Legislature cannot have confidence that UC’s capital program is being well managed and maintained.
Recommend Legislature Require UC to Develop More Comprehensive Maintenance Plan. To address these concerns, we recommend the Legislature require UC (either through budget or supplemental reporting language) to develop a long‑term maintenance plan. This plan should include (1) an estimate of the backlog based upon available data; (2) a multiyear expenditure plan for eliminating the backlog of projects, including proposed funding sources; and (3) a plan for how to avoid developing a maintenance backlog in the future.
Back to the TopCalifornia State University
In this section, we provide an overview of the Governor’s proposed budget for CSU, describe CSU’s proposed spending plan, and assess key components of that plan.
Overview
CSU’s Budget Proposed to Reach $10 Billion From All Sources in 2017‑18. As Figure 15 shows, CSU’s budget would increase by $182 million (1.8 percent) over revised 2016‑17 levels. Of total CSU funding, about two‑thirds ($6.7 billion in 2017‑18) comes from core funds—a combination of state General Fund, state lottery, and student tuition and fee revenue. These three fund sources, which would increase by a combined $126 million (1.9 percent) in the budget year, supporting CSU’s core mission of providing undergraduate and graduate education. CSU also receives federal funds and operates various campus enterprises, such as student dormitories and parking facilities. The remainder of CSU’s revenues ($3.3 billion in 2017‑18) mostly supports these other operations.
Figure 15
California State University Funding by Source
(Dollars in Millions)
|
2015‑16 Actual |
2016‑17 Revised |
2017‑18 Proposed |
Change From 2016‑17 |
||
|
Amount |
Percent |
||||
|
Core Funds |
|||||
|
General Fund |
|||||
|
Ongoinga |
$3,271 |
$3,479 |
$3,714 |
$235 |
6.8% |
|
One time |
5 |
110 |
1 |
‑109 |
‑99 |
|
Subtotals |
($3,276) |
($3,589) |
($3,715) |
($126) |
(3.5%) |
|
Lottery |
$58 |
$55 |
$55 |
— |
— |
|
Tuition and feesb |
3,022 |
2,963 |
2,963 |
— |
— |
|
Subtotals, Core Funds |
($6,357) |
($6,607) |
($6,733) |
($126) |
(1.9%) |
|
Other Funds |
|||||
|
Federal funds |
$1,256 |
$1,385 |
$1,385 |
— |
— |
|
Other CSU fundsc |
2,104 |
1,844 |
1,899 |
$55 |
3.0% |
|
Subtotals |
($3,360) |
($3,228) |
($3,284) |
($55) |
(1.7%) |
|
Totals |
$9,717 |
$9,835 |
$10,017 |
$182 |
1.8% |
|
aIncludes CSU debt service on general obligation and lease‑revenue bonds and funds for pensions and retiree health benefits. bIncludes funds that CSU uses to provide tuition discounts and waivers to certain students. In 2017‑18, CSU plans to provide $662 million in such aid. cIncludes funds such as housing fees, parking fees, and extended education charges. |
|||||
Governor’s Budget Proposes $3.7 Billion in General Fund Support for CSU. Under the Governor’s budget, ongoing General Fund support for CSU would increase by $235 million (6.8 percent) over 2016‑17 levels. This increase is offset by $109 million in expiring one‑time funds provided to CSU in 2016‑17. Altogether, General Fund support for CSU would increase a net of $126 million (3.5 percent).
Most of CSU’s General Fund Augmentation Unrestricted. Figure 16 details General Fund changes for CSU under the Governor’s budget. As the figure shows, the Governor proposes a $157 million ongoing unrestricted increase. This funding is a continuation of the Governor’s original long‑term plan for the universities, which since 2013‑14 has sought to provide annual unallocated base increases. In addition, the Governor’s budget provides a total of $78 million in earmarked augmentations. Specifically, the budget proposes (1) $50 million for increased pension costs, (2) $23 million for higher retiree health care costs, and (3) $5 million for higher lease‑revenue debt service for previously approved capital projects. (In an effort to encourage CSU to consider pension costs as part of its new hiring and salary decisions, the state changed how it budgeted for CSU pension costs a few years ago. Under the new policy, the state provides direct funding for CSU’s pension costs attributed to its 2013‑14 payroll level, but CSU is responsible for funding any additional pension costs using its unrestricted funds.) The Governor’s budget does not directly fund enrollment growth.
Figure 16
2017‑18 California State University General Fund Changes
(In Millions)
|
2016‑17 Revised Funding |
$3,589 |
|
Unrestricted base increases: |
|
|
Funding per Governor’s original long‑term plan |
$131 |
|
Redirected savings from Middle Class Scholarship modifications |
26 |
|
Subtotal |
($157)a |
|
Pension adjustment |
$50 |
|
Retiree health benefits adjustment |
23 |
|
Lease‑revenue bond debt service adjustment |
5 |
|
Remove one‑time funding provided in prior year |
‑87 |
|
Other adjustments |
‑21 |
|
Total Changes |
$126 |
|
2017‑18 Proposed Funding |
$3,715 |
|
aCSU indicates that it would use these funds to cover recently ratified bargaining agreements ($139 million) and various other cost increases ($18 million). |
|
Governor’s Budget Does Not Assume Tuition Revenue Increases. The Governor’s budget assumes that CSU does not raise its tuition charges. Unlike recent years, however, the Governor does not condition his proposed General Fund increases on CSU holding resident tuition levels flat.
CSU’s Spending Plan
CSU Proposes to Spend the Vast Majority of Its Unrestricted Base Increase on Compensation Commitments. Of the $157 million unrestricted base increase proposed by the Governor for 2017‑18, CSU indicates that it intends to spend $139 million (88 percent) for collective bargaining agreements ratified by the CSU Board of Trustees in spring 2016. CSU indicates that the remaining $18 million would fund basic cost increases, such as higher medical and dental premiums for current employees and additional pension costs (on payroll exceeding the 2013‑14 level).
CSU Proposes to Support 12 Previously Approved Capital Projects. CSU’s 2017‑18 capital outlay request includes 27 projects totaling $1.6 billion. Of these 27 projects, 17 were previously approved by the state (virtually all of them as part of the 2016‑17 budget process) but have not yet been funded by CSU. The other ten requests are new submissions. At its November 2016 meeting, the Board of Trustees approved a multi‑year plan for CSU to finance up to $1 billion of the $1.6 billion in submitted capital projects using university revenue bonds. Using this bond authority, the Chancellor’s Office would fund 12 of the previously approved capital projects. The associated annual debt service is estimated to be about $50 million.
CSU Proposes Using Existing Funds for Projects. CSU indicates it would support this associated debt service using existing core funds. This is possible because a like amount of monies were “freed up” from expiring debt from former projects as well as restructuring of outstanding State Public Works Board debt. (Under recent changes in state law, CSU is permitted to pledge its General Fund main appropriation—excluding the amounts necessary to repay existing debt service—to issue its own debt for capital outlay projects involving academic facilities.) The CSU estimates that the first $200 million in CSU revenue bond proceeds would provide $35 million for new facility space at CSU Monterey Bay as well as $165 million for building replacements and renovations to facilities and infrastructure at most campuses in the system.
CSU Indicates It Would Not Be Able to Fund Several Other Priorities Under Governor’s Budget. Due to the size of the employee contract costs that CSU is committed to funding in 2017‑18, CSU indicates that the augmentation provided in the Governor’s budget is insufficient to address other budget priorities. These priorities include enrollment growth, additional targeted funding for the segment’s Graduation Initiative, and a compensation pool for represented employee groups that have open contracts in 2017‑18 (as well as nonrepresented employees, such as administrative managers).
CSU Considering a Tuition Hike to Boost Funding Primarily for Graduation Initiative. Given that CSU believes the funding included in the Governor’s Budget is insufficient to address all of its budget priorities, CSU is considering a tuition increase. Under the proposal discussed by the Board of Trustees at its January meeting, tuition for resident undergraduates would increase by 4.9 percent. Tuition for nonresidents and resident graduate students would increase by about 6.5 percent. The proposed increase would generate $78 million in additional net revenue, which CSU officials have indicated would be used primarily to augment funding for the Graduation Initiative. The Board of Trustees likely will vote on the tuition proposal at its March 2017 meeting.
Assessment
CSU’s Spending Plan Raises Several Issues for the Legislature. We think the Governor’s funding plan and CSU’s spending plan is a mixed bag, with some components more warranted than other components. Below, we provide our assessment of several key budget components—compensation, enrollment growth, and the Graduation Initiative. In the final part of this section, we consider the trade‑offs between additional state funding increases and student tuition increases.
Compensation
Compensation Is the Largest Component of CSU’s Core Budget. Like other departments and agencies, salaries and benefits make up a significant share of CSU’s core budget (more than 80 percent). As noted earlier, compensation also accounts for the largest augmentation in CSU’s spending plan, with almost all unrestricted state General Fund allocated for compensation increases. The Legislature has several compensation‑related issues to consider.
Board of Trustees, Not the Legislature, Approves CSU Collective Bargaining Agreements. For most departments and agencies in the state, the California Department of Human Resources represents the Governor in labor negotiations between the state and its employees. The resulting agreements must be ratified by the Legislature before going into effect and the state directly funds the associated costs of the agreements. In the case of CSU, state law gives the Board of Trustees authority to negotiate collective bargaining agreements. The Chancellor’s Office represents the Trustees during these negotiations and the resulting agreements must be ratified by the Trustees before going into effect. The Trustees are expected to manage these agreements within CSU’s overall budget.
Trustees Recently Approved Sizeable Collective Bargaining Agreements. The CSU system has 13 represented employee groups. The largest group is the California Faculty Association (CFA), which represents more than 25,000 CSU faculty, librarians, counselors, and coaches. After extensive negotiations with CFA (and a near‑strike by union members), in spring 2016 the Trustees ratified a multiyear contract. Under the agreement, all faculty unit employees receive a cumulative 10.8 percent general salary increase effectively over a two‑year period and eligible faculty unit employees receive an additional 2.7 percent increase in 2017‑18. Ratification of the CFA contract triggered revised agreements with several other CSU bargaining units, which resulted in general salary increases for those members. Altogether, the Chancellor’s Office estimates these new contracts will cost CSU an additional $139 million in 2017‑18.
Virtually All Other CSU Bargaining Units Have Open Contracts in 2017‑18. With a few exceptions, CSU’s contracts with its other represented employee groups expire at the end of 2016‑17. The Chancellor’s Office has expressed a desire to provide funds for 2017‑18 to support a compensation pool for these represented groups, as well as nonrepresented employees. The Chancellor’s Office calculates that every 1 percent increase for such a compensation pool would cost $18 million. Were the Legislature to want compensation to keep pace with inflation year over year, it might consider increases between 1 percent and 3 percent. (In 2017‑18, the state and local government price index is expected to increase 1.1 percent, whereas the California Consumer Price Index is expected to increase by 3 percent.) Were CSU to increase tuition levels in 2017‑18, some or all of the resulting revenue could be dedicated to the desired level of compensation increases.
Enrollment Growth
CSU on Track to Meet Enrollment Target for 2016‑17. The 2016‑17 Budget Act sets an expectation for CSU to increase resident enrollment by 1.4 percent (an additional 5,194 FTE students) over 2015‑16. Based on preliminary enrollment data provided by CSU, campuses appear to be on track to meeting this target, with fall 2016 FTE student enrollment about 1.3 percent higher than the previous fall.
Several Factors for Legislature to Consider in Deciding Whether to Grow Transfer Enrollment in 2017‑18. The past several years CSU has reported denying admission to some eligible transfer students. Given this development, together with statute that requires CSU campuses to prioritize eligible transfer applicants over freshman applicants, the Legislature may want to consider targeting enrollment growth funding for transfer students in 2017‑18. Every 1 percent growth in transfer enrollment would result in about 3,600 more FTE students—for a total cost of $38 million ($20 million state General Fund and $18 million in tuition revenue generated by the additional students).
Could Withhold Decision on Freshman Enrollment Growth Until May. Existing data suggests CSU is drawing from beyond its freshman eligibility pool. Given that a freshman eligibility study is currently underway and that CSU must report by March 2017 on recommended budget or policy changes to produce more bachelor’s degrees, the Legislature may wish to wait until the May Revision before deciding on enrollment growth funding for freshmen. Regarding potential changes to its policy on the size of CSU’s freshman eligibility pool, we encourage the Legislature to take time to explore the potential consequences of any specific proposal. Any change to this pool would have significant fiscal and programmatic implications moving forward not only for CSU but also CCC, UC, and the state.
Graduation Initiative
CSU Has Set Ambitious Performance Targets. As noted earlier, the state and CSU currently are funding a Graduation Initiative. The goals of this initiative, which was originally launched by the Chancellor’s Office in 2009, are to boost graduation rates for freshmen and transfer students as well as eliminate achievement gaps for low‑income and other traditionally underrepresented students. For example, CSU seeks to more than double its four‑year graduation rate (for all entering freshmen) between now and 2025, moving from its current rate of 19 percent to 40 percent.
CSU Implementing Various Improvement Strategies as Part of Graduation Initiative. These strategies include hiring more faculty and increasing the faculty‑to‑student ratio, encouraging faculty to adopt new instructional methods, and providing enhanced student support services such as tutoring and advising. CSU reports spending $48 million in base funds on these Graduation Initiative strategies. CSU maintains it will need additional resources to carry out campus plans and achieve the segment’s performance goals. CSU has not undertaken a systematic evaluation to assess the impact each of these strategies is having on its graduation rates.
CSU Has Much More Work to Do on Rethinking Assessment and Placement Policies. Though the above strategies may be helping more students graduate and graduate on time, we believe CSU could be doing more to promote better student outcomes. Specifically, we think CSU could improve its assessment and placement policies. Currently, CSU primarily uses placement tests to assess college readiness. Based on these test results, CSU deems more than 40 percent of its admitted freshmen as unprepared for college‑level math, English, or both. Students who do not demonstrate college‑level skills are required to enroll in remedial coursework. National research has shown that relying solely on placement tests routinely results in college‑ready students being misplaced into remedial courses, which, in turn, increases education costs for them and the state while also reducing their chances of graduating on time. (Data from the Community College Research Center and CCC system reinforce these findings, with their data indicating about 30 percent of incoming community college students are put into remedial courses based on placement test results when they could have succeeded in college‑level coursework.) A growing amount of research is finding that a better way to assess college readiness is to use multiple measures (including data from students’ high school records) to place students.
Secondary Assessments Are Exacerbating Inefficiencies. Additionally, a number of CSU campuses currently have policies requiring even students who are deemed college ready in math to take a second diagnostic (department) test in order to enroll in many lower‑division math courses (such as calculus and college‑level algebra). Students who fail to obtain a specified cut score on these department exams may be required to enroll in precollegiate‑level courses (such as intermediate algebra), thereby delaying their progress toward a degree. These secondary diagnostic tests also are at odds with national research on effective ways to identify students who are capable of success in college‑level coursework.
CSU Also Continues to Have Problem With Students Taking Excess Units. CSU continues to have a problem with excess unit‑taking by both freshman entrants and transfer students. Students who accrue more units that their degree requires generally take longer to graduate, generate higher costs for the state and themselves, and crowd out other students. Based on the experience of other institutions, a number of causes may be contributing to CSU’s high rate of excess units, including unclear degree pathways for students and uneven articulation of lower‑division transfer courses between community colleges and CSU. Were CSU to reduce excess course‑taking, it could increase the availability of required courses within existing resources.
Recommend CSU Implement Other Strategies Before Augmenting Funding for Graduation Initiative. To date, CSU has made progress on improving student outcomes. We believe CSU would make even more progress were it to modify its assessment methods and placement policies as well as address the issue of excess units. To this end, we recommend the Legislature direct CSU to study these issues in more depth and, based on its findings, implement new policies using existing Graduation Initiative monies and other system resources. So that the Legislature is kept apprised of CSU’s activities, we recommend the Legislature require the segment to report by January 1, 2018 on (1) its plans to put in place research‑based methods for assessment and placement, as well as (2) opportunities for campuses to make available more course slots by reducing the number of excess units that students earn. Given these opportunities for further reform and given the many other competing cost pressures facing CSU in the budget year, the Legislature may wish to place a lower priority on providing additional funding for the Graduation Initiative in 2017‑18.
Weighing State Funding Increases With Tuition Increases
Legislature Has Key Choices to Make on CSU’s Budget. Each year, the Legislature fundamentally decides: (1) which costs to fund and (2) how these costs should be shared between students (and their families) and the state. In some years, the Legislature has decided to cover all CSU spending increases using state General Fund, holding student tuition levels flat. Other years, both General Fund support and tuition levels have increased to cover cost increases. (In still other years, state support has declined, with tuition levels rising to cover costs.)
CSU Facing Four Notable Cost Pressures. Most notably, CSU faces the pressure to fund the collective bargaining agreements already ratified by the Board of Trustees last spring. It also faces pressure to cover basic cost increases (for example, health care and pension cost increases). Given that CSU continues to report denying admission to eligible transfer students, another notable cost pressure is funding enrollment growth for transfer students. Given recent compensation increases for faculty, pressure also exists to provide some compensation increases for other employee groups with open contracts in 2017‑18.
Various Ways to Share Costs Between General Fund and Students. Were the Legislature to approve the General Fund level proposed by the Governor, CSU asserts that it would be able to cover the costs of the previously ratified collective bargaining agreements and basic cost increases (such as higher health care premiums). A tuition increase could provide funds for its other priorities. While CSU resident tuition charges have been flat for the past six years, a 5 percent increase might be considered high for one year. In addition, a 5 percent increase in 2017‑18 would be notably higher than anticipated inflation. If the Legislature were to consider tuition increases, we suggest it signal to CSU that a more modest rate increase would be acceptable. Based on our calculations, a 2.5 percent increase in tuition charges would generate net revenue of roughly $38 million. These funds, in turn, would be sufficient to support (1) 1 percent enrollment growth for eligible transfer students and (2) a 1 percent compensation pool for bargaining groups with expiring contracts in 2016‑17. If the Legislature wished to support even higher levels of enrollment growth or employee compensation (that is, more than 1 percent increases), the Legislature could increase General Fund appropriations for CSU above the Governor’s proposed level or permit CSU to raise tuition along the lines of what the Chancellor’s Office is proposing.
Back to the TopCalifornia Community Colleges
In this section, we summarize the Governor’s budget for the CCC system; discuss his specific proposals related to apportionments, categorical programs, and the CCC Chancellor’s Office; provide our assessment of those proposals; and offer associated recommendations for the Legislature’s consideration. (We discuss the Proposition 98 minimum guarantee and crosscutting K‑14 education issues in our Proposition 98 Education Analysis.)
Overview
Proposition 98 Funding Is Largest Source of CCC Support. As shown in Figure 17, the largest sources of funding for community colleges are Proposition 98 General Fund and local property tax revenue. In addition, the state provides non‑Proposition 98 General Fund for certain purposes (CCC general obligation bond debt service, teacher retirement costs, and Chancellor’s Office operations). Altogether, these Proposition 98 and non‑Proposition 98 funds comprise about 75 percent of CCC funding. The remaining 25 percent comes primarily from student enrollment fees, other student fees (such as nonresident tuition, parking fees, and health services fees), and various local sources, including community services programs and facility rentals.
Figure 17
California Community Colleges Funding by Source
(Dollars in Millions)
|
2015‑16 Revised |
2016‑17 Revised |
2017‑18 Proposed |
Change From 2016‑17 |
||
|
Amount |
Percent |
||||
|
Proposition 98 |
|||||
|
General Funda |
$5,304 |
$5,443 |
$5,465 |
$22 |
0.4% |
|
Local property tax |
2,630 |
2,803 |
2,959 |
156 |
5.6 |
|
Subtotals |
($7,933) |
($8,246) |
($8,424) |
($179) |
(2.2%) |
|
Other State |
|||||
|
Non‑Proposition 98 General Fundb |
$435 |
$522 |
$472 |
‑$50 |
‑9.5% |
|
Lottery |
232 |
227 |
227 |
— |
— |
|
Special funds and reimbursements |
76 |
104 |
94 |
‑10 |
‑9.4 |
|
Subtotals |
($744) |
($853) |
($793) |
(‑$60) |
(‑7.0%) |
|
Other Local |
|||||
|
Enrollment fees |
$432 |
$436 |
$440 |
$4 |
1.0% |
|
Other local revenuec |
2,437 |
2,488 |
2,456 |
‑33 |
‑1.3 |
|
Subtotals |
($2,869) |
($2,924) |
($2,896) |
(‑$28) |
(‑1.0%) |
|
Federal |
$298 |
$297 |
$297 |
— |
— |
|
Totals |
$11,843 |
$12,320 |
$12,411 |
$91 |
0.7% |
|
Full‑Time Equivalent (FTE) Students |
1,145,637 |
1,156,810 |
1,168,379 |
11,569 |
1.0% |
|
Proposition 98 Funding Per FTE Student |
$6,925 |
$7,128 |
$7,210 |
$82 |
1.2% |
|
Total Funding Per FTE Student |
$10,338 |
$10,650 |
$10,622 |
‑$28 |
‑0.3% |
|
aIncludes $500 million each year (and an additional $5 million in 2016‑17) for the Adult Education Block Grant, of which more than $400 million goes to school districts for their adult education services. bIncludes funding for state general obligation bond debt service, state contributions to the State Teachers’ Retirement System (STRS), and Chancellor’s Office operations. The 2017‑18 amount includes a $64 million decline in debt service and a $23 million increase in STRS contributions. cPrimarily consists of revenue from student fees (other than enrollment fees), sales and services, and grants and contracts, as well as local debt‑service payments. Amounts are estimates and do not include federal and state student financial aid for nontuition costs or bond proceeds for capital outlay. |
|||||
Governor Proposes to Increase Proposition 98 Funding by $179 Million (2.2 Percent) Over Revised 2016‑17 Level. The 2017‑18 Governor’s Budget increases Proposition 98 funding for CCC to $8.4 billion. The proposed budget includes $387 million in augmentations, partly offset by $209 million in reductions largely due to the removal of prior‑year, one‑time spending. Of the augmentations, $211 million are ongoing programmatic increases and $176 million are one‑time initiatives. In addition to these changes, the Governor’s budget includes a $44 million proposed settle‑up payment related to meeting the 2009‑10 minimum guarantee. The Governor designates this one‑time settle‑up funding for CCC deferred maintenance and instructional equipment. The budget also authorizes $7.4 million from Proposition 51 general obligation bond proceeds. This funding is for preliminary plans for five capital outlay projects.
Major Proposed Augmentations. Figure 18 shows the changes the Governor proposes for community college Proposition 98 spending in 2017‑18. The budget includes four ongoing base increases: (1) $98 million for a 1.48 percent cost‑of‑living adjustment (COLA) on apportionments and select categorical programs, (2) $79 million to fund 1.34 percent enrollment growth, (3) $24 million for an unallocated apportionment increase, and (4) $10 million to augment the Online Education Initiative. The proposed budget package also includes three one‑time funding proposals: (1) $150 million for a new “guided pathways” initiative, (2) $20 million for Innovation Awards, and (3) $6 million to develop an integrated library system.
Figure 18
2017‑18 California Community Colleges Proposition 98 Changes
(In Millions)
|
2016‑17 Revised Proposition 98 Spending |
$8,246 |
|
Technical Adjustments |
|
|
Remove one‑time spending |
‑$177 |
|
Other technical adjustments |
‑32 |
|
Subtotal |
(‑$209) |
|
Policy Adjustments |
|
|
Fund guided pathways initiative (one time) |
$150 |
|
Provide 1.48 percent COLA for apportionments |
94 |
|
Fund 1.34 percent enrollment growth |
79 |
|
Provide unallocated base increase |
24 |
|
Fund Innovation Awards (one time) |
20 |
|
Augment Online Education Initiative |
10 |
|
Develop integrated library system (one time) |
6 |
|
Provide 1.48 percent COLA for select categorical programsa |
4 |
|
Subtotal |
($387) |
|
Total Changes |
$179 |
|
2017‑18 Proposed Proposition 98 Spending |
$8,424 |
|
aApplied to Extended Opportunity Programs and Services, Disabled Student Programs and Services, CalWORKs student services, and support for certain campus child care centers. COLA = cost‑of‑living adjustment. |
|
No Proposed Change to Enrollment Fee. Under state law, CCC students pay an enrollment fee of $46 per unit (or $1,380 for a full‑time student taking 30 semester units per year). The Governor proposes no change to this fee, which has remained flat since summer 2012. The Board of Governors Fee Waiver program waives enrollment fees for half of students, accounting for two‑thirds of credit units taken at the community colleges.
Back to the TopEnrollment Levels and Funding
Below, we provide background on CCC enrollment funding, describe the Governor’s proposal for 2017‑18 enrollment funding, and provide our assessment of that proposal.
Background
State Considers Various Factors When Making CCC Systemwide Enrollment Decision. The state begins by projecting enrollment growth systemwide based on population changes, the economy (specifically, an add‑on if the unemployment rate is high), and prior‑year enrollment demand. It then examines whether any districts have experienced recent enrollment declines or “restorations.” Regarding declines, the state allows districts to claim the higher of their current‑year or prior‑year enrollment levels—effectively a one‑year hold harmless provision. After one year, the state lowers base funding for the affected districts but gives those districts three years to earn back (restore) funding associated with enrollment declines. Each year, some of these districts earn restoration funding. Technically, districts receive restoration funding first, then growth funding. That is, a district receives growth funding only if its actual enrollment exceeds its restoration target.
Chancellor Sets Enrollment Growth Target for Each District. The 2014‑15 budget package required the Chancellor’s Office to develop a new district allocation formula for enrollment growth funding. The purpose of the new formula is to direct a larger share of enrollment funding to certain districts. Whereas previous district allocations largely were based on year‑to‑year changes in the local high school graduation and adult population rates, the new formula instead considers local educational attainment, unemployment, and poverty rates, as well as current enrollment and recent enrollment trends.
State Law Specifies How Enrollment Funds May Be Used. During the recession, the state required community colleges to prioritize core educational programs (including basic skills, transfer preparation, CTE, and English as a second language) over recreational and avocational courses. In 2014, the state codified these enrollment priorities and began requiring the Chancellor’s Office to report annually on course sections and enrollment within and outside of these priority areas.
Governor’s Proposals
Reduces Base Enrollment to Reflect Unused Prior‑Year Enrollment Growth Funding. The Governor’s budget package includes a reduction of $56 million to account for unused 2015‑16 enrollment funding. The budget carries the lower base forward into 2016‑17, achieving a similar amount of savings in the current year relative to the 2016‑17 Budget Act.
Funds Enrollment Growth for 2017‑18. The Governor proposes $79 million for 1.34 percent CCC enrollment growth (an additional 15,500 FTE students). The Governor’s budget makes an adjustment for districts experiencing enrollment declines and restorations. Altogether, the Governor’s budget funds a net increase of 1 percent (about 11,600 FTE students) compared to the revised 2016‑17 level.
Back to the TopAssessment
Systemwide, CCC Fell Short of Meeting Recent Enrollment Targets. After adjustments for enrollment declines and restoration, the 2016‑17 budget funded 2.1 percent net enrollment growth for CCC in 2015‑16 and 1.6 percent in 2016‑17. Net systemwide growth in 2015‑16 turned out to be only 0.4 percent, and preliminary estimates suggest that net systemwide growth in 2016‑17 is only 0.2 percent.
Most Districts Not Meeting Their Growth Targets. About 60 percent of districts are projecting some enrollment growth in 2016‑17 compared with 2015‑16 enrollment levels. Most of these districts, however, do not expect to reach their growth targets. Of 72 districts, only 14 (just under one‑fifth) expect to meet their targets in 2016‑17. Current estimates are preliminary, but, historically, the districts’ January estimates tend to be even higher than final enrollment numbers.
Governor’s Proposed Growth Rate Appears Somewhat High. Given minimal systemwide enrollment growth in 2015‑16 and continued economic and job growth, many campuses likely will see little to no growth in 2016‑17 and 2017‑08. By the time of the May Revision, the CCC Chancellor’s Office will receive some updated 2016‑17 attendance reports from districts. At that time, the Legislature will have better information to assess the extent to which colleges will use the 2016‑17 enrollment growth funds. If the Legislature decides to reduce enrollment funding for one or both years, it could use any associated freed‑up funds for other Proposition 98 priorities.
Recommend Legislature Continue to Monitor CCC Course Offerings. In 2014‑15 and 2015‑16, courses outside of the priority areas accounted for 4 percent and 1 percent of enrollment growth, respectively. Given slowing or declining demand for CCC enrollment in many districts, we recommend the Legislature continue to monitor CCC course offerings to ensure that colleges do not unduly expand enrollment in nonpriority areas to meet enrollment targets.
Other Apportionment Changes
Below, we cover the Governor’s proposals to (1) provide apportionments with a COLA and an additional unallocated increase and (2) make a statutory change related to apportionments.
General Operating Funds
Governor’s Budget Provides $94 Million COLA and $24 Million Unallocated Base Increase. As set forth in state law, the COLA for CCC apportionments is based on the price index for state and local governments. The preliminary COLA estimate for 2017‑18 is 1.48 percent. The Governor also proposes a $24 million additional base increase to account for higher operating expenses in areas such as employee benefits.
Numbers Likely to Change in May. The COLA rate the state uses for CCC apportionments (and some categorical programs) will be locked down in April when the state receives updated data. By the May Revision, the Legislature also will have better information on state revenues, which, in turn, will affect the amount available for CCC Proposition 98 funding increases.
Recommend Legislature Fund COLA and Additional Unallocated Base Increase. We recommend the Legislature adopt the Governor’s proposed apportionment increases. These apportionment increases can help community colleges cover higher pension costs, as well as meet other local priorities and cost pressures. If additional revenues are available in May, the Legislature may wish to provide an even larger base increase than the Governor proposes. The Legislature, however, likely will want to weigh any ongoing apportionment increases against one‑time priorities, as dedicating some CCC funding to one‑time priorities can help protect ongoing programs from cuts were the economy to experience a downturn in 2018.
Proposed Statutory Change
Proposal Repeals Authority to Allocate Excess Local Revenues. Under current law, if local property tax or student fee revenues exceed budget estimates, the Chancellor may allocate the excess amounts to community college districts on an FTE basis for one‑time purposes. The administration proposes to repeal this authority, noting that it is unnecessary and rarely applied.
Recommend Approving Repeal. According to the Chancellor’s Office, it has only exercised its existing statutory authority to use excess local revenues for one‑time purposes once in the last 20 years. This is because the state regularly adjusts current‑year and prior‑year appropriations during the annual budget process. In years when the state initially has underestimated local CCC revenues, it subsequently raises its estimates based on more current data. When local revenues come in below budget expectations, the state provides a General Fund backfill, state fiscal condition permitting. Because the state typically makes these adjustments as part of its regular budget process, repealing the existing authority that allows CCC to redirect excess local revenues to its own local one‑time priorities likely would have little to no practical effect. Nonetheless, it would align state law more closely with traditional state practice.
Back to the TopGuided Pathways
The Governor’s budget includes a proposal to implement guided pathways—commonly described as a comprehensive framework for student success—at all community colleges. Below, we provide background on the recent CCC student success efforts and the guided pathways model, describe the Governor’s proposal, and provide our assessment of the proposal and associated recommendations.
Background on CCC Student Success Efforts
Several Years Ago, Legislature Enacted Policies Designed to Improve Student Outcomes and Streamline Transfer Pathways. In response to longstanding concerns about low completion rates of CCC students, the state in 2010 enacted legislation directing the CCC Board of Governors to develop a comprehensive plan for improving student success. To this end, the board formed a task force that ultimately produced a report containing 22 related recommendations. The Legislature subsequently passed the Student Success Act of 2012 (Chapter 624 of 2012, SB 1456, Lowenthal), which provided the statutory authorization required to implement some of these recommendations. (The CCC system could implement many of the recommended changes administratively.) Most notably, Chapter 624 required the Board of Governors to establish policies intended to ensure that every incoming student received assessment, orientation, and education planning support. In a companion reform effort, the Legislature also enacted the Student Transfer Achievement Reform Act (Chapter 428 of 2010, SB 1440, Padilla). This legislation required community colleges to create 60‑unit associate degrees for transfer that streamlined and expedited transfer to CSU. The legislation required CSU, in turn, to ensure entering transfer students could graduate from a bachelor’s degree program requiring no more than 60 additional units. (For additional information, see our 2014 and 2016 progress reports on implementation of the Student Success Act and our 2012 and 2015 progress reports on implementation of the Student Transfer Achievement Reform Act.)
In Recent Years, State Has Significantly Increased Ongoing Funding for Student Support Programs. As Figure 19 shows, the state increased annual funding for various CCC student success programs from $243 million in 2012‑13 to $820 million in 2016‑17—an increase of $577 million. The bulk of new spending ($391 million) has been for the Student Success and Support Program (SSSP) and student equity. In addition to the funding shown in the figure, the state has provided $500 million annually beginning in 2015‑16 to improve adult education outcomes and $200 million beginning in 2016‑17 to improve career technical education outcomes. Both of these new programs emphasize creating streamlined pathways for students.
Figure 19
Ongoing State Funding for CCC Student Success Programs
(In Millions)
|
2012‑13 Actual |
2013‑14 Actual |
2014‑15 Actual |
2015‑16 Revised |
2016‑17 Enacted |
Increase From 2012‑13 |
|
|
Student Success and Support Program |
$49 |
$85 |
$185 |
$285 |
$285 |
$236 |
|
Student Equity Plans |
— |
— |
70 |
155 |
155 |
155 |
|
Extended Opportunity Programs and Services |
74 |
89 |
89 |
123 |
123 |
49 |
|
Disabled Student Program and Services |
69 |
84 |
114 |
115 |
115 |
46 |
|
Basic Skills Initiative |
20 |
20 |
20 |
20a |
50 |
30 |
|
CalWORKs Student Services |
27 |
35 |
35 |
35 |
44 |
17 |
|
Institutional Effectiveness |
— |
— |
3 |
18 |
28 |
28 |
|
Technology Projectsb |
— |
14 |
14 |
14 |
14 |
14 |
|
Fund for Student Successc |
4 |
4 |
4 |
4 |
6 |
2 |
|
Totals |
$243 |
$331 |
$604 |
$769 |
$820 |
$577 |
|
aIn addition to the ongoing funding shown, the state provided $85 million in one‑time funding—$60 million for the Community Colleges Basic Skills and Outcomes Transformation Program, $15 million for the College Promise Innovation Grant Program, and $10 million for the Basic Skills Partnership Pilot Program. bConsists of the Common Assessment Initiative, Education Planning Initiative, and electronic transcripts. cSupports the Mathematics, Engineering, and Science Achievement program; Middle College High School program; and Puente Project. |
||||||
Background on Guided Pathways
Guided Pathways Represent a Comprehensive Approach to Improving Student Outcomes. The guided pathways model relies on work of the Community College Research Center at Columbia University based on 20 years of community college research. It holds that most colleges are poorly designed for students, who often have difficulty navigating the myriad choices available to them when selecting academic programs and courses. Due to this plethora of choices, students often end up taking a winding path through college, characterized by excess units, extra years in college, and high dropout rates. To remedy these problems, the researchers contend that colleges need to fundamentally redesign their approach to student services, instruction, and administrative practices. Figure 20 compares the traditional community college student experience with a guided pathways model.
Figure 20
Comparing Traditional Student Experience and Guided Pathwaysa
|
Traditional Student Experience |
Guided Pathways |
|
|
Choosing a Major |
New students are encouraged to explore majors on their own and choose a specific major by a set time. |
New students are required to enter an exploratory major (interest area) to help them choose a specific major by a set time. |
|
Making an Academic Plan |
Students are encouraged to meet with a counselor to develop a customized academic plan. |
College has detailed, term‑by‑term, default academic plans by major. Students must adopt or modify a default plan. |
|
Mastering Basic Skills |
Many students are directed to remedial algebra and writing courses, mainly based on standardized tests. A minority of these students ends up completing college‑level math and English courses and moving on to courses in the major. |
Colleges use multiple measures to diagnose students’ specific math and English weaknesses and provide associated instruction and support that is integrated into courses in their majors. |
|
Meeting Goals |
Students can face difficulty figuring out how to satisfy all requirements for a major, transfer, or credential. |
Students rely on clear academic maps tied to explicit student learning outcomes and academic and career goals. |
|
Getting Into Classes |
Students navigate extensive course catalogs and schedules to construct a customized class schedule each term. |
Colleges offer predictable course schedules based on analysis of the courses students need to follow academic plans. |
|
Staying on Track |
Counselors contact students who are not making satisfactory academic progress and offer them support services. |
Students, counselors, and instructors routinely monitor students’ progress. Early warning systems mobilize counselors and faculty to work collaboratively to get struggling students back on track. |
|
aAdapted from work of Community College Research Center, Teachers College, Columbia University. |
||
Key Elements of Guided Pathways. The four key elements of guided pathways are:
- Academic program maps detailing the courses students must complete each semester to earn a credential as efficiently as possible (often including default course selections and schedules).
- An intake process that helps students clarify their college and career goals, choose a program of study, and develop an academic plan based on a program map.
- Close monitoring of student progress paired with proactive student support services and feedback to help students stay on track.
- Institutional and program‑specific student learning outcomes that are aligned with requirements for transfer and careers.
In addition, students upon initial enrollment typically are required to choose an exploratory major (also called a meta‑major) in a broad area such as business, health sciences, or arts and humanities. Early courses in the meta‑major are designed to (1) help students select a specific major and (2) count toward all majors within the broad area. Another feature of guided pathways is basic skills instruction that is integrated into college‑level, program‑relevant courses, often accompanied by required tutoring sessions or other academic support. Colleges implementing these elements have documented significant improvements in certain measures of student progress and success, as summarized in Figure 21.
Figure 21
Evidence on Effectiveness of Guided Pathwaysa
|
Full Pathways Implementation. Following Florida State University’s implementation of default academic plans, exploratory majors, and proactive advising, four‑year graduation rates at the university increased from 44 percent to 61 percent and the share of students graduating with excess credits declined from 30 percent to 5 percent. |
|
New Pathways‑Based Program. Guttman Community College in New York (a new, pathways‑based college) achieved a 30 percent two‑year graduation rate, compared with a median of 13 percent for community colleges in large cities. |
|
Pathways With Comprehensive Supports. The City University of New York’s Accelerated Study in Associate Programs (ASAP)—which combines structured academic programs, an array of support services and incentives, and full‑time study—documented 2‑year and 3‑year graduation rates nearly double those for comparison groups. The ASAP students also were 50 percent more likely to enroll in a 4‑year college by the end of their third year. |
|
Entering a Major Early On. Among students in one statewide community college system, more than half of those who entered a major in their first year earned a credential or transferred within 5 years, compared with around 20 percent of students who did not enter a major in their first year. |
|
Taking Major Courses Early On. In Tennessee, 40 percent of community college students who earned at least 9 semester units in a major within their first year earned a college credential within 6 years, compared with 16 percent of those who did not attempt at least 9 units. |
|
aAdapted from publications of Community College Research Center, Teachers College, Columbia University. |
Several Pathway Initiatives Underway. To date, a number of national organizations and state higher education systems have initiated guided pathways demonstration projects. The largest of these is the Pathways Project led by the American Association for Community Colleges (AACC), launched in 2015 with 30 community colleges in 17 states (including 3 in California). Participating colleges attend six three‑day institutes over two years to help them design and implement structured academic and career pathways for all their students. Colleges receive professional development and technical assistance from AACC and seven partner organizations, but no direct funding from the project. In 2016, the Foundation for California Community Colleges announced the California Guided Pathways Project, closely modeled on the AACC project, that will assist 15 to 20 California community colleges to develop and implement guided pathways.
Governor’s Proposals
Proposes $150 Million One Time for Colleges to Develop Guided Pathways. The stated purpose of the administration’s proposal is to integrate colleges’ many separate student success programs into a coherent system based on the guided pathways model. The administration expects that better organizing and coordinating these existing programs, as well as modifying them as needed, will significantly improve student outcomes.
Largely Delegates Program Design to Chancellor. Proposed trailer legislation establishes the CCC Guided Pathways Grant Program and tasks the Chancellor’s Office with administering it. The language directs the Chancellor’s Office, to the extent feasible, to leverage the work of the California Guided Pathways Project, which already has developed programmatic requirements.
Most of the Funding Goes to Colleges. Unlike other pathways initiatives that devote all of their funding to centralized professional development and technical assistance for colleges, the Governor’s proposal would provide at least 90 percent of funding directly to colleges. Of this amount, the Chancellor’s Office would allocate 45 percent based on each college’s share of the state’s Pell Grant‑eligible students, 35 percent based on each college’s share of full‑time equivalent enrollment, and 20 percent as a fixed base grant for each college. To receive funding, colleges would have to demonstrate their commitment toward implementing guided pathways by (1) submitting a commitment letter signed by the governing board president, chief executive officer, and Academic Senate president; (2) attending a workshop; and (3) submitting an implementation plan that integrates existing student success programs. The remaining funding proposed by the Governor (up to 10 percent) would be for statewide assistance and programmatic support.
Requires Chancellor to Submit Annual Reports for Five‑Year Period. The trailer legislation requires the Chancellor to submit a report by July 1, 2018 and annually thereafter for four more years. The first report is to detail the funding allocations, the second to summarize colleges’ guided pathways implementation plans, and the three remaining reports to summarize each district’s progress toward implementing its plan. In addition, the Chancellor is to include in each of the five reports any statutory or regulatory changes it believes are needed to facilitate colleges’ further implementation of guided pathways.
Assessment
System Generally Making Progress Implementing Student Support Programs . . . As described in our four progress reports between 2012 and 2016, the CCC system has made significant progress implementing recent student success and transfer reforms. It has implemented policies to increase the number of students receiving orientation, assessment, and education plans and developed clearer statewide transfer pathways in more than 40 majors. Colleges have hired more counselors and other student success personnel, boosted student support services and student equity efforts, and adopted evidence‑based models of basic skills assessment and instruction. Many colleges also have started implementing technology systems that help students explore careers and develop education plans; access counseling, tutoring, and student services; and track their progress toward completion. Additionally, colleges are developing streamlined CTE pathways, support services, and contextualized basic skills instruction under the new workforce program created in 2016.
. . . But Problems Remain. Despite progress in these areas, significant problems remain. At many colleges, campus decision making related to the various student success programs resides in separate organizational units (such as academic affairs or student services) or is directed by separate groups within a single unit. Consequently, the programs often operate independently with inadequate coordination among them. This lack of coordination results in duplication of services, gaps in services, and inefficient resource allocation. In addition, little agreement sometimes exists across the system regarding how best to pursue the goals of the various student success programs. For basic skills programs, state law lists a number of evidence‑based practices and requires colleges to implement them, but other programs, such as SSSP and student equity, have no such requirement in state law. As a result, some colleges allocate small amounts of funding to numerous unconnected and sometimes experimental projects rather than concentrating their funds on larger‑scale implementation of evidence‑based practices. Another concern is that existing student success programs are not reaching a large proportion of students. Specifically, many students still do not complete “mandatory” orientation, assessment, and education planning, and many colleges have not sufficiently aligned their course offerings with students’ education plans. This suggests that, despite receiving funding for the state’s student success initiatives, some colleges have not fundamentally changed how their student support and instructional services are organized for students. This may be due to weak incentives to change established practices and lack of broad‑based support on campuses for such changes.
State Policy Changes Likely Needed. Operating existing academic support, student success, and student equity programs in separate silos reflects, in part, how the state funds these services. The state supports them through separate programs, each with its own programmatic objectives, statutory requirements, and funding allocations. The Legislature could help break down these institutional silos and foster better coordination by combining them, streamlining their requirements, and funding them through one allocation formula. The Legislature also could change state law to (1) provide more guidance to colleges regarding their use of SSSP and student equity funds for evidence‑based practices and (2) strengthen incentives for students and colleges to adopt these practices. Alternatively, the Legislature could require the Board of Governors to adjust these policies through regulations to more effectively implement existing law.
Guided Pathways Framework Could Improve Coordination and Effectiveness of Programs. Just as the state should ensure its policies support rather than impede colleges’ student success efforts, colleges also have an important role in examining and revising their practices. Consistent with the guided pathways model, colleges could examine and reorganize their instructional practices, student support programs, and administrative procedures to improve student outcomes. In addition to orienting these practices toward improved student success (redesigning them where needed), the model emphasizes putting these practices together intentionally so that they help all students at a college choose and succeed in programs and graduate with the knowledge and skills they need for transfer or employment. It would be hard to overstate the difficulty of integrating programs and departments that historically have operated independently. If successfully implemented, however, the guided pathways model could help colleges improve program coordination and achieve better student outcomes.
Proposal Does Not Build Off Best Practices to Date. As noted earlier, existing large‑scale guided pathways initiatives have retained funding centrally to provide professional development and technical assistance to colleges, rather than funding colleges directly. Under these existing initiatives, only colleges with a strong interest in developing guided pathways and a willingness to reallocate existing resources choose to apply. The Governor’s proposal takes a notably different approach, giving substantial grants directly to colleges and setting aside a relatively small share (10 percent) for centralized support. Such a decentralized approach could have the unintended effect of funding colleges that do not have a strong, broad‑based commitment to the work, while shortchanging colleges on the professional development and technical assistance component.
No Basis for Specific Amount. In addition to providing no justification for his different approach to encouraging guided pathways, the Governor provides no explanation for his proposed funding amount. The administration has indicated colleges likely would use their funding mainly for release time (or summer pay) for faculty, staff, and administrators to work on developing maps and other components. The administration, however, has not indicated the amount of release time envisioned or how it would be apportioned over the five‑year implementation period.
Proposal Missing Many Details. The proposal also contains few details about how colleges could use their funds, what would be expected of them, or how the program would operate. Furthermore, the Governor’s proposal lacks mechanisms to monitor progress, provide feedback for midcourse corrections, or contribute to the research on guided pathways implementation.
Not All Colleges Likely Ready for Fundamental Reform. Colleges that have implemented guided pathways indicate that doing so requires a high level of commitment from college leaders, faculty, and staff. This is because the types of changes required often challenge longstanding patterns of organizational behavior and pedagogy. Building commitment takes time and is not always possible in all institutions. The Governor’s proposal, however, would fund all colleges, even those that likely are not fully committed to or prepared for the associated work.
Recommendations
Require Additional Information From Chancellor and Administration. The guided pathways model could provide an effective superstructure for CCC student success efforts. For this reason, we think the Governor’s proposal has potential. The proposal, however, does not contain many important details about how the initiative would work. We recommend the policy and budget committees further explore the Governor’s concept through hearings. The Legislature could ask the Chancellor—who ultimately would be responsible for leading such an effort—to share his vision for how it should be structured, implemented, and led, including how existing CCC resources (such as the Institutional Effectiveness Partnership Initiative and CCC Success Center) would contribute to the effort. The Chancellor could discuss the outcomes the state could expect from colleges receiving funding. The Chancellor also could address what changes might be needed in how the state organizes and funds CCC student success efforts, and how he would ensure that the proposed initiative does not become yet another programmatic silo. The Legislature also could ask the administration to present a rationale for its proposed dollar amount and timeline. With this information, the Legislature would be in a far better position to weigh the Governor’s guided pathways proposal against its other priorities for one‑time funds.
Other Programmatic Proposals
Below, we discuss three of the Governor’s other proposals—one relating on an ongoing expansion of the Online Education Initiative, another relating to more one‑time awards for colleges to implement innovative improvement strategies, and a third relating to establishing an Integrated Library System for all community colleges.
Online Education Initiative
Initiative Aims to Provide Statewide Access to Online Courses. The Online Education Initiative includes several projects: a common course management system for colleges, resources to help faculty design high‑quality courses, online learner readiness modules, tutoring and counseling platforms, exam‑proctoring solutions, and the CCC Online Course Exchange. (The course exchange, which is being piloted in Spring 2017, is a system enabling students at any community college to see what degree‑applicable online courses are offered at other colleges, enroll in those courses, and have their attendance and associated funding attributed to the appropriate colleges.) The state initially funded the Online Education Initiative with $17 million in 2013‑14 and has provided a base amount of $10 million annually thereafter to increase CCC students’ access to and success in online courses. In addition, the 2016‑17 budget includes $20 million one time to accelerate progress on the initiative.
Common Course Management System is Key Component of Initiative. All colleges use a course management system for both online and in‑person classes. Faculty use the system to post course information (such as the syllabus), instructional content (such as readings and videos), assignments, and other material. Students use the system to submit assignments, collaborate with classmates, and communicate with instructors. Historically, each college or district has selected its own course management system from among several vendors. To facilitate statewide, online course sharing, the CCC selected the Canvas course management system in February 2015. The Chancellor’s Office is requiring colleges that want to participate in the Online Course Exchange to use Canvas as their course management system and not maintain their former course management systems.
Governor Proposes $10 Million Ongoing Augmentation. The proposed augmentation would bring ongoing annual funding to $20 million. The new funds primarily would pay for faster‑than‑anticipated implementation of Canvas. Whereas CCC expected interested colleges to adopt the new system over three or four years, 103 of 113 colleges already have implemented the new system or committed to doing so within the past two years. The initiative also committed to cover all Canvas subscription and implementation costs through 2018‑19 (using the state appropriation), and a substantial portion of these costs thereafter. The proposed augmentation instead would permit the initiative to cover full ongoing subscription costs for all colleges indefinitely. In addition, the new funds would support annual subscriptions to an online tutoring platform, additional software that permits students and their academic counselors to meet virtually (over the Internet), and various accessibility, plagiarism detection, and student authentication features.
Common Course Management System Is Benefiting Students and Faculty. The common course management system is providing a consistent interface for students enrolled at multiple colleges (about 20 percent of all CCC students). In addition, the system is expanding access for all students to academic support resources (such as the online tutoring and counseling services) through their course web pages. The system also is providing more consistency for faculty who teach at multiple colleges and making the sharing of course materials and best practices easier.
Savings for Community Colleges. In addition to better serving students and faculty, a common course management system has lower subscription and administrative costs compared to maintaining dozens of college‑specific course systems. Moreover, at most colleges, the initiative’s shouldering of all Canvas costs to date has freed up funds colleges otherwise would have used toward their own course management systems. Currently, no requirement exists that campuses use freed‑up funds for statewide purposes or benefits. As a result, colleges that have implemented Canvas have been able to redirect these funds toward any local priority. The Governor’s proposal, by providing ongoing funding for all Canvas costs, would extend indefinitely colleges’ ability to use freed‑up funds for local purposes.
Colleges’ Savings Could Help Support Ongoing Course Management System Costs. Instead of redirecting freed‑up course management system funds to other local purposes, colleges could contribute a portion of those funds toward ongoing Canvas subscription and maintenance costs. Given lower costs for the new system and the existing state earmark that will cover a substantial portion of these costs (currently estimated at 40 percent once all colleges are at full implementation), most colleges would be able to pay the remaining costs and still have savings to redirect to other local priorities.
Online Education Initiative May Curtail Services. Initiative leadership has indicated it wishes to minimize the extent to which it reneges on its commitment to fund 100 percent of Canvas costs through 2017‑18, in an effort to avoid diluting the enthusiasm it has generated for CCC technology projects. To mitigate canvas cost increases for colleges, therefore, the initiative would reduce some services if it does not receive the Governor’s proposed increase. For example, it likely would reduce the technical support hours it currently funds, requiring colleges needing evening and weekend support to contract for this service separately.
Recommend Rejecting Online Education Initiative Augmentation. Because most colleges otherwise would be paying for their own course management systems and the new central system is both less expensive and already state subsidized, we recommend the Legislature reject the Governor’s proposal to augment the Online Education Initiative. While rejecting the augmentation might result in some colleges changing their budget plans (since they no longer would receive the full subsidy they are anticipating), most colleges still will realize savings from implementing Canvas. The initiative as currently funded is achieving its purpose: it successfully began rolling out a common course management system and a suite of related products, with nearly all campuses signing up to implement these statewide resources. With this momentum, we believe the initiative could continue its progress without an augmentation. The Legislature could redirect the $10 million to other ongoing CCC Proposition 98 costs, such as general apportionments.
Innovation Awards
First Awards Funded in 2014‑15. The 2014‑15 budget provided $50 million in one‑time funding to promote innovative models of higher education at UC, CSU, and CCC campuses. Campuses (or teams of campuses) that had undertaken initiatives to increase the number of bachelor’s degrees awarded, improve four‑year completion rates, or ease transfer across segments could apply for awards. Because awards were based on initiatives already implemented at the campuses, they functioned more like prizes or rewards than grants for specified future activities. A committee of seven members—five Governor’s appointees (one each representing DOF, the three segments, and the State Board of Education) as well as two legislative appointees selected by the Speaker of the Assembly and the Senate Rules Committee, respectively—made award decisions, approving 14 of 57 applications, including 6 from community colleges. The winning applications were for strategies that included improving K‑12 alignment to higher education standards and expectations, redesigning curriculum and teaching practices to improve outcomes, and using technology to expand access to courses. Each winning applicant received from $2.5 million to $5 million in award funds. Award recipients are to report on the effectiveness of their strategies by January 1, 2018 and January 1, 2020.
Legislature Rejected Governor’s Proposal for Additional Awards in 2015‑16. The proposal would have provided $25 million in one‑time funding for a new round of awards using a similar application process. The proposal differed from the 2014‑15 program, however, in that it would have (1) narrowed the priorities to focus only on improving four‑year graduation rates and (2) provided awards only to CSU campuses.
Second Round of Awards Funded in 2016‑17. After rejecting the administration’s proposal for more awards in 2015‑16, the Legislature accepted a revised proposal the following year. The 2016‑17 awards program, also funded with $25 million one time, differs from the 2014‑15 program in four ways: (1) only CCC districts can apply for awards, which are supported by Proposition 98 General Fund; (2) awards are based on proposed activities instead of initiatives applicants already have implemented; (3) awards focus specifically on effective articulation and transfer pathways, successful transitions from higher education into the workforce, and innovations in technology and data; and (4) the Governor has more discretion in selecting his appointees to the awards committee. (Members no longer have to represent any of the higher education segments or the State Board of Education.) Applications for these awards were due February 3, 2017.
Governor Proposes Third Round of Awards. The Governor’s budget includes $20 million one‑time Proposition 98 General Fund for innovation awards to community colleges. Whereas the administration has been closely involved in implementing innovation awards in previous years, the proposal this year provides the Chancellor’s Office substantial latitude to set award criteria and select winners, with no requirement to use the existing awards committee. The Chancellor’s Office has indicated it would prioritize applicants that focus on addressing statewide needs like improving adult learning and better serving veterans. The Chancellor’s Office also indicates that, as in previous rounds, awards would be competitive and undergo a rigorous selection process.
Potential Statewide Benefits Unclear. One of our most significant concerns with the proposal is that the awards might provide relatively large sums to a small number of community colleges to implement local initiatives that would not necessarily have statewide impact. This is because the proposal does not provide for dissemination of innovations to other colleges across the state nor does it do anything to promote buy‑in among colleges to implement the innovations.
Award Program Further Fragments Efforts to Improve Student Outcomes. We also are concerned that the proposal would add yet another program to the state’s numerous existing efforts to improve CCC student outcomes. The current plethora of programs, detailed earlier in our discussion of guided pathways, already are challenging for colleges and the state to coordinate. Moreover, compared to the innovation awards, these existing programs are designed to have much broader statewide impact, with funds going to all colleges to implement already well‑documented student success strategies. Rather than funding another round of generous awards to a small number of colleges, we believe the state should focus on ensuring that existing CCC student success programs are implemented effectively.
Reject Governor’s Proposal to Provide $25 Million for CCC Awards. For these reasons, we recommend the Legislature reject this proposal. The Legislature could instead target the funding to other priorities, like deferred maintenance, that are one‑time in nature.
Integrated Library System
Purpose of an Integrated Library System (ILS). An ILS is software that libraries use to manage their collections and activities. Typical functions include acquisition and cataloging of books and other materials, providing ways for library users to search catalogs and access materials, and tracking the circulation of these materials.
Library Systems Outdated at Most Community Colleges. All CCC academic libraries have some form of ILS. The CCC Council of Chief Librarians conducted surveys of community college library directors in 2014 and early 2017 to assess the adequacy of their existing ILS and interest in a systemwide ILS. The council found that a large majority of colleges’ existing systems were older, locally hosted ones serving a single college. In contrast, the current leading technology is cloud‑based, hosted by a vendor, and often serving multiple campuses or institutions. The council also found that more than three‑fourths of respondents were interested in pursuing a systemwide ILS.
New Generation of ILS Offers More Functions. In addition to using a different architecture, newer ILS have a number of features typically not available in the older systems. These include, for example, comprehensive discovery tools that search across all types of resources—including physical books and periodicals in a library’s collection, electronic books and journals, digital archives, and holdings in other participating libraries. (In older systems, users often must search multiple catalogs or databases at multiple institutions.) Other features include the ability to deliver resources across the system more efficiently, better collection management tools for libraries, and rapid systemwide updating of software and electronic collections as needed.
Governor Proposes $6 Million One Time to Support Development of Systemwide ILS. The proposal, which was included in the Board of Governors’ System Budget Request, reflects a recommendation from the Council of Chief Librarians. Under the proposal, the CCC Technology Center would receive the funding to procure and implement a systemwide ILS. The Technology Center also would assist colleges with local implementation, which generally involves “migrating” existing catalogs and databases to the new system, integrating it with their student information systems (for student authentication) and learning management systems (for seamless access through course websites), and training library personnel and others to use its features.
Some Funding Would Go for “Critical Thinking Tool.” Of the $6 million for the ILS, the chief librarians propose to use $775,000 for a statewide subscription to a service that helps students research more than 150 contemporary, controversial issues. This service provides curated resources—15,000 primary and secondary materials selected and validated by educators—that students can compare and analyze for course assignments. A student writing a paper on an environmental controversy, for example, could gain exposure to different perspectives on the issue, research current data, and use that information to draw conclusions about the issue.
Students and Faculty Would Benefit From Common System. Because an ILS would facilitate sharing of library materials across colleges, it would especially benefit students and faculty at colleges with more limited collections. Moreover, students who attend—and faculty who teach at—multiple community colleges would benefit from having a single user account and a single interface for all their library needs. Additionally, colleges could coordinate their library acquisitions to reduce duplication and expand the depth of their acquisitions in particular subject areas.
Ongoing Costs Would Be Lower With Systemwide ILS. As part of its 2014 survey, the Council of Chief Librarians collected information about colleges’ existing ILS spending. It then compared existing spending with the projected ongoing cost of a new systemwide ILS. As Figure 22 shows, the council estimates that a systemwide ILS (including the critical thinking tool) would result in about $4.5 million in ongoing savings to CCC overall. In addition to lower ongoing costs for annual licenses to the ILS, the council believes colleges could achieve substantial staff savings, having to devote fewer library and technology staff to maintaining the new system. Much of the “back office” work of adding statewide library acquisitions and installing software updates could be done centrally and more efficiently. Colleges still would need some “front office” staffing to add local acquisitions, keep the system integrated with the campus website and other technologies, and ensure uninterrupted access for users.
Figure 22
Current and Projected Ongoing Costs for CCC Integrated Library Systema
|
Current Costs |
Projected Costs |
Savings |
||||
|
(All Local) |
Local |
Central |
Combined |
|||
|
ILS service cost |
$4,633,000 |
— |
$2,225,000 |
‑$2,408,000 |
||
|
Hardware/server costs |
90,400 |
— |
— |
‑90,400 |
||
|
Staff costs |
4,181,000 |
$1,921,000 |
250,000 |
‑2,010,000 |
||
|
Totals |
$8,904,400 |
$1,921,000 |
$2,475,000b |
‑$4,508,400 |
||
|
aEstimates from the CCC Council of Chief Librarians. bThe Board of Governors has requested the state support this cost beginning in 2019‑20. ILS = Integrated Library System. |
||||||
Strong Fiscal Incentives for Colleges to Support Systemwide ILS but Requires Coordination. Given a systemwide ILS would be less costly than colleges’ existing ILS spending, colleges have strong fiscal incentives to support a centralized system. Colleges would need to coordinate, however, to pursue a systemwide ILS. In particular, colleges would have to find a way to commit and pool their funds to pay for the new system. Each college also would have to identify one‑time funds from reserves or other sources to pay for initial development costs, costs they would incur while simultaneously maintaining their existing ILS systems throughout the conversion process. CCC librarians indicate that these administrative obstacles have prevented the systemwide ILS from moving forward for several years.
Recommend CCC Move Forward With ILS. Given the cost‑effectiveness of a systemwide ILS and the likelihood of it resulting in better and more consistent services for students and faculty across the system, we believe implementing it would be an effective use of one‑time funds. We encourage the CCC Chancellor’s Office to pursue development of this system, whether or not the state provides specific funding for it.
Recommend Legislature Consider ILS Proposal in Context of Other Priorities for One‑Time Funding. As noted, colleges have strong incentives to fund development and implementation of a systemwide ILS, given it is less costly on an ongoing basis than their existing library systems. To date, however, colleges have been unable to overcome accompanying administrative hurdles. A one‑time infusion of state funds could move the project forward. In deciding whether to approve state funds for the project, the Legislature could consider (1) the anticipated benefits to students and faculty of the new system, (2) the likelihood of the colleges developing a systemwide ILS on their own, and (3) competing priorities for use of one‑time Proposition 98 funds. One alternative use of these one‑time funds would be reducing CCC deferred maintenance. The system currently reports more than a $5 billion maintenance backlog, yet the Governor’s budget package includes only $44 million for addressing it.
Recommend Leveraging CSU’s Recent Systemwide ILS Adoption. In 2013, the CSU Council of Library Deans, with financial support from the CSU Chancellor’s Office, began the process of developing a systemwide ILS. The university conducted an extensive vetting process to select a vendor and now is in the process of implementing its new system. The CCC effort, if it proceeds, could benefit from the experience gained by the CSU council. Under state law, CCC could also potentially procure its system using the university’s ILS contract, if CCC leaders determine that the same product meets community colleges’ needs. (Chapter 366 of 2015 clarifies that community colleges may purchase goods and services through contracts awarded to the state’s public universities.) The primary benefit of leveraging CSU’s recent adoption in this way is the considerable time it would save in the procurement process. (Procuring the same system as CSU likely would not reduce CCC costs, as the one‑time costs primarily are for the work of transitioning to a new system, and ongoing costs largely are based on student enrollment.)
State Operations
Below, we provide background on the CCC Chancellor’s Office and then discuss the Governor’s proposal to add new positions (with associated funding) and revise the organizational framework of the office.
Background
Chancellor’s Office Provides System Leadership and Oversight. The 17‑member CCC Board of Governors, appointed by the Governor, sets policy and provides guidance for the 72 districts and 113 colleges that constitute the CCC system. The board selects a chancellor for the system, and under state law, it may delegate its duties and powers to the chancellor. In practice, the board relies on the Chancellor’s Office to conduct a formal consultation process with CCC stakeholder groups and bring recommendations to the board for action. The Chancellor’s Office also carries out oversight required by statutes and regulations, manages the day‑to‑day operations of the system, and manages implementation of statewide programs. In addition, the Chancellor’s Office provides technical assistance to districts and colleges and conducts regional and statewide professional development activities—a role that has expanded in recent years with state funding for the Institutional Effectiveness Partnership Initiative.
Current Structure of Office. As Figure 23 shows, the Chancellor’s Office has an executive office led by the chancellor, executive vice chancellor, and deputy chancellor, as well as ten divisions. (The executive vice chancellor position currently is not used.) Other than Legal Affairs and Human Resources, which are led by a general counsel and a director, respectively, each of the remaining divisions is headed by a vice chancellor. Altogether, the Chancellor’s Office has 166 authorized positions, of which between 85 percent and 90 percent typically are filled.
Figure 23
Senior Leadership Positions
|
Position |
Exempt? |
Status |
|
|
Executive Office |
Chancellor |
Yes |
Filled |
|
Executive Vice Chancellor |
Yes |
Vacant since 2014 |
|
|
Deputy Chancellor |
Yes |
Filled |
|
|
Divisions |
|||
|
Academic Affairs |
Vice Chancellor |
Yes |
Filled |
|
Workforce and Economic Development |
Vice Chancellor |
Yes |
Filled |
|
Institutional Effectiveness |
Vice Chancellor |
Yes |
Filled |
|
College Finance and Facilities Planning |
Vice Chancellor |
Yes |
Filled |
|
Governmental Relations |
Vice Chancellor |
Yes |
Filled |
|
Communications and Marketing |
Vice Chancellor |
No |
Filled |
|
Technology, Research, and Information Systems |
Vice Chancellor |
No |
Filled |
|
Human Resources and Internal Operations |
Director |
No |
Filled |
|
Legal Affairs |
General Counsel |
No |
Vacant |
|
Student Services and Special Programs |
Vice Chancellor |
No |
Vacant since 2014 |
Governor Appoints Six Senior Managers. The Governor, with the recommendation of the Board of Governors, appoints an executive vice chancellor, deputy chancellor, and four of the eight vice chancellors. The deputy chancellor appoints one additional vice chancellor. These appointees are exempt from state civil service. The three other vice chancellor positions are within the state civil service, in the career executive assignment (CEA) classification.
Governor’s Proposal
Governor Proposes Increase of Two Positions and $378,000. The Governor’s budget includes funding for two additional exempt vice chancellor positions. The Governor proposes to make conforming changes to statute to authorize the two additional Governor’s appointments. The administration indicates that the additional positions are to assist the Chancellor’s Office’s efforts to improve student success, address disparities in outcomes for disadvantaged groups, and develop the proposed guided pathways program.
Governor Also Proposes to Revise “Organizational Framework.” In the Governor’s Budget Summary, he notes that the Department of Finance will collaborate with the Chancellor’s Office throughout spring 2017 to revise the office’s organizational framework. According to the administration and the Chancellor’s Office, a goal of the review is to enable the new chancellor to shift the emphasis of the office from primarily conducting regulatory oversight toward primarily helping colleges meet statewide goals.
Assessment and Recommendations
Chancellor’s Office Defines the Problem. Asked to clarify the goals of the organizational review, Chancellor’s Office representatives described insufficient capacity to drive the system toward improvement. (Such work is more difficult in a decentralized system like the community colleges than within a more centralized or hierarchical organization.) They believe the organization is tasked with myriad mandates and expectations without adequate staffing and expertise to meet those requirements. They also believe few resources are available for work unrelated to compliance, including the more supportive work of improving systemwide outcomes. Moreover, the office has had a difficult time attracting and maintaining senior leadership, in part due to compensation levels that are significantly below those typically available at districts and colleges. As one example, the vice chancellor for student services position has not had a permanent occupant since late 2014.
CCC Stakeholders Provide Feedback. As one of his early actions, the new chancellor conducted a survey of CCC faculty, staff, and other stakeholders to gauge their perceptions of the office’s role. In the survey, the Chancellor asked about the office’s level of regulatory oversight. A large majority (79 percent) of respondents generally agreed that the current level of oversight is reasonable, given the office’s responsibility to report to the Legislature, Governor, and taxpayers. Among other notable findings, three‑quarters of respondents generally agreed that the policy changes implemented by the Chancellor’s Office over the last five years (such as new student success regulations) are having a positive impact on student outcomes, and 81 percent agreed that improving staffing and resources at the Chancellor’s Office could lead to better support for colleges.
Proposed Solutions May Not Fit Problem. The addition of more vice chancellors would not necessarily best address the shortcomings identified by the Chancellor’s Office and the administration. It could turn out that the office needs greater capacity among research analysts, program specialists, or deans. Moreover, the proposed new positions would not necessarily address the office’s difficulty in attracting and retaining senior leaders. Additionally, given the field’s general agreement on the importance of existing oversight provided by the Chancellor’s Office, as well as the state’s reliance on this oversight to ensure the effective use of state funds, a notable shift away from this oversight role—as proposed by the Governor—may not be warranted.
Request Additional Information. Given the administration and the chancellor are in the midst of reviewing the organizational framework of the Chancellor’s Office, it would be premature to add more vice chancellor positions at this time. We believe the Governor’s staffing and organizational proposal is in effect a placeholder, pending conclusions from the review. We recommend the Legislature ask the administration and the Chancellor’s Office to report on the results of their review during spring budget hearings. At that time, the Chancellor’s Office might offer better justification for any proposal to add positions or funding to the office. The Chancellor’s Office also could identify lower‑value oversight activities that could be curtailed without adverse effect, thereby freeing up existing staff for higher priority work, including better supporting systemwide improvement.
CCC Facilities
Below, we provide background on state funding for CCC facilities and discuss the Governor’s proposal to authorize five general obligation bond‑funded community college projects.
Background
State Primarily Funds Community College Facilities Through General Obligation Bonds. The state typically issues general obligation bonds to help pay for community college facility projects. A majority of voters must approve these bonds. From 1998 through 2006, voters approved four facility bonds that provided a total of $4 billion for community college facilities. Virtually no funding remains from these facility bonds.
New State Bond Approved in 2016. After a ten‑year gap, voters approved Proposition 51 in November 2016. It authorizes the state to sell $2 billion in general obligation bonds for community college projects (in addition to $7 billion for K‑12 school facilities projects). The funds may be used for any CCC facility project, including buying land, constructing new buildings, modernizing existing buildings, and purchasing equipment.
Community College Facility Projects Recommended by Chancellor and Approved in Annual Budget. To receive state bond funding, community college districts must submit project proposals to the Chancellor’s Office. The Chancellor’s Office ranks all submitted facility projects using the following five criteria adopted by the Board of Governors (in order of priority):
- Life‑safety projects, projects to address seismic deficiencies or risks, and infrastructure projects (such as utility systems) at risk of failure.
- Projects to increase instructional capacity.
- Projects to modernize instructional space.
- Projects to complete campus build‑outs.
- Projects that house institutional support services.
In addition, projects with a local contribution receive greater consideration. (Districts raise their local contributions mainly through local general obligation bonds.) Based on these criteria, the Chancellor submits capital outlay project proposals to the Legislature and Governor for approval and funding as part of the annual state budget process.
Chancellor Recommended 29 Projects for 2017‑18. These projects, located at 24 colleges, would require $71 million in state funding for planning in the first year and $621 million for construction and equipment in the following years. In addition, districts have committed $438 million in local funding for these projects. Of the 29 priorities, the Chancellor ranks 3 in the highest‑priority category, 11 in the second highest‑priority category, 11 in the third category, 4 in the fourth category, and none in the last category.
Governor’s Proposal
Governor Proposes Five CCC Projects for 2017‑18. The administration proposes to fund 5 of the 29 projects submitted by the Chancellor’s Office. As summarized in Figure 24, the Governor’s budget includes $7.4 million in 2017‑18 for initial planning costs. Total state costs for the five projects (including construction) are estimated to be $182 million. The Governor proposes to fund all three highest‑priority projects—those addressing seismic issues and failing utility infrastructure. The other two projects the Governors proposes are from the third priority category—projects to modernize instructional space. In selecting these projects, the administration bypassed 11 new building projects that would expand instructional capacity. According to the Department of Finance, this is because the two selected projects, in addition to modernizing instructional facilities, address significant life safety concerns in those facilities. (These projects do not appear in the first‑priority category because they also include some elements that are unrelated to life‑safety concerns.)
Figure 24
Governor’s Proposed CCC Capital Outlay Projects
Reflects State Costs (In Thousands)
|
College |
Project |
2017‑18 Cost |
Total Cost |
|
City College of San Francisco, Ocean Campus |
Utility Infrastructure Replacement |
$2,978 |
$76,855 |
|
Pasadena City College |
Armen Sarafain Building Seismic Replacement |
2,199 |
58,287 |
|
El Camino College, Compton Center |
Instructional Building 2 Replacement |
765 |
16,591 |
|
Fullerton College |
Business 300 and Humanities 500 Building Modernization |
711 |
15,270 |
|
City College of San Francisco, Alemany Center |
Seismic and Code Upgrades |
715 |
15,148 |
|
Totals |
$7,368 |
$182,151 |
Assessment
Proposed Projects Address State Priorities. As noted, all five projects the administration proposes to fund involve significant life‑safety issues. Notably, two of the projects—both in San Francisco—do not include a local funding contribution. Both of these projects, however, address critical life safety issues, and thus were among the Chancellor’s top three priorities even without a local contribution. The other three proposed projects have substantial local funding contributions.
Governor’s Proposal Too Small Relative to Voter‑Approved Bond Funding. The total state cost of the five proposed projects amounts to 9 percent of the CCC bond funding authorized in Proposition 51. If the state were to fund a similar amount each year, it would take more than 11 years to use the full $2 billion approved by the voters. Given a substantial backlog of facility projects at the community colleges, we see no justification for funding so few projects in the first year.
Recommendations
Require Administration to Provide More Information. We recommend the Legislature ask the administration during spring budget hearings to clarify its plans for rolling out the $2 billion in Proposition 51 bond funding for CCC projects as expeditiously as possible.
Develop Five‑Year Expenditure Plan. Based on the information provided by the administration and the Chancellor’s Office, we recommend the Legislature consider authorizing additional CCC projects in 2017‑18. The Legislature’s plan for the budget year could be part of a more extensive five‑year expenditure plan. One option for such a plan would be to approve projects totaling about one‑fifth ($400 million) of the available funding for each of the next five years. Having a multiyear plan for spending Proposition 51 bond monies would (1) help community colleges plan their capital outlay programs, (2) ensure that voter‑authorized funds are put to use within a reasonable time, and (3) spread bond sales over several years, thereby allowing more time for the Legislature to review proposed projects.
Back to the TopHastings College of the Law
In this section, we provide an overview of the Governor’s proposed budget for Hastings, describe the school’s proposed spending plan, assess that plan, and offer an associated recommendation.
Overview
Governor’s Budget for Hastings Consists of $55.5 Million in Core Funds for 2017‑18. This reflects a $1.4 million (2.5 percent) decrease from the current year. As the top half of Figure 25 shows, Hastings’ primary source of funding is student tuition and fee revenue ($41 million), followed by state General Fund ($12.7 million), with a small amount ($1.6 million) coming from other sources (including investment income, lottery, and a portion of funding from the school’s auxiliary programs.)
Figure 25
Hastings Core Budget
(Dollars in Millions)
|
2015‑16 Actual |
2016‑17 Revised |
2017‑18 Proposed |
Change From 2016‑17 |
||
|
Amount |
Percent |
||||
|
Reserve at start of year |
$26.1 |
$24.9 |
$18.5 |
‑$6.4 |
‑25.8% |
|
Funding |
|||||
|
General Fund—ongoing |
$10.6 |
$11.7 |
$12.7 |
$1.1 |
9.2% |
|
General Fund—one time |
0.0 |
2.0 |
0.0 |
‑2.0 |
— |
|
Subtotals |
($10.6) |
($13.7) |
($12.7) |
(‑$0.9) |
(‑6.8%) |
|
Gross tuition and fee revenue |
$40.3 |
$41.7 |
$41.1 |
‑$0.6 |
‑1.3% |
|
Other corea |
1.6 |
1.6 |
1.6 |
— |
2.8 |
|
Totals |
$52.5 |
$56.9 |
$55.5 |
‑$1.4 |
‑2.5% |
|
Spending |
|||||
|
Instruction |
$21.2 |
$21.8 |
$22.1 |
$0.3 |
1.2% |
|
Tuition discounts |
12.1 |
16.0 |
18.9 |
2.9 |
17.9 |
|
Institutional support |
10.9 |
12.7 |
12.4 |
‑0.3 |
‑2.1 |
|
Student services |
4.4 |
4.9 |
4.9 |
‑0.0 |
‑0.2 |
|
Law library |
2.8 |
3.0 |
3.1 |
0.0 |
0.8 |
|
Facility maintenance |
2.4 |
4.9 |
2.5 |
‑2.5 |
‑49.6% |
|
Totals |
$53.7 |
$63.4 |
$63.8 |
$0.4 |
0.7% |
|
Annual Deficit |
‑$1.2 |
‑$6.4 |
‑$8.3 |
‑$1.9 |
29.2% |
|
Year‑end reserve |
$24.9 |
$18.5 |
$10.2 |
‑$8.3 |
‑45.0% |
|
aIncludes funding from auxiliary programs for overhead, investment income, income from scholarly publications, and state lottery. |
|||||
Governor Proposes $1.1 Million (9.2 Percent) General Fund Base Increase. The Governor proposes to give Hastings flexibility to decide how to spend the state augmentation. The Governor’s budget also includes a technical adjustment that removes $2 million in one‑time funding provided in the 2016‑17 budget for deferred maintenance projects. As a result of this technical adjustment, General Fund support declines by $933,000 (6.8 percent) from the 2016‑17 level.
Hastings Anticipates Slight Decrease in Tuition and Fee Revenue in 2017‑18. Neither the Governor nor Hastings’ governing board proposes to raise tuition charges in 2017‑18, which would make 2017‑18 the fifth consecutive year of flat tuition charges. Despite proposing to hold tuition charges flat, Hastings anticipates tuition and fee revenue to decline by $600,000 (1.3 percent) from 2016‑17 levels. This reduction is due to a projected decrease in enrollment. The school indicates the decline is part of a continuing strategy intended to (1) respond to weaker workforce demand for attorneys and (2) increase the academic qualifications of its student body.
Hastings’ Spending Plan Under the Governor’s Budget
Hastings Would Increase Significantly Spending on Its Tuition Discount Program. As the lower half of Figure 25 shows, Hastings officials indicate that they intend to spend $63.8 million from the core budget in 2017‑18. This reflects a year‑over‑year increase of $431,000 (0.7 percent). The largest spending increase by far would be for its tuition discount program. Specifically, Hastings proposes to augment spending on tuition discounts by $2.9 million (17.9 percent) over current‑year levels. This increase would continue an initiative begun by the school in the current year which seeks to attract additional higher‑performing students by offering richer tuition discounts. Under Hastings’ spending plan, compensation and other cost increases would be covered by anticipated operational savings identified by the college. Hastings is not proposing any notable reductions in faculty or staffing levels.
Hastings’ Spending Plan Would Increase Its Operating Deficit . . . Due largely to the school’s decision to increase spending on tuition discounts, Hastings is on track to spend $63.4 million in core funds in 2016‑17 while only receiving $56.9 million in revenues—reflecting a $6.4 million operating deficit. Under Hastings’ 2017‑18 spending plan, this gap between spending and revenues would grow to $8.3 million.
. . . And Gradually Draw Down Its Reserves. Hastings maintains a reserve of core funding, which generally consists of tuition and other nonstate monies. The school plans to use this reserve to cover its anticipated operating deficits. Under its proposed spending plan, Hastings’ reserve would drop from $25 million at the start of 2016‑17 to $10.2 million by the end of 2017‑18.
Hastings Anticipates Deficit Spending Through 2019‑20. Because the size of Hastings’ deficit in 2017‑18 ($8.3 million) would be nearing the size of its reserve at the end of the year ($10.2 million), the school likely would soon exhaust its reserve absent corrective actions. Recognizing this risk, Hastings has developed a plan to bring spending in line with projected revenues. The key components of the plan are to (1) reduce spending on tuition discounts beginning in 2018‑19 and (2) increase tuition charges by 10 percent in 2019‑20, followed by an additional 7 percent increase in 2020‑21. Figure 26 shows that under this plan, spending would exceed revenues each year through 2019‑20, which would result in its reserve dropping down to about $300,000 by the end of that year. By 2020‑21, Hastings indicates it hopes to end its deficit spending and start building back a reserve.
LAO Assessment and Recommendation
Substantially Increasing Merit‑Based Tuition Discounts Is a Questionable Spending Priority . . . By substantially increasing its tuition discounts, Hastings is attempting to provide a stronger financial incentive for students with higher grades and standardized test scores to attend to school. In so doing, Hastings indicates that it hopes to boost its competitiveness and national ranking among law schools. While national reputation is understandable from an institution’s perspective, it is unclear what state goals this boost in prestige would advance. Furthermore, because these discounts typically are awarded based on merit rather than need, this increased aid likely is benefitting applicants who would attend law school anyway, rather than targeting resources toward the school’s neediest applicants.
. . . As Well as Shortsighted. Although the tuition discounts would provide a financial benefit to the fall 2017 cohort (and perhaps attract a higher‑performing class), the school acknowledges that for budgetary reasons it will have to begin reducing spending on discounts in 2018‑19. Because these enhanced discounts would only be offered to students for one additional year, Hastings’ proposed approach likely would not accomplish any long‑term policy goals. Instead, it would provide a short‑term benefit to one cohort of students while creating a deficit that likely will be paid down by future students through tuition increases. In addition to increasing costs for future students, Hastings’ budget shortfall also could put pressure on the Legislature to provide additional funding to help stabilize the school’s financial condition.
Recommend Legislature Review Hastings’ Spending Plan at Spring Budget Hearings. Given the concerns we describe above, we recommend the Legislature ask Hastings to report on its spending plan during spring budget hearings. In its review, the Legislature will want to ensure that Hastings’ budget plan for 2017‑18 and the next few years aligns with the state’s education and workforce priorities and brings spending in line with revenues. To ensure that Hastings’ plan achieves both goals, the Legislature might direct Hastings to consider various strategies, including: (1) reducing proposed spending on tuition discounts for the budget year, (2) increasing tuition charges sooner than currently planned by the school, and (3) adjusting staffing levels in line with enrollment reductions or, alternatively, increasing its student‑faculty ratio.
Back to the TopCalifornia Student Aid Commission
In this section, we provide an overview of the Governor’s budget for the California Student Aid Commission (CSAC), analyze his proposals for Cal Grants and Middle Class Scholarships, and estimate state financial aid costs associated with increases in UC and CSU tuition.
Overview
Governor Proposes $2.1 Billion for CSAC in 2017‑18. As Figure 27 shows, the Governor proposes a $28 million (1.4 percent) increase for CSAC over the revised 2016‑17 level. The largest increase is for Cal Grants ($34 million), offset by smaller decreases for the phase out of a loan assumption program ($3 million) and the removal of one‑time funding for CSAC state operations ($2 million). The two main fund sources for CSAC are state General Fund and federal Temporary Assistance for Needy Families (TANF) funds. Under the Governor’s proposal, General Fund spending increases by $23 million, while TANF funds remain flat.
Figure 27
California Student Aid Commission Budget
(Dollars in Millions)
|
2015‑16 Revised |
2016‑17 Revised |
2017‑18 Proposed |
Change From 2016‑17 |
||
|
Amount |
Percent |
||||
|
Expenditures |
|||||
|
Local Assistance |
|||||
|
Cal Grants |
$1,916a |
$1,952 |
$1,986 |
$34 |
1.7% |
|
Middle Class Scholarships |
48 |
74 |
74 |
— |
— |
|
Assumption Program of Loans for Education |
14 |
10 |
7 |
‑3 |
‑33 |
|
Chafee Foster Youth Program |
11 |
14 |
14 |
— |
— |
|
Student Opportunity and Access Program |
8 |
8 |
8 |
— |
— |
|
National Guard Education Assistance Awards |
2 |
2 |
2 |
— |
— |
|
Other Programsb |
1 |
1 |
1 |
—c |
3.7 |
|
Subtotals |
($2,002) |
($2,062) |
($2,093) |
($31) |
(1.5%) |
|
State Operations |
$14 |
$17 |
$14 |
‑$2 |
‑14% |
|
Totals |
$2,016 |
$2,079 |
$2,107 |
$28 |
1.4% |
|
Funding |
|||||
|
State General Fund |
$1,479 |
$1,130 |
$1,153 |
$23 |
2% |
|
Federal TANF |
521 |
926 |
926 |
— |
— |
|
Other federal funds and reimbursements |
15 |
18 |
18 |
‑1 |
‑2.8 |
|
College Access Tax Credit Fund |
1 |
5 |
11 |
6 |
119 |
|
aReflects amount assumed in the Governor’s budget. The California Student Aid Commission estimates expenditures to be $56 million lower. bIncludes Cash for College, Child Development Teacher/Supervisor Grants, Graduate Assumption Program of Loans for Education, John R. Justice Program, Law Enforcement Personnel Dependents Scholarships, and State Nursing Assumption Program of Loans for Education for Nursing Faculty. cLess than $500,000. TANF = Temporary Assistance for Needy Families. |
|||||
Governor Revises Spending Estimates for 2015‑16 and 2016‑17. The Governor assumes virtually no change in 2015‑16 spending, aside from a few minor decreases totaling less than $300,000. For 2016‑17, he assumes spending decreases by $54 million, primarily due to a $52 million decrease in Cal Grant costs.
Cal Grants
Below, we provide background on the program, review the Governor’s cost estimates, and then discuss a scheduled reduction to the award for students attending private, nonprofit schools.
Background
State Has a Long History of Providing Cal Grants. The Cal Grant program traces its roots back to 1955, when the Legislature established a merit‑based, competitive State Scholarship program for financially needy students attending either public or private institutions. In the late 1970s, the Legislature consolidated the State Scholarship program and other aid programs that it had created over the years into the Cal Grant program. In 2000, the Legislature restructured the Cal Grant program into an entitlement program for students meeting certain financial and merit‑based eligibility criteria, as well as a competitive program for students not meeting all the entitlement criteria.
Cal Grant Program Has Multiple Award Amounts and Eligibility Criteria. The Cal Grant programs offer three types of awards. One type, Cal Grant A, covers full systemwide tuition and fees at the public universities and up to a fixed dollar amount toward costs at private colleges. The second type, Cal Grant B, is designed for students with the lowest household income. It provides stipends (known as access awards) to help pay for books, supplies, and transportation as well as covers tuition in all but the first year of college. The third type of award, Cal Grant C, provides up to a fixed amount for tuition and fees and other costs for eligible low‑and middle‑income students enrolled in career technical education programs. A student generally may receive a Cal Grant A or B award for up to the equivalent of four years of full‑time study, whereas a Cal Grant C award is available for up to two years. Figure 28 displays the award amounts and eligibility criteria for each type of Cal Grant.
Figure 28
Cal Grant Award Amounts and Eligibility Criteria
2016‑17
|
Award Amounts |
|
Cal Grant A |
|
Tuition awards for up to four years. |
|
Full systemwide tuition and fees ($12,294) at UC. |
|
Full systemwide tuition and fees ($5,472) at CSU. |
|
Fixed amount ($9,084) at nonprofit or WASC‑accredited for‑profit colleges. |
|
Fixed amount ($4,000) at other for‑profit colleges. |
|
Cal Grant B |
|
Up to $1,678 toward books and living expenses for up to four years. |
|
Tuition coverage comparable to A award for all but first year. |
|
Cal Grant C |
|
Up to $2,462 for tuition and fees for up to two years. |
|
Up to $547 for other costs for up to two years. |
|
Financial Eligibility Criteria (for Dependent Students) |
|
Cal Grant A and C |
|
Family income ceiling: $81,300 to $104,600, depending on family size. |
|
Asset ceiling: $70,000. |
|
Financial need: varies by institution.a |
|
Cal Grant B |
|
Family income ceiling: $38,000 to $57,500, depending on family size. |
|
Asset ceiling: $70,000. |
|
Financial need: at least $700.a |
|
Nonfinancial Eligibility Criteria |
|
High School Entitlement (A and B) |
|
|
|
Transfer Entitlement (A and B) |
|
|
|
Competitive (A and B) |
|
|
|
|
Competitive (C) |
|
|
|
|
aFinancial need is the difference between (1) total cost of attendance (including living expenses) and (2) the expected family contribution, as calculated based on the Free Application for Federal Student Aid. For Cal Grant A and C awards, the minimum financial need a family must have is linked to tuition at UC and CSU and Cal Grant award levels at private, nonprofit and for‑profit institutions. WASC = Western Association of Schools and Colleges and GPA = grade point average. |
Cost Estimates
CSAC Estimates Cal Grant Caseload Based Largely on Previous Trends. Each fall and spring, CSAC estimates the Cal Grant caseload for the prior year, current year, and budget year. For the prior year, CSAC looks at actual monthly payments to institutions and makes projections for outstanding months based on historical monthly payment trends. For the current year, CSAC looks at how many awards have been offered to date and then assumes a certain percentage of these awards are paid based on recent paid rates. For the budget year, CSAC takes the current‑year estimate and projects it forward based upon various assumptions, such as the expected share of new awards converting into renewal awards and the attrition of existing renewal awards. For current‑ and budget‑year estimates, CSAC also includes the effects of any policy or administrative changes. For instance, CSAC includes the effects of any tuition increases at the public universities as well as any administrative efforts to increase the number of awards that are paid. CSAC then provides its estimates to the Department of Finance for inclusion in the Governor’s budget.
Governor Assumes No Change in Spending for 2015‑16. In spring 2016, the state revised 2015‑16 Cal Grant spending to $1.9 billion, based on CSAC’s spring estimates. The Governor’s 2017‑18 budget assumes the same level of spending.
More Recent Data Suggests Spending Is $56 Million Lower in 2015‑16, Recommend Recognizing Savings. In September 2016, CSAC revised its estimate of 2015‑16 Cal Grant spending down by $56 million. By that time in the year, CSAC has almost exact data on program costs, as historically 99.9 percent of Cal Grant payments have been made for the prior fiscal year. We recommend the Legislature recognize CSAC’s updated estimate of 2015‑16 program costs. Recognizing the drop in costs increases the state’s incoming General Fund balance by $56 million compared to the Governor’s budget.
Governor Assumes Lower Spending in 2016‑17, Higher Spending in 2017‑18. The Governor revises down estimated Cal Grant costs in 2016‑17 by $52 million to reflect an estimated 3 percent drop in recipients from 2016‑17 Budget Act assumptions. Compared to the revised 2016‑17 level of spending, he projects a $34 million increase in 2017‑18. The increase primarily is due to a projected 2 percent increase in participation, offset by savings from a scheduled decrease to the award for students attending private, nonprofit colleges. The Governor’s estimate for 2017‑18 does not assume any changes in tuition and fees except for a $54 increase (5 percent) in UC’s Student Services Fee.
Recommend Revisiting 2016‑17 and 2017‑18 Estimates at May Revision. CSAC will update its current‑year and budget‑year estimates in April for inclusion in the May Revision. As these estimates will be based on more recent trends in paid recipients, we recommend the Legislature revisit CSAC’s estimates at that time.
Private, Nonprofit Award
Private Award Used to Be Linked to Costs and Tuition at UC and CSU. Prior to the restructuring of the Cal Grant program in 2000, state law called for the maximum private award to be set by adding together (1) 75 percent of the General Fund cost per CSU student, and (2) the average of the tuition and fees charged by UC and CSU. (At that time, the state had one award for all private institutions, unlike today where it differentiates for nonprofit versus for‑profit institutions.) The policy served as an aspirational goal against which to measure state funding. In 1997‑98, for example, the state met 97 percent of the statutory goal. As part of the Cal Grant program restructuring in 2000, the Legislature removed these provisions from state law.
Current Law Lowers Private, Nonprofit Award Beginning in 2017‑18. As a savings measure, the 2012‑13 budget amended state law to lower the private, nonprofit award from $9,084 to $8,056 starting in 2014‑15. Subsequent budget actions have postponed the reduction. Most recently, the 2015‑16 budget delayed the reduction until 2017‑18. The reduction is set to apply prospectively to new award recipients only.
Governor Proposes to Allow Scheduled Reduction to Go Into Effect. CSAC estimates the reduction will affect about 8,500 new Cal Grant recipients in 2017‑18 and projects an associated $7.4 million in savings. The number of recipients affected and the associated savings will more than triple over the following three years as recipients “grandfathered” in at the higher rate exit the program.
Private Award Has Student and State Benefits. Throughout its history, the Cal Grant program has provided aid to students attending either public or private institutions, thereby providing financially needy students choice over their postsecondary education. At times, the state also has used the Cal Grant program to incentivize students to attend private colleges in order to alleviate enrollment pressures at the public segments.
Recommend Legislature Consider Establishing Policy for Private Award Amount. Unlike awards for the public segments (which are pegged to tuition), the state currently has no guiding policy for how to set awards for private institutions. We recommend the Legislature establish a statutory policy for private awards similar to the one in effect prior to 2000. If the Legislature were to use the same policy from back then, we calculate the award amount (or aspirational goal) would be $16,500. Given the 2016‑17 funding rate of $9,084, the state would be funding 55 percent of its goal. Depending on the specific policy adopted, the Legislature could determine the exact adjustment to make to the award in 2017‑18, potentially also adopting a multiyear plan to ramp up the award over time were the policy to result in a notably higher award amount.
Middle Class Scholarships
Middle Class Scholarships Started in 2014‑15. Under the program, students with household incomes and assets each under $156,000 may qualify for an award that covers their tuition (when combined with all other public financial aid). The program is being phased in, with awards in 2016‑17 set at 75 percent of full award levels, increasing to 100 percent at full implementation in 2017‑18. CSAC provides these scholarships to eligible students who fill out a federal financial aid application, though the program is not need‑based according to the federal government’s financial aid formula. Unlike Cal Grants, the program is not considered an entitlement, with program funding levels capped in state law. If funding were insufficient to cover the maximum award amounts specified in law, awards would be prorated downward. Current state law appropriates $74 million for 2016‑17, increasing to $117 million in 2017‑18 to reflect the phase in of award coverage.
Middle Class Scholarships Serve Students From Varying Household Incomes. In 2016‑17, about 5 percent of UC students and 12 percent of CSU students are expected to receive a Middle Class Scholarship. Figure 29 shows the share of recipients for each segment by three household income brackets. The figure shows that recipients at CSU tend to have lower household incomes than recipients at UC. For instance, students with household income of $50,000 or less make up only a small share of UC recipients but comprise nearly one‑fifth of CSU recipients. This difference between the segments likely is due to differences in their student populations (with CSU students tending to have lower household incomes) and their institutional aid programs (with CSU having less grant aid available per student).
Two Main Reasons Why Students in Lowest Income Bracket Receive a Middle Class Scholarship. Typically, students with household income at or below $50,000 have their tuition covered through Cal Grants or institutional aid programs and therefore would not qualify for a Middle Class Scholarship. According to CSU, many of the lowest‑income students receiving a Middle Class Scholarship have exceeded the time limits for other sources of aid. (A time limit for Middle Class Scholarships is taking effect for the first time starting in 2016‑17.) The vast majority also are considered independent—meaning they are over age 24, married, or have dependents. These independent students generally require a very low income to receive other forms of grant aid.
Various Reasons Students in Next Highest Bracket Receive an Award. Students with household income between $50,001 and $100,000 also might have exceeded time limits for other programs or be considered independent for financial purposes. Additionally, many students in this income bracket might not meet the eligibility requirements for other aid programs. For instance, students in this bracket could be excluded from the Cal Grant program because they exceed that program’s income ceiling, which varies depending on the student’s family size and high school grade point average. Moreover, most students in this income bracket would not qualify for CSU’s institutional aid and some at the higher end might not qualify for UC’s aid program.
Governor Proposes No Changes to 2016‑17 Spending. Though he proposes no change at this time, the Governor has indicated his intention as part of the May Revision to provide any additional funding necessary such that 2016‑17 awards are not prorated downward. CSAC’s most recent projections suggest expenditures could exceed the 2016‑17 statutory appropriation by $7 million.
Governor Proposes to Lower Spending, Phase Out Program Starting in 2017‑18. The Governor proposes to reduce the statutory appropriation for 2017‑18 from $117 million to $74 million. The $43 million reduction is linked to two factors. First, the Governor projects spending will be lower than expected based on current participation trends ($7 million). Second, he proposes phasing out the program and funding only renewal awards for prior‑year recipients ($36 million). Despite the phase out, the Governor proposes increasing the maximum amount of these renewal awards in accordance with original statutory intent (increasing from 30 percent to 40 percent of the tuition charge). To reflect out‑year savings associated with the phase out, the Governor also proposes to set the program’s statutory funding level at $45 million in 2018‑19, $28 million in 2019‑20, and $2 million in 2020‑21. According to the administration, the phase out is intended to address a state budget shortfall while prioritizing state aid for financially needy students served through the Cal Grant program.
Prioritizing Aid for Financially Neediest Students Most Effective Approach to Providing Access. Research indicates that grant programs can increase college attendance (and, in some cases, improve persistence and completion). Some research also suggests that grant programs can affect access more significantly for lower‑income students as compared to middle‑ and upper‑income students.
Prioritizing Aid Difficult Due to Patchwork of Financial Aid Programs. Though the Governor aims to prioritize aid for the financially neediest students, targeting financial aid reductions is difficult because financial need criteria are different for Middle Class Scholarships, Cal Grants, and UC’s and CSU’s institutional aid programs. Another complicating factor in prioritizing aid across programs is that programs have different nonfinancial requirements. For example, Cal Grants have a grade point average requirement, but Middle Class Scholarships do not. Even when programs have a similar eligibility requirement, the programs are not always coordinated. For instance, a student exceeding the four‑year time limit for a Cal Grant still could qualify for CSU’s institutional aid as that program allows for over six years of full‑time attendance.
Recommend Legislature Consider Ways to Restructure Aid Programs. Even if the Legislature does not concur with the Governor that reductions should be made to state financial aid programs to address a state budget shortfall, it could take the opportunity to explore ways to restructure state and institutional aid to make it more comprehensible and consistent for students. One potential restructuring approach is to consolidate existing aid programs into a single state grant. Alternatively, the Legislature could retain the current array of programs but establish a core set of uniform and coordinated eligibility requirements across them. Under either approach, the Legislature would be better positioned to assess ways to prioritize aid among students.
Tuition
UC and CSU Tuition Charges Affect State Financial Aid Costs. The state budget funds Cal Grant costs assuming full tuition coverage for students attending UC and CSU. This means that Cal Grant costs increase when the universities raise tuition (all else constant). Tuition increases also can affect Middle Class Scholarships as state law sets those awards to equal a percentage of tuition, though this program’s costs are capped in state law.
Governor’s Budget Assumes Flat Tuition in 2017‑18. The Governor assumes no changes to UC and CSU tuition, aside from a $54 (5 percent) increase in UC’s systemwide Student Services Fee. His budget assumes the increase in the UC fee in turn increases Cal Grant spending in 2017‑18 by $3.8 million.
UC Regents Recently Approved a 2.5 Percent Tuition Increase, CSU Trustees Considering a 4.9 Percent Increase. In January, the UC Regents approved a $282 (2.5 percent) increase in UC’s systemwide tuition charge. The CSU Trustees are expected to consider approving a $270 (4.9 percent) increase in its systemwide tuition charge at its March board meeting.
Tuition Increases Combined Would Increase State Cal Grant Costs by $47.4 Million. Specifically, we estimate UC’s and CSU’s tuition increases would cause state Cal Grant spending to go up by $20.2 million and $27.2 million, respectively, in 2017‑18. (For every 1 percent increase in UC’s and CSU’s systemwide tuition charges, we estimate Cal Grant costs increase $8 million and $5.5 million, respectively.)
Summary of Recommendations
Performance
- Reject Governor’s proposal to eliminate provisional budget language that requires UC and CSU to provide November performance reports (“academic sustainability plans”). Consider instead eliminating the segments’ March performance reports.
- Direct CCC Chancellor’s Office to revise its performance measurement system to promote greater transparency and more challenging targets.
- Adopt trailer legislation replacing UC’s and CSU’s funding per degree performance measure with a more meaningful efficiency measure. Consider involving CCC in discussions and also applying the new measure to that segment.
- Direct UC, CSU, and CCC to report at spring hearings on potential ways to measure outcomes of graduates, including the feasibility of adding an earnings or income mobility indicator.
University of California
- Set enrollment target for 2018‑19. Use upcoming reports on UC’s degree production and freshman eligibility to inform enrollment decision. Schedule any associated enrollment growth funding for 2018‑19 in trailer legislation.
- Direct UC at spring budget hearings to report on (1) its proposed nonresident enrollment policy and (2) how proposed nonresident enrollment growth in 2017‑18 aligns with that policy.
- Direct UC to (1) identify the specific objectives of its Academic Excellence initiative, (2) explain how progress toward those objectives will be measured and evaluated, and (3) detail the specific uses of the proposed funds. If UC is unable to provide sufficient justification for the program, redirect the associated funds to a higher priority.
- Consider whether Proposition 56 funding for graduate medical education should (1) replace existing UC funding, holding constant current medical residency slots and freeing up a like amount for other UC cost increases; or (2) augment existing funding to expand medical residency slots.
- Encourage UC to redirect $15 million in bond funding from a proposed one‑time facility assessment to specified facility projects.
- Require UC to develop a long‑term plan to (1) retire its maintenance backlog and (2) improve its ongoing maintenance practices moving forward to prevent a backlog from reemerging.
California State University
- Recognize four significant cost pressures—funding (1) collective bargaining agreements ratified by the Board of Trustees last spring, (2) basic cost increases (such as for health care and pensions), (3) compensation increases for employee groups with open contracts, and (4) transfer enrollment (as some eligible transfer students have been denied admission in recent years).
- Signal to CSU that a 5 percent increase in tuition charges is too high given anticipated inflation in the budget year. Instead, consider a tuition increase of a lesser amount (such as 2.5 percent) to generate funding for (1) additional transfer enrollment growth and (2) a compensation pool for bargaining groups with open contracts.
- Wait on deciding whether to provide enrollment growth funding for freshman entrants pending the Legislature’s receipt and review of upcoming reports on CSU’s degree production and freshman eligibility.
- Require CSU to report to the Legislature by January 1, 2018 on (1) plans to implement research‑based methods for assessing and placing students into remedial coursework and (2) opportunities for campuses to make available more course slots by reducing the number of excess units students earn.
California Community Colleges
- Wait until early May for updated estimate of 2016‑17 enrollment and then adjust apportionments for that year and 2017‑18 accordingly. Use any freed‑up funds for other Proposition 98 priorities.
- Continue to monitor CCC course offerings to ensure that colleges do not unduly expand enrollment in nonpriority areas to meet enrollment targets.
- Adopt Governor’s proposal to repeal authority for Chancellor’s Office to allocate excess local revenues to districts for one‑time purposes. Authority has not been used to date, as the state routinely reallocates excess revenues through the budget process.
- Approve $98 million COLA for apportionments and select categorical programs (adjusting the final amount in May). Also approve $24 million general purpose apportionment increase and consider a larger increase if additional state revenue is available in May.
- Reject $10 million augmentation to permanently, fully subsidize a statewide course management system. The existing subsidy already enables most colleges to realize significant savings from adopting the new software.
- Reject $20 million innovation awards proposal. Rather than providing large sums to a small number of colleges to implement local initiatives, focus on ensuring that existing CCC student success programs are implemented effectively.
- Direct CCC to develop statewide integrated library system (ILS) whether or not the state provides funding. The ILS would substantially lower costs for most colleges giving them a strong incentive to develop it on their own. If the Legislature wished to facilitate development, it could consider the $6 million proposal in the context of its other priorities.
- Ask the administration and Chancellor to report on the results of their organizational review of the Chancellor’s Office. As part of their report, ask them to offer better justification for any positions or funding they propose adding to the office. Ask the Chancellor also to identify lower‑value oversight activities that could be curtailed without adverse effect.
- Ask the administration and Chancellor to provide information in hearings about (1) how the proposed $150 million guided pathways program would be structured, implemented, and led; (2) what changes might be needed in how the state organizes and funds CCC student success efforts; and (3) the rationale for the proposed funding amount and timeline. With this information, the Legislature would be in a better position to weigh the proposal against its other priorities.
- Ask the administration during spring budget hearings to clarify its plans for rolling out the $2 billion in Proposition 51 bond funding for CCC facility projects as expeditiously as possible. Based on the information provided, consider authorizing additional CCC projects in 2017‑18 and developing a five‑year expenditure plan.
Hastings College of the Law
- Direct Hastings to report at spring budget hearings on how it plans to right its budget over the next few years while still ensuring the school furthers the state’s education and workforce priorities.
California Student Aid Commission
- Recognize $56 million in Cal Grant savings from 2015‑16 based on recent expenditure information. Revisit cost estimates for 2016‑17 and 2017‑18 at the May Revision.
- Establish a policy for setting Cal Grant award amount for students attending private institutions. Determine 2017‑18 award amount based on this policy.
- Restructure state and institutional financial aid programs by either consolidating them into one program or establishing a core set of uniform and coordinated eligibility requirements. Then, prioritize aid for the financially neediest students in the state.