
 Report in PDF
LAO Report
November 14, 2017Evaluating California’s Pursuit of Zero Net Energy State Buildings
- Introduction
- Overview of ZNE
- ZNE in State‑Owned Buildings
- LAO Assessment
- LAO Recommendations
- Conclusion
Executive Summary
Administration Set Zero Net Energy (ZNE) Goals for State Buildings. In 2012, Governor Brown issued Executive Order B‑18‑12, which directed state agencies to take various steps primarily designed to achieve the environmental goal of reducing greenhouse gas (GHG) emissions in the state. One of the directions included in the executive order was to increase the number of state‑owned buildings that are ZNE—that is, they generate as much energy onsite through renewable sources as they consume over a one‑year period. Specifically, the executive order requires state agencies to take measures toward achieving ZNE for 50 percent of all square footage of state‑owned buildings by 2025. It further requires that 50 percent of new state‑owned buildings beginning design after 2020 and all new state‑owned buildings and major renovations beginning design after 2025 be constructed as ZNE. The Legislature has not adopted policies related to ZNE for state buildings.
Since the Governor signed the executive order, the administration has been moving forward with its implementation. Notably, in October 2017, the administration issued guidance to state departments on how to implement the executive order. While departments have completed a relatively small number of ZNE buildings thus far, several have plans to build many more ZNE buildings over the next few years. Accordingly, we anticipate that the Legislature will be asked to make decisions about whether to fund a growing number of ZNE buildings in the future.
Administration’s Approach Raises Some Specific Concerns. We find that a mandate for state buildings to be ZNE is not a necessary or cost‑effective way for the state to achieve its GHG reduction goals. This is largely because the state has already adopted a cap‑and‑trade program that limits total emissions from large emitters, such as electricity generators. So, a ZNE mandate will not necessarily reduce emissions more than would otherwise occur. Additionally, a ZNE mandate can potentially increase state costs and present other trade‑offs through its emphasis on on‑site renewable energy. Accordingly, we find that it is more important that the state assess whether achieving ZNE for each proposed building project would be cost‑effective by performing cost‑benefit analyses. These analyses would ensure that the state’s tax and fee dollars are used efficiently to reduce long‑term costs. Moreover, analyses that prevent the state from undertaking ZNE projects that are not cost‑effective would save state funds that could be used in other ways, whether that is to achieve GHG emission reductions from other projects or other state purposes. Despite their critical value, to date, departments have generally not conducted these analyses of their projects.
Recommend Legislature Adopt Its Own ZNE Policies for State Buildings That Emphasize Cost Effectiveness. Based on our assessment, we recommend that the Legislature establish its own policies related to ZNE for state buildings that reflect its priorities. At a minimum, we recommend that these policies direct the administration to conduct cost‑benefit analyses with certain information on all ZNE projects proposed to the Legislature in the future. We further recommend that these policies require the administration to emphasize pursuing ZNE projects that are shown to be cost‑effective. We believe that these recommendations would help ensure that the state makes better use of its funds without compromising the state’s GHG reduction goals. Furthermore, if the state achieves ZNE cost‑effectively for a variety of projects, it will serve as a valuable model for other entities, whether public or private, that are considering whether to implement ZNE projects.
Introduction
In 2012, Governor Brown issued Executive Order B‑18‑12, which directed state agencies to take various steps primarily designed to achieve the environmental goal of reducing greenhouse gas (GHG) emissions in the state. One of the directions included in the executive order was to increase the number of state‑owned buildings that are “zero net energy” (ZNE)—that is, they generate as much energy onsite through renewable sources as they consume over a one‑year period. Specifically, the executive order requires state agencies to take measures toward achieving ZNE for 50 percent of all square footage of state‑owned buildings by 2025. It further requires that 50 percent of new state‑owned buildings beginning design after 2020 and all new state‑owned buildings and major renovations beginning design after 2025 be constructed as ZNE. The Legislature has not adopted policies related to ZNE for state buildings.
In this report, we provide background information on ZNE buildings as well as the administration’s approach to meeting the executive order’s goals for state‑owned ZNE buildings. Then, we assess the administration’s approach to these buildings. Finally, we recommend that the Legislature adopt its own policies related to ZNE for state buildings and take steps to ensure that it has adequate information to evaluate future administration proposals for state‑owned ZNE buildings.
In preparing this report, we spoke with staff involved in implementing ZNE buildings at a variety of state departments. These staff provided us with an understanding of the administration’s approach to pursuing the executive order’s goals related to ZNE buildings. We also spoke with outside experts working on ZNE, such as those from the federal government and utilities. Additionally, we visited buildings that have pursued ZNE and reviewed various ZNE‑related reports and studies.
Overview of ZNE
Achieving ZNE
ZNE Buildings Use Multiple Approaches to Generate as Much Energy as They Consume. The concept of a ZNE building is simple. A ZNE building generates at least as much energy onsite as it consumes—typically from both electricity and natural gas—over a one‑year period. (As we discuss in the nearby box, ZNE can be defined in different ways based on how energy generation and consumption are measured.) Typically, the first step to designing a new (or making an existing) building as ZNE is to reduce its energy use through a variety of energy efficiency measures. The second step is to pair these efficiency measures with efforts to operate the building in ways that use less energy than would typically be required for a similar building. Finally, after the building’s energy use is reduced through efficiency and building operations, the third step is to add on‑site renewable energy generation to offset the remaining level of anticipated energy use. While a ZNE building typically includes these three approaches to some extent, the specific mix of these approaches varies across buildings.
Defining Zero Net Energy (ZNE)
Definitions of ZNE Vary Based on How Energy Is Measured. There are different ways to define ZNE. Under all of these definitions, the amount of energy used at the site must not exceed the amount of energy generated at the site over a one‑year period. However, these definitions vary based on the specifics of how a building’s energy use and renewable energy generation are measured. There are three main ways ZNE is defined:
- Site Definition Involves Direct Measurement at Utility Meters. Under the site definition, the amount of energy used at the site must not exceed the amount of energy generated at the site over a one‑year period when measured onsite. This definition can be measured by directly reviewing energy use and renewable energy generation information at utility meters.
- Source Definition Accounts for Energy Losses. Under the source definition, the amount of energy used at the site must not exceed the amount of energy generated at the site over a one‑year period when measured at the source of the energy. Specifically, the source definition takes into account that it takes more energy to produce and transport some forms of energy from their sources to the locations where they are used than other forms of energy. Accordingly, under the source definition, the quantity of each type of energy used (and generated) as measured onsite is adjusted by a factor reflecting the amount of raw fuel that was consumed to produce and transport it from its source to the site.
- Time‑Dependent Valuation (TDV) Definition Accounts for Variation in Value of Energy Over Time. Under the TDV definition, the estimated societal value of the energy used at the site must not exceed the value of the energy generated at the site over a one‑year period. This definition takes into account that energy is more valuable—both in terms of cost and greenhouse gas emissions—during certain hours of the year. Specifically, energy is more valuable when energy supply is low relative to demand than during hours when there is ample supply to meet demand. Notably, TDV is calculated by applying different multipliers to the amount of energy use and on‑site generation based on their timing.
State Uses Different Definitions for Various Purposes. The administration has chosen different definitions of ZNE for various purposes. These choices are largely driven by the administration’s assessment of the strengths and weaknesses of the different definitions. Notably, while the TDV definition has the benefit of better capturing the full costs of energy than the other definitions, TDV is more complex to calculate because it requires daily data on the timing of the use and generation of on‑site renewable energy. Accordingly, the administration has elected to use the source definition for assessing ZNE goals related to existing and new state‑owned buildings. However, it uses the TDV definition in the development of new building standards that apply to the construction of new residential buildings.
ZNE Can Be Considered at Different Scales. Typically, ZNE is assessed for a specific building. However, ZNE can be considered at other scales. For example, a ZNE campus is typically defined as a group of adjacent buildings that together as a campus—such as at a university or medical complex—generate at least as much renewable energy as they use within the campus boundary. Similarly, a ZNE community is typically defined as a larger geographic community that generates at least as much renewable energy as it uses within its boundaries. For example, the city of Lancaster set a goal of becoming the first ZNE city.
Definitions Can Affect Energy Generation Needed for Project to Be ZNE. In some cases, the definition of ZNE that is applied and scale at which ZNE is considered can make a very large difference in the feasibility of ZNE. For example, the site definition for ZNE generally requires significantly more renewable energy to be generated to offset a ZNE building’s energy use than the source definition. Specifically, under the site definition, one unit of renewable energy generated by a ZNE building offsets one unit of energy used by the building regardless of the type of energy, such as electricity or natural gas. In contrast, the source definition takes into account that, on average, it takes significantly more energy to produce and transmit a unit of electricity than a unit of natural gas to the building. Accordingly, under the source definition, one unit of electricity generated by a ZNE building offsets more units of natural gas used by a building. Notably, in the case of state buildings, the Department of General Services has estimated that its choice to use the source definition of ZNE will result in the state being required to secure about 40 percent less renewable energy than would otherwise be the case if it used the site definition. In addition, there may be some projects that might not readily achieve ZNE at the building level, but might be able to do so in combination with other buildings at a campus or community scale. For example, one building might not have sufficient space onsite to accommodate solar photovoltaics to offset its energy use, but another adjacent building might have enough space onsite to more than offset its energy use. In this case, together as a campus, both of these buildings could potentially achieve ZNE, while only one of them would achieve ZNE as an individual building.
Common Energy Efficiency Measures. Energy efficiency measures are typically a key component of ZNE buildings—often reducing a building’s energy use substantially. The specific energy efficiency measures that are used vary by project, but generally fit within the following four main categories:
- Building Designs. ZNE buildings are designed to minimize the need for energy use by taking advantage of natural lighting and ventilation. For example, a building may be oriented in a specific direction and may incorporate certain window treatments to maximize sunlight and reduce the need for artificial light.
- Building Systems. Buildings include energy efficient building systems, such as for lighting and for heating and cooling. For example, a building may include light‑emitting diode (commonly referred to as LED) lights or radiant heating and cooling systems.
- Appliances. These buildings can incorporate energy efficient appliances—such as computers and refrigerators—to reduce the amount of energy consumed through electrical plugs.
- Other Technology. ZNE buildings frequently include technology that reduces or eliminates unnecessary energy use. For example, they include building management systems that allow building operators to monitor and centrally control energy use from lighting systems and from heating and cooling systems. They also often include various sensors that automatically turn off these systems when buildings are not in use.
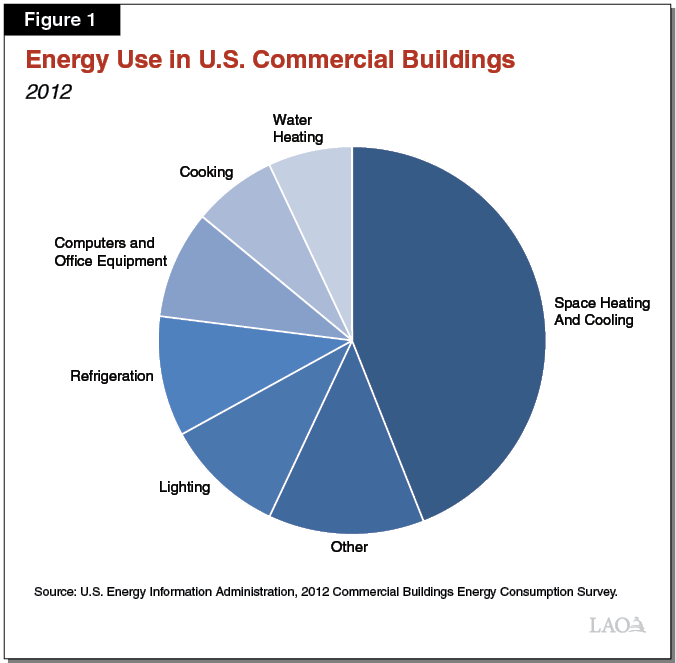
For reference, in 2012, the federal government conducted a study of energy use in commercial buildings. The study found that, on average, the largest contributor to building energy use is space heating and cooling, as shown in Figure 1. (We note that energy efficient buildings typically have somewhat different main uses of energy than other buildings.)
Measures Related to Building Operations. Another key aspect of ZNE buildings is controlling how the buildings are operated. This is important because a building’s energy use is not only affected by its design, but also by how it is used by its occupants. For example, the energy efficiency of a building may be compromised if occupants override sensor systems or plug in personal appliances (such as space heaters and coffee makers). There are various types of measures that can be taken to adjust building operations to reduce energy use, such as implementing policies that prohibit the use of personal appliances.
Renewable Energy Measures Typically Include Solar. A variety of renewable energy sources—such as wind, solar, or geothermal—can be used to offset a building’s energy use and enable it to achieve ZNE. However, in practice, ZNE buildings typically include on‑site solar photovoltaic (PV) rather than other renewable energy sources. This is because solar PV is generally the most widely available source of on‑site renewable energy—a source that is not as heavily dependent on site conditions as other forms of renewable energy, such as wind or geothermal. It is also typically the lowest cost source of on‑site renewable energy available to ZNE projects.
Ownership of solar PV systems—and the electricity generated—can be structured in various ways. Specifically, the system can be owned by the building owner or by a third party, such as a private company. In the cases where the solar PV system is owned by a third party, the building owner typically enters into an agreement with the third party called a power purchase agreement. Under such an agreement, the third party not only owns the solar PV system, but is also typically responsible for installing and maintaining it. The third party is compensated by selling the electricity generated from the system back to the building owner. Additionally, the third party typically keeps any available federal, state, or local tax incentives associated with the system. Notably, on‑site solar PV is governed by a set of electricity billing rules known as “net metering.” Under California’s net metering policies, the electricity generated beyond the amount used at the site in a year—often referred to as “overgeneration”—is typically credited at a wholesale rate rather than the much higher retail electricity rate.
Examples of ZNE Buildings
Small but Growing Number of ZNE Buildings. There are a relatively small number of ZNE buildings currently in operation nationally. According to New Buildings Institute—an organization that tracks ZNE projects—there were 52 non‑residential (commercial and government) ZNE buildings verified in the U.S. as of 2016. Of these 52 buildings, 18 buildings—about one‑third of the total—were in California. These totals represent roughly a doubling of the number of verified ZNE buildings in operation in 2011. Nonetheless, ZNE buildings still represent less than one‑hundredth of 1 percent of the overall estimated number of non‑residential buildings in operation.
In addition, the non‑residential ZNE buildings that are in operation are not representative of the overall building market. Instead, they tend to be certain types of buildings. For example, most of these ZNE buildings are relatively small buildings—roughly nine out of ten are less than 25,000 square feet. Additionally, most were undertaken by public agencies and organizations that prioritize achieving environmental goals. Thus, while various examples of ZNE buildings exist, ZNE is still far from reaching widespread adoption in the building industry as a whole.
Costs of ZNE Vary Significantly Across Projects. Studies suggest that the incremental construction cost of making a building ZNE varies significantly across projects. In some cases, these studies have found that it is possible to construct ZNE buildings at little or no additional cost. However, in other cases, costs associated with ZNE appear to be significant—in the range of about 20 percent higher than comparable non‑ZNE buildings. We note that, while these studies provide useful information, they rely on limited data. This is in part because there are a relatively small number of completed ZNE projects. Additionally, many of the entities that have undertaken early ZNE buildings have focused on proving the technical feasibility of ZNE rather than documenting its costs. Accordingly, these entities have not always estimated the incremental costs associated with ZNE, making reliable data difficult to secure.
Despite the limitations of the existing studies on ZNE costs, there is widespread agreement that a major reason for the variation in costs of ZNE buildings is that some projects lend themselves to ZNE more than others. For example, it is typically easier to make buildings that are relatively low energy users—such as warehouses—ZNE than those that are relatively high‑energy users—such as health‑related buildings. It is also generally more difficult to make high‑rise buildings ZNE than low‑rise buildings. This is because high‑rise buildings have less rooftop area compared to total building square footage and, thus, less area for on‑site solar PV. Additionally, it is typically easier to construct new buildings as ZNE than to retrofit existing buildings as ZNE. This is because existing buildings generally have architectural features and building systems in place that can be difficult to modify. Finally, projects in some geographic locations are more likely to lend themselves to ZNE because they receive ample sunlight and have temperate climates that require less heating and cooling.
ZNE in State‑Owned Buildings
ZNE Goals for State‑Owned Buildings
Administration Has Set ZNE Goals for State Buildings by Executive Order. In 2012, the administration established ambitious ZNE goals for state‑owned buildings through the Governor’s Executive Order B‑18‑12. Under this executive order, state agencies must take measures toward achieving ZNE for 50 percent of the square footage of state‑owned buildings by 2025. Additionally, the executive order calls for all new state buildings and major renovations beginning design after 2025 to be constructed as ZNE (with an interim target that 50 percent of new facilities beginning design after 2020 achieve ZNE).
The executive order also establishes various other energy efficiency and sustainability goals for state buildings. For example, it requires larger new or renovated buildings to achieve Leadership in Energy and Environmental Design (LEED) Silver certification and also requires them to pursue on‑site renewable energy generation if economically feasible. (LEED is a building rating system created by a private organization called the U.S. Green Building Council.) The executive order also requires all new state buildings to use 15 percent less energy than would otherwise be required under the state’s environmental building standards, known as Title 24. (As discussed in the nearby box, there are also various state, federal, and local ZNE goals that apply to both private and public buildings.)
Other Zero Net Energy (ZNE) Goals Established for Private and Public Buildings
In addition to the state’s ZNE goals for the buildings it owns, there are various other state, federal, and local goals in place for ZNE buildings.
Administration Has Set ZNE Goals for Private and Public Buildings. The administration’s Long‑Term Energy Efficiency Strategic Plan—which was developed in 2008 and updated in 2011—adopts two main ZNE goals for new private and public residential and commercial buildings. Specifically, it states that (1) all new residential construction in California be ZNE by 2020 and (2) all new commercial buildings in California be constructed as ZNE by 2030. The California Energy Commission and California Public Utilities Commission have developed action plans for the residential and commercial building sectors that identify some specific activities—such as changes to building codes—to move the state towards achieving these goals.
Federal Government and Other Entities Have Also Established ZNE Goals. California is not the only public entity in the United States that has adopted ZNE goals. In 2007, Congress passed the Energy Independence and Security Act. The act set three goals related to ZNE nationwide: (1) all new commercial buildings built after 2030 achieve ZNE, (2) 50 percent of all buildings be ZNE by 2040, and (3) all pre‑2030 buildings be retrofitted to ZNE by 2050. The federal government supports these objectives principally through funding for research and development of energy efficient building technologies, as well as various tax incentives to incentivize the adoption of energy efficiency and renewable energy technologies. President Obama also issued Executive Orders 13514 (2009) and 13693 (2015), which established ZNE goals for federal buildings. Specifically, President Obama’s executive orders require that all new federal buildings greater than 5,000 gross square feet that begin design in federal fiscal year 2019‑20 or later be designed to achieve ZNE. Additionally, some other states and local governments have explored ZNE‑related goals and requirements. For example, Washington State has a goal of building more zero‑emission homes and buildings by the year 2031, and the City of Santa Monica requires all new single‑family construction in the city to be ZNE.
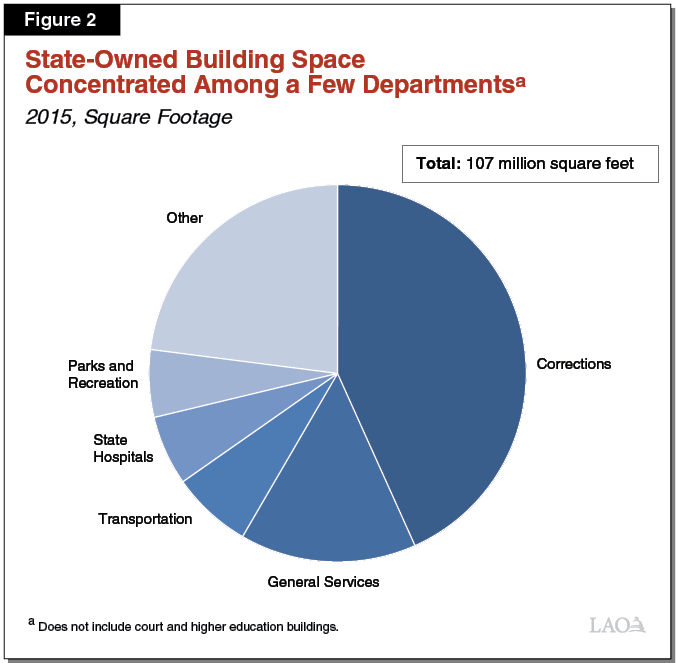
Executive Order Applies to Most Categories of State‑Owned Buildings. The executive order applies to the state‑owned buildings under the control of the executive branch. Accordingly, it applies to more than 8,000 buildings totaling about 110 million square feet of space, spread across roughly 1,500 properties. The executive order covers various types of buildings, such as prisons, office buildings, warehouses, and health facilities. As shown in Figure 2 , these buildings are managed by a wide range of state departments with most of the square footage of these buildings concentrated among a few departments, including the California Department of Corrections and Rehabilitation, Department of General Services (DGS), and California Department of Transportation. Notably, while the executive order covers most types of state buildings, it excludes certain categories of state buildings, such as those owned and operated by courts and universities. In some cases, those entities have their own ZNE goals and efforts. For example, the University of California, Merced has established a goal of becoming a ZNE campus by 2020.
Executive Order Primarily to Reduce Carbon Emissions and Costs. The executive order identifies several rationales for the goals established. The main purposes of the executive order are to reduce GHG emissions and to save the state money by reducing utility costs. The executive order also suggests that its policies should help boost the state’s economy through creating “green” jobs. Finally, in addition to these goals, which are explicitly laid out in the executive order, Governor Brown has indicated that another goal of the executive order is to have the state serve as an environmental leader.
Legislature Has Not Adopted Any ZNE Policies for State Buildings. While the administration has established ZNE goals for state‑owned buildings administratively, the Legislature to date has not adopted any specific policies related to ZNE. Accordingly, the Legislature currently makes its decisions regarding whether and how to pursue ZNE when it decides whether to fund each individual new construction or renovation project proposed for funding by the administration.
State’s Progress Towards Meeting ZNE Goals and Future Plans
Few State ZNE Projects Completed to Date. Since the adoption of the executive order, only nine state ZNE buildings have been completed, as shown Figure 3. (As of when this report was completed, only two of these buildings had been verified as ZNE based on a year of energy generation and use data.) Furthermore, the state has made limited use of on‑site renewable energy at this point. As of 2016, on‑site renewable energy provided roughly 4 percent of the state’s building energy use. Accordingly, meeting the Governor’s executive order goal to achieve 50 percent of existing space to be ZNE by 2025 would require a large increase in the amount of renewable energy generation at existing state buildings.
Figure 3
California’s Completed State‑Owned ZNE Buildings
|
Project |
Department |
Location |
Square Footage |
Year Completed |
New Construction or Renovation |
|
Fresno Field Office Replacement |
Motor Vehicles |
Fresno |
20,000 |
2014 |
New |
|
Santa Fe Springs District Office |
Lottery |
Santa Fe Springs |
12,800 |
2015 |
Renovated |
|
Richmond Campus, Building P |
Public Health |
Richmond |
205,000 |
2016 |
Renovated |
|
California State Prison, Los Angeles County |
|||||
|
Complex Primary Care Clinic |
CDCR |
Lancaster |
5,500 |
2016 |
New |
|
Healthcare Administration and Records Building |
CDCR |
Lancaster |
5,700 |
2016 |
New |
|
Complex Primary Care Clinic |
CDCR |
Lancaster |
5,500 |
2016 |
New |
|
ASU Primary Care Clinic |
CDCR |
Lancaster |
2,600 |
2016 |
New |
|
Southern Distribution Center |
Lottery |
Rancho Cucamonga |
60,600 |
2016 |
New |
|
Fresno District Office |
Lottery |
Fresno |
11,500 |
2017 |
Renovated |
|
ZNE = zero net energy; CDCR = California Department of Corrections and Rehabilitation; and ASU = Administrative Segregation Unit. |
|||||
ZNE Buildings and Plans in Progress. While departments have completed a relatively small number of ZNE buildings thus far, several have plans to build significantly more ZNE buildings. Specifically, we have identified 22 additional ZNE buildings planned by the administration, as shown in Figure 4 . (We note that the state has plans for a number of other new buildings or major renovations that are not currently expected to be ZNE.) Additionally, some departments—including DGS, California State Lottery Commission (Lottery), and Department of Motor Vehicles (DMV)—indicated an intent to build all new facilities in the future as ZNE.
Figure 4
California’s In‑Progress State‑Owned Zero Net Energy Buildings
|
Project |
Department |
Location |
Estimated Square Footage |
Estimated Completion |
New or Renovation |
|
California State Prison, Solano, Complex Facility Clinic |
CDCR |
Vacaville |
13,700 |
Late 2017 |
New |
|
SFOBB Maintenance Complex Warehouse |
Transportation |
Oakland |
32,000 |
Late 2017 |
New |
|
Grass Valley Field Office Replacement |
Motor Vehicles |
Grass Valley |
7,600 |
Late 2017 |
New |
|
CMC East Facility Primary Care Clinic and Health Administration Building |
CDCR |
San Luis Obispo |
13,000 |
Early 2018 |
New |
|
CMC ASU‑EOP Mental Health Clinic |
CDCR |
San Luis Obispo |
11,000 |
Mid 2018 |
New |
|
San Diego District Office |
Lottery |
San Diego |
14,600 |
Late 2018 |
Renovated |
|
Chatsworth District Office |
Lottery |
Chatsworth |
13,400 |
Late 2018 |
Renovated |
|
Rancho Cucamonga District Office |
Lottery |
Rancho Cucamonga |
13,300 |
Late 2018 |
Renovated |
|
CVSP Healthcare Administration and Records Building |
CDCR |
Blythe |
2,900 |
Early 2019 |
New |
|
Costa Mesa District Office |
Lottery |
Costa Mesa |
17,200 |
Early 2019 |
Renovated |
|
Milpitas District Office |
Lottery |
Milpitas |
10,100 |
Early 2019 |
New |
|
North Bay District Office |
Lottery |
North Bay |
TBD |
Mid 2019 |
TBD |
|
Inglewood Field Office Replacement |
Motor Vehicles |
Inglewood |
15,600 |
Late 2019 |
New |
|
Consolidated Headquarters Complex |
Military |
Sacramento |
285,600 |
Late 2019 |
New |
|
Delano Field Office Replacement |
Motor Vehicles |
Delano |
10,700 |
Early 2020 |
New |
|
Santa Maria Field Office Replacement |
Motor Vehicles |
Santa Maria |
13,300 |
Early 2020 |
New |
|
San Diego Field Office Replacement |
Motor Vehicles |
San Diego |
18,500 |
Mid 2020 |
New |
|
Southern California Consolidation Project |
Air Resources Board |
Riverside |
380,000 |
Late 2020 |
New |
|
O Street Office Building |
General Services |
Sacramento |
339,000 |
Early 2021 |
New |
|
New Natural Resources Agency Office Building |
General Services |
Sacramento |
800,000 |
Late 2021 |
New |
|
Reedley Field Office Replacement |
Motor Vehicles |
Reedley |
13,700 |
Mid 2022 |
New |
|
Ironwood State Prison Facilities A and B |
CDCR |
Blythe |
8,500 |
TBD |
Renovated |
|
CDCR = California Department of Corrections and Rehabilitation; SFOBB = San Francisco‑Oakland Bay Bridge; CMC = California Men’s Colony; ASU = Administrative Segregation Unit; EOP = Enhanced Outpatient Program; CVSP = Chuckawalla Valley State Prison; and TBD = to be determined. |
|||||
In addition to the buildings that are currently identified as pursuing ZNE, the administration has also directed departments to create publicly available plans for how they will meet the Governor’s executive order goals for ZNE buildings—along with the Governor’s other sustainability goals—by late 2017. These plans are anticipated to identify the specific steps that departments expect to take, such as which buildings will be constructed or renovated as ZNE. Similar plans have been completed in the past, but have not generally been made publicly available.
Recent Administration Direction on Implementation of ZNE Goals. In October 2017, the administration issued a management memo—and an associated revision to the State Administrative Manual—that provides state departments with specific guidance regarding how to implement the Governor’s executive order ZNE goals. The memo directs departments pursuing ZNE to focus first on a building’s energy efficiency and then to add renewable energy generation, as necessary, to offset its energy use. With regard to energy efficiency, the memo sets energy use targets for all existing buildings pursuing ZNE and reiterates the Governor’s executive order requirement that all new buildings be constructed to use at least 15 percent less energy than would otherwise be required under Title 24. With regard to renewable energy generation, the memo provides alternatives to generating renewable energy on a building’s site, including through the purchase of off‑site renewable energy from a local utility if on‑site renewable energy generation is not feasible. We note that this approach is not consistent with the typical definition of ZNE, which requires on‑site renewable energy generation.
Other State Policies to Reduce GHG Emissions
The Legislature has established ambitious targets for reducing GHG emissions within the state. Specifically, state law established the goals of limiting statewide GHG emissions to (1) 1990 levels by 2020 and (2) at least 40 percent below 1990 levels by 2030.
In order to meet the state’s GHG reduction goals, the Legislature and administration have adopted various policies. Notably, the Legislature has authorized the administration to implement a cap‑and‑trade system through 2030. The state’s cap‑and‑trade system is a market‑based mechanism that sets a limit on GHG emissions in the state from large emitters, such as electricity generators. Under the system, the state issues a limited number of permits (referred to as “allowances”) to emit GHGs. Emitters must obtain a sufficient number of allowances—either through a state‑run auction or on the private market—to cover their emissions. As a result, the overall level of emissions cannot exceed the cap. In addition, the program effectively creates a price for GHG emissions, which provides a financial incentive for households and businesses to implement the least costly GHG reduction activities. (We provide more detail on the state’s cap‑and‑trade system in the nearby box.) In addition to cap‑and‑trade, the Legislature has also adopted various other policies aimed at reducing GHG emissions, such as setting requirements that the state double statewide energy efficiency savings in electricity and natural gas and procure 50 percent of its electricity from renewable sources by 2030. We note that, while the Legislature has adopted these varied policies aimed at reducing GHG emissions, it has not adopted any policies directed at ZNE specifically.
Cap‑and‑Trade Uses Market to Ensure State Meets GHG Reduction Targets
Purpose of Market‑Based Mechanisms. Cap‑and‑trade is a market‑based approach to reducing greenhouse gas (GHG) emissions. Cap‑and‑trade differs from other regulatory approaches, such as traditional command‑and‑control regulations, where the government requires business to install a certain type of emission reduction technology or meet a certain minimum emissions standard. In contrast, a market‑based approach like cap‑and‑trade (a carbon tax is another such approach) adds a financial cost to producing GHGs, which provides a financial incentive for private businesses and consumers to reduce emissions, and the private sector has flexibility to determine which emission reduction activities are least costly.
Description of Cap‑and‑Trade. The cap‑and‑trade regulation places a “cap” on aggregate GHG emissions from large GHG emitters, such as large industrial facilities, electricity producers, and transportation fuel suppliers. To implement the cap, the Air Resources Board (ARB) issues a limited number of “allowances” (essentially, emission permits) equal to the cap with each allowance permitting the emission of one ton of carbon dioxide equivalent. Emitters can purchase allowances at a state‑run auction or “trade” (buy and sell) them on the private market. (ARB also gives some allowances away for free.) Some entities will end up reducing their emissions if the total number of allowances available is less than the number of emissions that would otherwise occur.
Cap Intended to Provide Emissions Certainty. The cap generally ensures that total GHGs from major sources of emissions do not exceed the limit established by the state. As long as GHG emissions are accurately measured and the regulation is adequately enforced, the number of emissions cannot exceed the cap.
Allowance Price Provides Incentive for Cost‑Effective Emissions Reductions. From an economic perspective, the primary advantage of a cap‑and‑trade program is that it creates a financial incentive to identify the least costly emission reduction activities. The supply and demand of allowances in a trading market generally determine the price of an allowance. Some emitters will reduce emissions because doing so is less costly than purchasing an allowance. Remaining emitters will purchase allowances and continue to emit because allowances are cheaper than their costs to reduce emissions. In theory, the level of overall emission reductions is achieved at the lowest cost possible because the allowance price provides an economic incentive to find the mix of emission reductions and allowance purchases that minimize costs. (For more information on the cap‑and‑trade program, see our February 2017 report The 2017‑18 Budget: Cap‑and‑Trade.)
LAO Assessment
We find that a mandate for state buildings to be ZNE is not a necessary or cost‑effective way for the state to achieve its GHG reduction goals. This is largely because the state has already adopted a cap‑and‑trade program that limits total emissions from large emitters, such as electricity generators. So, a ZNE mandate will not necessarily reduce emissions more than would otherwise occur. Accordingly, we find that it is more important that the state assess whether achieving ZNE for each building project would be cost effective.
Challenges With Using ZNE Mandate to Achieve GHG Reduction Goals
ZNE Mandates Not Necessary to Meet GHG Reduction Targets. A mandate for state‑owned buildings to be ZNE is not necessary to meet the state’s GHG reduction goals. This is because the cap established under the cap‑and‑trade program sets a limit on the amount of GHG emitted in the state. As such, the cap serves as a backstop to ensure that emission goals are met, regardless of the state’s approach to greening its buildings. Specifically, if in the future the state purchases less energy from utilities because it constructs ZNE buildings, the utilities will have to purchase fewer allowances. This will leave more allowances available, and other emitters will purchase these allowances instead of reducing their emissions. The net result is a change in the type of emission reductions, but no change in the overall level of GHG reductions in California. (We note that there could be some exceptions to this, such as if the state was already emitting fewer emissions than required by the cap or if the cap‑and‑trade system is not renewed beyond 2030.)
Cap‑and‑Trade Likely to Encourage Less Energy Use Even Without ZNE Mandate. Cap‑and‑trade will make the implementation of energy efficiency and renewable energy measures more cost effective. This is because under the cap‑and‑trade system, as the state’s emissions targets tighten, the state will gradually reduce the number of allowances available. When this happens, the cost of allowances and associated energy prices will tend to rise. Notably, by making energy prices higher, cap‑and‑trade will encourage the state and other building owners to undertake projects that include more energy efficiency and renewable energy measures without the need for mandates. Some of these resulting projects could be ZNE, while others might simply be low net energy use. Regardless of whether these buildings are ZNE or low net energy use, by taking into account a higher cost of GHG emissions, they will likely result in fewer emissions than traditional buildings.
ZNE Mandate More Costly Way to Achieve GHG Reductions. A mandate for state buildings to be ZNE is likely to be a less cost‑effective approach to reducing GHG emission reductions than what would otherwise be encouraged through the cap‑and‑trade system alone. This is because the cap‑and‑trade system provides an economic incentive for households and businesses that can reduce their emissions at relatively low cost to do so, resulting in the implementation of the most cost effective approaches to achieving GHG reductions. Therefore, GHG reductions achieved only because of additional mandates likely would be more costly than those that would be achieved through the cap‑and‑trade system alone. We note there sometimes are “market failures”—where decision makers do not have the appropriate incentives or information. In these cases, specific mandates could be helpful in achieving cost‑efficient emission reductions. To date, the administration has not provided evidence that there is a specific market failure that its ZNE policy is attempting to address.
ZNE Mandates Could Also Result in Some Additional Trade‑Offs. The requirement that state buildings achieve ZNE could also present some additional trade‑offs that are important to consider, particularly related to use of significant amounts of on‑site solar PV. On the one hand, on‑site solar PV can provide a source of renewable energy that can replace other forms of electricity generation that rely on fossil fuels and produce various types of localized air pollution (in addition to GHG emissions). On the other hand, on‑site solar PV systems typically require significant physical space to generate sufficient energy to offset a building’s energy use. Thus, some researchers have noted that ZNE’s push towards on‑site renewable energy tends to encourage the construction of less dense buildings and campuses that are more spread out—with more rooftop and parking space relative to building square footage—than might otherwise be the case. This type of less dense development is inconsistent with other state goals, which emphasize land use policies intended to support greater density, discourage driving, and encourage more use of alternative forms of transportation, such as walking and public transit. In addition, solar panels are more effective in areas that are not shaded by nearby trees, and thus on‑site solar can require the removal of existing trees or prevent the planting of new trees. For example, the ZNE project implemented by the Department of Public Health required the removal of roughly 700 trees. Trees, however, have other offsetting environmental benefits, such as sequestering carbon, shading buildings, and reducing the “urban heat island” effect (the tendency of urban areas to become hotter than they would be otherwise).
ZNE Not Always Cost‑Effective
Importance of Cost‑Benefit Analyses for ZNE Projects. Since mandating ZNE at state buildings is not necessary for reaching statewide GHG goals, it is more important for state departments to determine whether the benefits of utility savings from a ZNE project outweigh the costs of installing and maintaining the on‑site renewable energy generation system and the energy efficient building components. Cost‑benefit assessments would ensure that the state’s tax and fee dollars are used efficiently to reduce long‑term costs. Moreover, analyses that prevent the state from undertaking ZNE projects that are not cost effective would save state funds that could be used in other ways, whether that is to achieve GHG emission reductions from other projects or other state purposes.
ZNE Costs and Benefits Likely Vary Across State‑Owned Buildings. It is important to conduct cost‑benefit analyses on individual ZNE projects because the costs and benefits of ZNE vary across projects. As described previously, the costs can vary significantly across projects depending on various factors such as the energy intensity of the building, whether it is new or existing, and its location. Costs can also be affected by a project’s choice of renewable energy sources—such as building‑owned or third party‑owned solar PV. Consequently, some ZNE projects could result in energy savings that greatly outweigh the additional costs, while other ZNE projects might not prove to be cost‑effective.
We note that the variation in the estimated costs of achieving ZNE can be seen in the ZNE projects that the administration has proposed thus far. For example, the Lottery estimated that adding ZNE to its completed Santa Fe Springs District Office added 17 percent to the cost of constructing the project. Additionally, the DMV estimated that the cost of adding ZNE to its planned Reedley Field Office facility is expected to add 29 percent to the building’s construction costs. We further note that the benefits of making buildings ZNE are also likely to vary by project depending on the energy rates that the state pays at the facility.
ZNE Costs and Benefits Likely Vary Over Time. We also expect that the costs and benefits of constructing a building as ZNE will vary over time as the costs and benefits of adding solar PV and energy efficiency to projects change. This would result in the cost‑benefit calculation for ZNE projects being different in the future than today. First, if federal, state, or local tax incentives for solar PV change, it could affect the cost of implementing these systems through power purchase agreements at state facilities.
Second, the cost of these systems could be affected by overall changes in the solar PV market. Notably, solar PV prices have fallen in recent years, and some observers believe they might continue to fall in the future. If PV prices continue to fall, that could reduce the cost of offsetting the energy necessary to make a building ZNE and thus make ZNE projects more cost‑effective.
Third, assuming that Title 24 building efficiency codes continue to become stricter, buildings built to code will be closer to the energy efficiency necessary for ZNE. This will reduce the additional cost associated with implementing the incremental energy efficiency measures required to make the building ZNE. However, for many projects, it will also mean that those incremental measures will produce fewer energy savings. Overall, to the extent that the stricter Title 24 standards incorporate a greater share of cost‑effective energy efficiency measures, it might become more difficult to achieve cost‑effective energy efficiency measures that go beyond the code.
Fourth, if utility rate structures change, it will also affect the cost effectiveness of ZNE. For example, if electricity rates increase, it will tend to make ZNE more cost effective because there will be greater savings from not having to purchase the increasingly expensive utility power.
An Example Where Cost‑Benefit Analysis Provided Valuable Information. In early 2017, the California Military Department (CMD) proposed to construct its new headquarters building as ZNE at an estimated additional cost of about $18 million. The initial project proposal did not include a cost‑benefit analysis of adding ZNE to the project. However, upon our office’s request, the department conducted such an analysis. After completing the analysis, CMD determined that a major component of its project—a thermal storage unit—was not cost effective. Accordingly, the administration subsequently proposed modifying the project to remove the thermal storage unit, thereby reducing the project costs by about $5 million. The resulting ZNE components of the project had an estimated discounted payback period of about 40 years, which the department estimated was in line with their expected useful life.
Despite Value, Departments Have Not Been Doing Cost‑Benefit Analyses. Given the value of cost‑benefit analyses, we would expect departments to routinely conduct them. However, we are not aware of any state project, with the exception of the CMD project described above, that completed a cost‑benefit analysis prior to design or construction. Notably, for the proposed ZNE projects that we reviewed, six project proposals included estimates of the incremental costs of adding ZNE, and a handful of other projects estimated the cost of adding solar PV alone. However, apart from the CMD project, none of the proposed ZNE projects we reviewed have accompanied those cost estimates with estimates of the benefits from reduced energy costs associated with implementing ZNE. It is important for the Legislature to have access to this information to determine whether investing in ZNE makes sense from a financial perspective. We note that the October 2017 management memo includes some direction to pursue the administration’s goals cost‑effectively. However, the memo includes minimal detail. For example, it does not define cost‑effectiveness or describe how to calculate it. Accordingly, it is not clear how departments will implement this direction.
LAO Recommendations
Based on our assessment, pursuing state buildings as ZNE is not necessary for the state to achieve its GHG reduction goals and could potentially increase state costs and present other trade‑offs. Accordingly, we recommend that the Legislature establish its own policies related to ZNE for state buildings that reflect its priorities.
At a minimum, we recommend that these policies direct the administration to conduct cost‑benefit analyses with certain information on all ZNE projects proposed to the Legislature in the future—as well as for state projects that propose going beyond Title 24 energy efficiency codes or installing renewable energy systems. We further recommend that these policies require the administration to emphasize pursuing ZNE projects that are shown to be cost effective. We discuss our recommendations in more detail below.
Establish Legislative Policy Priorities for ZNE State Buildings
The administration is moving forward with implementing the ZNE goals for state buildings outlined in the Governor’s executive order. However, thus far, the Legislature has not established its own policies related to ZNE for state buildings. To ensure that the administration implements ZNE in a way that is consistent with legislative priorities, we recommend that the Legislature pass legislation that outlines its policies for ZNE for state buildings. At a minimum, we recommend that the Legislature prioritize those projects that are shown to be cost effective. In order to help achieve this goal, we recommend that the Legislature (1) direct the administration to provide key information to the Legislature on the cost‑effectiveness of proposed ZNE projects and (2) focus on pursuing projects that can clearly demonstrate they are cost effective.
Require Cost‑Benefit Analyses of Projects
Provides Legislature With Valuable Information. We recommend that the Legislature require the administration—through the ZNE legislation it adopts—to provide cost‑benefit analyses of all proposed ZNE projects and other projects that include renewables or go beyond required efficiency requirements in Title 24. We note that there are various methods for evaluating the costs and benefits of these projects, as described in the box below. Regardless of the method, providing these cost‑benefit analyses will ensure that the Legislature has sufficient information to determine whether the proposed projects are worth the estimated costs to implement or whether they should be modified. These analyses are important to do for every project seeking legislative approval because, as described previously, the costs and benefits of ZNE are likely to vary by type of project and change over time. However, we note that it is particularly important to do these cost‑benefit analyses for larger projects because adding ZNE to large construction projects could add tens of millions of dollars in costs.
Methods to Conduct Cost‑Benefit Analyses
Different Types of Cost‑Benefit Analyses. A cost‑benefit analysis is a systematic approach to comparing the strengths and weaknesses of various alternatives under consideration. There are a few common ways of conducting a cost‑benefit analysis. They are all similar in that they compare the cost of a project to its benefits, but differ in the specific ways they are calculated and interpreted. As a result, in some cases one approach might be more intuitive to understand than another. The various approaches include:
- Benefit Cost Ratio (BCR) and Net Present Value (NPV). Under these two approaches, the total discounted benefits of a project over time are compared to the total discounted costs of the project over time. Specifically, under the BCR approach, the total discounted benefits of a project over time are divided by the total discounted costs of the project over time. Projects with a resulting ratio—the BCR—greater than one signify that the benefits outweigh the costs. Under the NPV approach, the total discounted costs of the project over time are subtracted from the total discounted benefits of a project over time. Projects where the difference—the NPV—is positive would be ones with greater savings than costs. When comparing alternative options, it is generally recommended that the one with the greatest BCR or NPV be adopted.
- Discounted Payback Period. Under this approach, the discounted costs and benefits are estimated for each year. The discounted payback period is the number of years at which the total discounted benefits of a project surpass the total discounted costs. Generally, it is recommended that projects should proceed only if the discounted payback period is shorter than the useful life of the investment.
Cost‑Benefit Analyses Can Be Performed From Various Perspectives. Entities can conduct cost‑benefit analyses in different ways. In the case of state buildings, for example, the analyses can be conducted from the perspective of the state as a building owner—taking into account the costs and benefits that accrue to the state department undertaking the project. Alternatively, they can be conducted to take into account the costs and benefits to society more broadly, taking into account, for instance, the taxpayer cost of government incentives for solar photovoltaic. While this approach provides a broader perspective, it is more complex because there can be a wide range of costs and benefits, and they can be difficult to identify and quantify.
Cost‑Benefit Analyses Should Be Completed at Key Legislative Decision Points. The administration should provide cost‑benefit analyses when proposed projects reach key legislative decision points. Specifically, the administration is generally required to seek legislative approval for funding for new or major rehabilitation projects. This occurs at various stages of these projects—starting at the initial planning phases (usually the preliminary plans phase) and proceeding through the project’s construction funding request. These project approvals serve as key decision points, during which time the Legislature can determine if it wants to implement the Governor’s policy direction related to ZNE buildings or take a different approach. Accordingly, the recommended cost‑benefit analyses should be provided at the initial planning phases and updated for subsequent project funding phases, including if projects undergo significant cost or scope changes that affect the renewable or energy efficiency components of the project.
Cost‑Benefit Analyses Should Include Various Components. We recommend that the Legislature require that the cost‑benefit analyses include certain information as identified below. These analyses should also include separate evaluations of the costs and benefits of (1) energy efficiency measures and (2) renewable energy components of the projects. In some cases, it might be difficult to estimate precise cost and savings estimates—particularly of energy efficiency measures that are integrated into the building design—but the administration should provide a rough estimate at a minimum.
We note that, ideally, cost‑benefit analyses would consider each individual component of projects—such as more energy efficient windows or cooling systems—separately. However, we do not recommend that the Legislature require this higher level of detail because, in some cases, it might not make sense to do a component‑by‑component analysis. For example, certain energy efficiency components might cost more individually, but may allow for smaller heating and cooling systems.
In our view, the required cost‑benefit analyses should, at minimum:
- Evaluate Life Cycle Costs. The analyses should take into account not only up‑front costs and benefits, but also those that occur over time, such as estimated future energy savings and operating costs associated with the various building components, such as maintaining solar PV systems.
- Take Into Account Time Value of Money. The analyses should apply a reasonable discount rate that takes into account that dollars in the future are worth less than those today.
- Evaluate Key Alternatives. The analyses should compare a reasonable set of alternatives. Recognizing that it is not feasible to look at every possible mix of alternative energy efficiency and renewable energy measures, at minimum, alternatives that should be evaluated include: (1) the cost and savings of the proposed energy efficiency measures compared to the cost and savings for a facility with energy efficiency components consistent with Title 24 and (2) the cost and savings of renewable energy generation options. With regard to renewables, the analysis should compare solar PV (both state‑owned and third party‑owned) with options for purchasing utility‑provided renewable and conventional electricity.
- Identify Major Assumptions. The analyses should clearly specify key assumptions—such as the assumed inflation rate of energy prices and discount rates—so the Legislature can evaluate whether they are reasonable. This is important because the results of cost‑benefit analyses can be highly dependent on the assumptions used since the benefits of ZNE projects—and to a lesser degree the costs—are likely to be generated over a period of many years.
- Include Sensitivity Calculations. The analyses should be based on a reasonable range of key assumptions in cases where there is significant uncertainty, such as future energy costs.
Pursue Efficiency and Renewable Energy Only if Savings Outweigh Costs
Would Not Hurt GHG Reduction Goals. We recommend that the Legislature’s policies direct the administration to focus on cost‑effective projects. Specifically, we recommend that the state only implement building projects with renewable energy and energy efficient building components that have net savings to the state compared to the main alternatives. Moreover, we recommend that the Legislature modify those projects that are shown to have net costs to the state. Taking our recommended approach might mean not achieving ZNE on some projects. However, this will not hurt the state’s efforts to meet its GHG reduction goals from large emitters because the state’s existing cap‑and‑trade system generally ensures these goals will be met. Furthermore, this approach will ensure that the state uses its limited funds on cost‑effective projects, thereby reducing net state costs.
We note that there could be some exceptions that would justify doing a project that is not cost‑effective based on the information included in a typical cost‑benefit analysis. For example, it might make sense to fund a demonstration project that is designed to evaluate whether a new technology works effectively. Even if the technology does not appear to be cost effective, the project might provide other benefits that are not fully captured in a cost‑benefit analysis—such as providing valuable information to the building industry on the feasibility of implementing the technology. However, the cost‑benefit analyses should still be done in order to provide the Legislature with the relevant cost and savings estimates. This information is necessary to allow the Legislature to evaluate the merits of the proposed project, as well as weigh those merits against various competing budget priorities, whether those are state building projects, sustainability efforts, or other state programs.
State Achieving ZNE Cost‑Effectively Could Provide Valuable Example. If the state can show that ZNE can be achieved cost‑effectively for a variety of building projects, it will provide an important model for other public and private sector entities considering ZNE projects. The small but growing number of ZNE projects in operation nationally have shown that achieving ZNE for state and non‑state buildings is technologically feasible. However, ZNE has not yet gained broad adoption, likely in part because there is limited information demonstrating that it can be done cost‑effectively. Accordingly, if the state can demonstrate that it can build different types of state facilities—office buildings, labs, and correctional facilities, for example—in various locations as ZNE cost‑effectively, it could help fill an existing gap in information on the incremental costs and benefits of ZNE.
Conclusion
Mandating that state buildings be ZNE is not a necessary or cost‑effective approach to meeting the state’s goals for reducing GHG emissions. However, the administration is mandating that departments take various actions to implement ZNE consistent with the Governor’s executive order. We recommend that the Legislature adopt its own policies related to ZNE at state buildings to ensure that the administration’s actions are consistent with legislative priorities. As it formulates these policies and reviews specific project funding proposals from the administration, we recommend that the Legislature focus on pursuing those projects that save the state money over time. By pursuing energy efficiency and renewable energy projects if they are cost‑effective, the state will make better use of its funds. Furthermore, if the state achieves ZNE cost‑effectively for a variety of projects, it will serve as a valuable model for other entities, whether public or private, that are considering whether to implement ZNE projects.