Chapter 1
The Budget Outlook
This report provides our projections of the state’s General Fund revenues and expenditures for 2010–11 through 2015–16 under current law, absent any actions to close the state’s budget gap. Our projections primarily reflect current–law spending requirements and tax provisions, while relying on our independent assessment of the outlook for California’s economy, demographics, revenues, and expenditures. The report aims to assist the Legislature with its fiscal planning as it begins to consider revisions to the 2010–11 budget and adoption of the 2011–12 budget. The basis of our estimates is described in the nearby box.
Basis for Our Estimates
Our revenue and expenditure forecasts are based primarily on the requirements of current law, including constitutional provisions (such as the Proposition 98 minimum guarantee for school funding), statutory requirements, and currently authorized federal funding. In other cases, the estimates incorporate effects of projected changes in caseloads, federal requirements, and other factors affecting program costs. The estimates are not predictions of what the Legislature and the Governor will adopt as policies and funding levels in future budgets. Instead, our estimates are intended to be a reasonable baseline of what would happen if current–law policies continue to operate in the future. We intend the forecast to provide a meaningful starting point for legislative deliberations involving the state’s budget so that corrective actions can be taken.
No COLAs or Inflation Adjustments Assumed. In line with the Legislature’s policy in recent years, we generally have not made annual cost–of–living adjustments (COLAs) or price increase adjustments over our forecast period. (Health programs are an exception since the costs of current–law benefits are subject to inflationary increases.) In particular, in the 2009–10 budget package the Legislature added to state law a provision stating that most programs, including universities, the courts, and various social services programs, would no longer receive “automatic” COLAs and inflation adjustments. The impact of not adjusting for COLAs and inflation means that the purchasing power of current state expenditures will be eroded by inflation over the forecast period and the state will not be able to maintain a “current services” budget. Should the Legislature choose to provide these adjustments in future years, we estimate that the state’s annual budget problems would be even greater than those indicated in our forecast—by about $400 million in 2011–12 and, if inflation adjustments were provided each year during the forecast, by as much as $3 billion in 2015–16. If the Legislature were to approve additional state employee pay or benefit increases (beyond those included in recent labor agreements), that also would increase costs above those indicated in our forecast.
Impact of Future Ballot Measures Not Considered. In keeping with our use of current law as the basis for our forecast, our projections do not consider any future impact of measures scheduled for future statewide elections—the $11 billion water bond and the budget reserve and spending measure passed as part of the 2010–11 budget package. We do, however, incorporate our preliminary estimates of the fiscal effects of propositions that were passed on November 2, 2010.
State Victories in Court Cases Assumed. Our forecast generally assumes that the state eventually prevails in active, budget–related court cases. (By active cases, we mean open cases at the trial or appellate court level.) The state faces an array of active cases, including ones related to the budgeted shift of redevelopment funds and various health and social services reductions. The state also is appealing a three–judge panel’s order to reduce the prison population to the U.S. Supreme Court.
|
Figure 1 shows our estimate of the condition of the General Fund through the end of 2011–12 assuming no corrective action. The 2010–11 fiscal year would end with a $6 billion deficit. In 2011–12, expenditures would exceed revenues by $19 billion and leave the state with a year–end deficit of over $25 billion. Accordingly, we estimate that the Legislature and the new Governor will have to address a budget problem of $25 billion between now and the time that they agree to a 2011–12 state budget plan.
Figure 1
LAO Projection of General Fund Condition if No Corrective Actions Are Taken
(In Millions)
|
|
2009–10
|
2010–11
|
2011–12
|
|
Prior–year fund balance
|
–$5,375
|
–$5,371
|
–$4,591
|
|
Revenues and transfers
|
87,041
|
93,284
|
83,530
|
|
Expenditures
|
87,037
|
92,505
|
102,756
|
|
Ending fund balance
|
–$5,371
|
–$4,591
|
–$23,817
|
|
Encumbrances
|
1,537
|
1,537
|
1,537
|
|
Reservea
|
–$6,908
|
–$6,128
|
–$25,354
|
2010–11 to End in Deficit
Projected 2010–11 Year–End Deficit of $6 Billion
$3.5 Billion of New Funding or Flexibility Not Yet Approv ed by U.S. Government. At the time the Governor signed the 2010–11 budget package in October 2010, the administration estimated that the General Fund would have a $1.3 billion reserve at the end of 2010–11. A key assumption in that calculation was that the state would receive around $4 billion in federal funding (or additional flexibility in operating state–federal programs like Medi–Cal) that had not yet been approved by the federal government. Recently, the federal government approved a waiver affecting Medi–Cal and other health programs that provides annual General Fund savings that is initially estimated to total around $500 million per year. Our forecast assumes that the state fails to secure the remaining $3.5 billion of additional federal funding or flexibility incorporated into the 2010–11 budget package. Accordingly, based on that assumption alone, our projections show a General Fund deficit at the end of 2010–11.
A Net $3 Billion of Other Budget Solutions Likely at Risk. In addition to the inability to secure federal funding, we assume the state will be unable to achieve the following 2009–10 and/or 2010–11 budget solutions counted on in the 2010–11 budget package:
- Prisons and Medical Care Receiver. We expect that expenses of the prison medical care Receiver will exceed budgeted amounts by about $780 million and that other prison expenses will surpass budgeted totals by $185 million.
- Employee Compensation. Recent collective bargaining agreements and other personnel actions are projected to achieve over $400 million less in savings than assumed in the 2010–11 budget. In addition, in 2009–10, the state enacted a one–day payroll delay to achieve one–time savings of about $1 billion. Estimates now indicate the delay achieved savings of $800 million.
- Medi–Cal. Around $400 million of budgeted savings are estimated to be unachievable in Medi–Cal due to (1) the late passage of the 2010–11 budget and (2) our projection that the program will be unable to achieve an unallocated budget reduction of $323 million.
- In–Home Supportive Services (IHSS) Program. As part of the 2010–11 budget package, a variety of solutions were estimated to reduce IHSS costs by $300 million. We estimate that only about one–half of this savings will materialize. In addition, $45 million of budgeted savings from previously enacted anti–fraud activities will not be achieved.
- Lower Property Tax Estimate Affects General Fund Education Spending. Our forecast assumes lower local property tax revenues than the 2010–11 budget package. General Fund spending on Proposition 98, therefore, is over $400 million higher in our forecast for 2009–10 and 2010–11 combined.
- Information Technology Savings. The budget package assumed the administration would reduce departmental budgets by $130 million in 2009–10 and $140 million in 2010–11 to capture savings from recent efficiencies implemented in information technology programs. Our forecast assumes that much of this savings does not flow to the General Fund’s bottom line.
2009–10 and 2010–11 Revenue Projection Down $447 Million. The 2010–11 budget package essentially relied on our office’s May 2010 revenue forecast for 2009–10 and 2010–11, which was $1.4 billion higher than the administration’s. Our current projection has General Fund revenues $447 million below the budget package forecast for 2009–10 and 2010–11 combined.
Proposition 22 Reduces General Fund Solutions by Nearly $800 Million. There is some uncertainty about what Propositions 22 and 26 mean for state finance in the short term, as discussed in the nearby box. Our forecast, however, assumes that Proposition 22 prevents the state from achieving nearly $800 million in budgeted 2010–11 solutions—about $400 million in now–prohibited borrowing from the Highway Users Tax Account and $400 million in now–prohibited use of transportation funds to pay bond debt service.
Effects of November 2010 Ballot Measures on Our Forecast
Three major budget–related measures were approved by voters at the November 2 general election. Proposition 25 changes the vote threshold needed to send a budget bill to the Governor from two–thirds to a simple majority of each house of the Legislature. This may help make it easier for the Legislature to pass an on–time budget each year. At the same time, voters approved Propositions 22 and 26, which restrict the Legislature’s ability to use certain local funds to help balance the budget and raise the vote threshold for passing certain fees from a simple majority to two–thirds, respectively.
Our Assumptions Concerning Propositions 22 and 26. We assume that Proposition 22 prevents the state from borrowing certain transportation special funds for the General Fund, as was assumed in the Legislature’s 2010–11 budget plan. We also assume that loans from such special funds prior to November 3 (the effective date of the measure) are not affected by Proposition 22. Accordingly, in our forecast, about $400 million of not–yet–executed loans from the Highway Users Tax Account are assumed to be prohibited by Proposition 22. This worsens the condition of the General Fund in 2010–11 by a like amount. The budgeted use of certain transportation funding to offset General Fund debt–service costs also is assumed to be impermissible in 2010–11, thereby hurting the General Fund’s bottom line by another $400 million.
In 2011–12, we assume that Proposition 26 fully reverses the “fuel tax swap” adopted by the Legislature earlier this year, beginning November 2011 (one year after voter approval). Accordingly, state sales taxes on gasoline resume (thereby increasing General Fund revenues), excise taxes on gasoline decline, and the General Fund’s payments for transportation programs resume pursuant to Proposition 42 (2002). A timing lag in Proposition 42 payments means that the net effect of these measures is near zero for 2011–12. The ongoing effect of Propositions 22 and 26—approaching $1 billion or more annually—does not hit the General Fund until 2012–13 in our forecast.
Some Uncertainty. Propositions 22 and 26 are complex measures. It is possible that some of the fiscal effects we describe above would not materialize until a stakeholder successfully sues the state in court to force these budgetary changes. Accordingly, our forecast presents a preliminary point of view about their effects on the budget. The actual effect may be different in any given fiscal year.
|
$6.1 Billion General Fund Deficit Forecast for 2010–11. As shown in Figure 1, given all of these expenditure and revenue issues, we forecast that 2010–11 will end with a General Fund deficit of $6.1 billion, absent any corrective action by the Legislature. Various cash management actions—including payment delays approved by the Legislature and borrowing from both investors and state special funds—will facilitate continued General Fund operations despite the forecasted deficit, as described in the nearby box.
Cash Management
Background. As we described in our January 2009 report, California’s Cash Flow Crisis, the state suffers from a basic cash flow problem, even in good years. Most revenues are received during the second half of the fiscal year (January to June), while most expenses are paid in the first half of the fiscal year (July to December). In order to meet payments in the early part of the year, the state obtains short–term borrowing that is paid back within the fiscal year, referred to as revenue anticipation notes (RANs). The state also relies on a pool of “borrowable resources”—balances in state special funds—that can be borrowed for cash flow purposes.
Billions of Dollars of Payments Delayed in 2010–11. The Legislature enacted two sets of cash payment delays for the 2010–11 fiscal year in order to assist with cash management. The first was enacted in special session legislation and allowed for delays of up to $5 billion of scheduled payments to schools, universities, and local governments at almost any given time within the fiscal year. The second set of delays was enacted in the October budget package and allowed for an additional $4.7 billion of payments to be delayed in October and November in order to avoid the issuance of registered warrants (IOUs) and facilitate the issuance of a 2010–11 RAN. The Controller also used his executive authority to delay other payments in October, such as tax refunds. These various payment delays will be repaid within the 2010–11 fiscal year.
Payment Delays Will Be Needed for 2011–12. With a few exceptions, there are no statutory provisions for intrayear payment delays in the 2011–12 fiscal year. Given our forecast for the significant deficit at the end of 2010–11 and the accumulated deficit in the General Fund, the state will likely require significant external cash flow borrowing again in 2011–12. In addition, to avoid the issuance of IOUs at certain points in the year, payment delays similar to those approved in 2010–11 likely will be needed. Local governments, schools, and community colleges previously have indicated that early adoption of payment delays helps them execute their own annual cash borrowings.
Curbing the Deficit Would Reduce Cash Pressures in Future Years. Many temporary or one–time budget solutions—such as borrowing from special funds—increase cash pressures by reducing overall borrowable resources. If the Legislature acts to eliminate operating shortfalls in the coming years, we would expect cash pressures, and hence the need for payment delays, to decline. While removing the payment delays will not have a significant impact on the state’s budget situation, it should reduce the external borrowing costs of local entities and provide more certainty in fiscal planning efforts of schools and community colleges. Reducing cash pressures can also reduce the state’s need for external borrowing, thus reducing the state’s borrowing costs.
|
Major New Budget Problem in 2011–12
With the “Carry–In” Deficit, a $25 Billion Problem to Address. The vast majority of the roughly $20 billion of budget solutions enacted as part of the 2010–11 budget process were one–time or temporary in nature. At the same time, by the end of 2010–11 about $8 billion of temporary tax increases expire, and about $4.5 billion of federal stimulus funding used to reduce General Fund expenses will be exhausted. For these reasons, the state will be left with a large operating shortfall (the difference between annual General Fund revenues and expenditures) problem in 2011–12 totaling $19.2 billion. In addition, the Legislature must address the 2010–11 year–end deficit at or before the time it enacts the 2011–12 budget package. Accordingly, the total budget problem that the state must address between now and passage of the 2011–12 budget totals $25.4 billion in our forecast, as shown in Figure 1.
Key Considerations Regarding the 2011–12 Budget
Sharp Reduction in K–14 Programmatic Spending Already Reflected in Our Forecast. Because of the expiration of temporary tax increases and other factors, General Fund tax revenues are forecast to decline significantly in 2011–12, which drives down the Proposition 98 minimum funding guarantee in our projections. The Proposition 98 minimum guarantee is forecasted to decline from $49.7 billion in 2010–11 (when the Legislature suspended Proposition 98) to $47.5 billion in 2011–12. The General Fund’s share of Proposition 98 funding is forecast to decline as well—from $36.2 billion in 2010–11 to $34.2 billion in 2011–12.
At the same time, it is expected that schools will have spent most of the billions of dollars of recent, one–time federal stimulus and jobs funding approved by Congress. Accordingly, it may be very difficult for the Legislature to achieve additional Proposition 98 savings as part of its 2011–12 budget package. In other words, if the Legislature funds schools at the forecasted minimum guarantee in 2011–12, it would mean billions of dollars in programmatic cuts to education but not contribute a single dollar to closing the $25 billion budget problem.
State Faces Ongoing Constraints on Reducing Health Programs. Our forecast reflects sharp General Fund increases in Medi–Cal, the state’s second–largest General Fund program, that are required under current law and as a result of the expiration of federal economic stimulus funding. The American Reinvestment and Recovery Act (ARRA) of 2009 provided an enhanced federal match in state support for Medi–Cal that will be phased out as of the end of 2010–11. The state’s receipt of billions of dollars in federal assistance under ARRA, however, was on the condition that it maintain the eligibility standards, methodologies, and procedures that were previously in place for Medi–Cal. These constraints originally were to expire along with the provision of ARRA funding. However, provisions in the federal health care reform law essentially extended these maintenance–of–effort requirements for Medi–Cal and also applied them to the Healthy Families Program. This essentially takes off the table many options to scale back these programs that could result in several hundreds of millions of dollars in state General Fund savings annually.
In other areas, such as California Work Opportunity and Responsibility to Kids (CalWORKs), the expiration of federal economic stimulus funding (known as the Temporary Assistance for Needy Families Emergency Contingency Fund, or TANF ECF) does open up additional options for state savings. The high 80 percent federal matching rate available under TANF ECF for increased CalWORKs grant costs above the state’s base costs in 2007 had been a deterrent to cutting General Fund support for CalWORKs cash assistance, but it is no longer in effect.
Revenue Uncertainty. As we discuss in Chapter 2, there are a lot of challenges with forecasting economic activity and revenues in California following the unprecedented recession that ended in 2009. One of the key challenges is forecasting capital gains. This is always difficult, but is even more so this year given the huge unrealized stock and housing capital losses of recent years and uncertainties about federal tax policy with the pending expiration of various tax cuts. Action or inaction by Congress on the expiring tax cuts in the coming weeks could affect taxpayer behavior and the resulting timing of hundreds of millions of dollars in state revenues related to capital gains.
Of perhaps even greater concern is uncertainty about the federal estate tax. Currently, our forecast—like the 2010–11 budget package—assumes $2.7 billion of estate tax revenues for the General Fund in 2010–11 and 2011–12 combined based on current law. There has, however, been significant speculation that Congress will change estate tax law to eliminate the state’s ability to generate any of these revenues. Should Congress do this, the budget problem for 2011–12 would increase by $2.7 billion above the level indicated in our forecast.
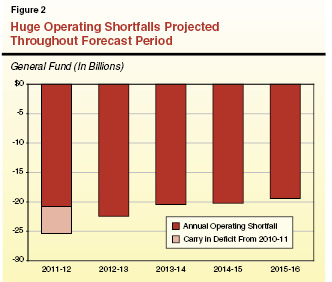
Lingering Budget Problem of $20 Billion For Years to Come
Roughly $20 Billion Annual Problem Forecast Through 2015–16. As shown in Figure 2, our forecast of General Fund revenues and expenditures shows an annual budget problem of around $20 billion through 2015–16. With the econsomic recovery remaining very weak and the lack of many permanent budget solutions in the 2010–11 budget package, the ongoing structural deficit has not changed much since our forecast one year ago. The annual operating shortfall peaks at $22.4 billion in 2012–13, when the state must repay its $2 billion Proposition 1A loan related to local property tax revenues. Thereafter, revenues grow a bit faster than expenditures as the state’s economic recovery becomes stronger. By 2015–16, the annual budget problem is $19.4 billion.
Projections Likely Understate the State’s Fiscal Woes. We believe that our projections probably understate the magnitude of the state’s fiscal problems during the forecast period. First, our forecast generally assumes no cost–of–living adjustments or inflationary increases in departmental budgets. Second, by including only current–law expenditures, our forecast does not include funding to address a number of large liabilities that pose a risk to future state finances, as discussed below.
Massive Liabilities Growing. Unfunded actuarial accrued liabilities in pension and retiree health funds for state employees, teachers, and university employees now total $136 billion. (Possible upcoming actions by the state’s two largest pension systems to lower their assumed annual rates of investment return would expand this number.) The California State Teachers’ Retirement System (CalSTRS) estimates that it needs billions of dollars more per year in contributions—not included in our forecast—to retire its unfunded liabilities within about 30 years and continue operations past the 2040s. Similarly, there are no funds assumed in our forecast to begin retiring the University of California Retirement Plan’s (UCRP) growing unfunded liabilities. State retiree health liabilities continue to grow, driving upward the associated General Fund expenditures. The Legislature took action earlier this year to modify state pension programs, providing some budget relief now and greater relief in the future. The unfunded liabilities of state retirement systems, however, loom over the state’s budget prospects. Left unaddressed in the near term, costs to service CalSTRS, UCRP, and retiree health liabilities will only grow, burdening future Californians more and more and requiring even harder decisions about taxes and services. The state should look for ways to address these problems soon, to avoid passing these huge obligations to future Californians.
Multiyear Approach To Balance the Budget...Beginning Now
Current Budget Problems Hinder Ability to Plan for the Long Term. As discussed throughout this report, California faces immense short–term budget problems and perhaps even more troubling longer–term fiscal challenges. Without immediate action to begin tackling the structural deficit for the long term, the state may not be able in the foreseeable future to move beyond its current stumble from one terrible budget problem to the next. As such, it will continue to be difficult for the state to address fundamental public sector goals—such as rebuilding aging infrastructure, addressing massive retirement liabilities, maintaining service levels of high–priority government programs, and improving the state’s tax system.
Not Possible to Solve the Whole Problem in One Year. In a state as complex as California, with an economy as weak as the one we have right now, it is not possible to solve this $20 billion ongoing budget problem all at once. The solutions necessary to address the whole problem are probably not obtainable in the current environment. Instead, this problem will take several years to solve. Sound financial planning requires that the state’s leaders agree now to a broad framework for a multiyear approach to tackling the stubborn budget problem.
Multiyear Approach Requires Real Budget Solutions. The current fiscal year is the third consecutive one that will end with a General Fund deficit. Key contributors to year–end deficits have been enacted budget solutions that have not been achieved. For example, earlier in this chapter we discussed a net $3 billion of 2009–10 and 2010–11 expenditure solutions that are unlikely to be achieved. Year–end deficits have to be “carried in” to the next fiscal year and make the task of balancing the next year’s budget much more difficult. To make progress over several years in tackling the ongoing deficit, the Legislature should minimize the use of risky budget solutions that contribute to year–end deficits. Instead, budget solutions need to be real—by which, we mean those that have a high probability of achieving budgeted savings. The Legislature can maximize the probability of achieving solutions by passing budgets on time (preferably early) and, in the case of spending reductions, providing specific direction and authority to the administration in well–crafted legislation on how reductions are to be realized.
Revenues Need to Be Part of the Mix. Just as the Legislature will have to prioritize its spending commitments in order to address the ongoing deficit, it will need to examine the revenue side of the ledger. There are several specific revenue policy areas that the Legislature should consider, such as:
- Tax Expenditure Programs. Through tax expenditure programs—special credits, deductions, and exemptions—the state provides subsidies to certain groups or individuals in ways that often have not been shown to be cost–effective. Their modification or elimination raises revenues without having to increase marginal tax rates.
- Increasing Charges for Program Beneficiaries. The Legislature should also look to increasing charges in those cases where the costs of state programs currently supported by the General Fund can appropriately be shifted to specific beneficiaries.
- Extending Certain Temporary Tax Increases. The Legislature may also have to revisit some of the temporary tax increases that are set to expire by the end of 2010–11. We think the best candidates for extension would be the vehicle license fee, where a good policy case can be made to tax vehicles at a rate similar to all other property, and the dependent exemption credit, where the current level is more consistent with the practice of almost all other states.
- Reconsider the Optional Single Sales Factor. The Legislature may wish to reexamine some corporate tax provisions, such as the existing option of multistate companies to switch annually between the new “single sales factor” method of profit apportionment and the state’s traditional method of apportionment for these companies. Making the single sales factor apportionment mandatory, instead of optional, for multistate companies could increase General Fund revenues and help the state’s competitiveness. (For more information, see our May 2010 report, Reconsidering the Optional Single Sales Factor.)
Both Permanent and Temporary Budget Solutions Are Needed in 2011–12. The basic framework we suggest for policy makers to balance the 2011–12 budget would involve a mix of:
- Permanent, real and ongoing expenditure reductions and revenue increases.
- Temporary budget solutions, such as short–term revenue or expenditure changes, asset sales, special fund loans and transfers, extended state employee furloughs or personal leave programs, and delays in lower–priority bond–financed infrastructure projects.
Given our forecast of a $25 billion budget problem in 2011–12, we suggest that the Legislature and the new Governor target $10 billion of permanent budget solutions in 2011–12 and $15 billion of temporary budget solutions. This would be a “down payment” on the multiyear approach to ending California’s structural deficit.
In a Multiyear Approach, More Permanent Solutions Each Year. Figure 3 graphically illustrates—in very simplified form—how a multiyear budget–balancing approach would work, assuming the accuracy of our budget deficit projections, for each fiscal year:
- 2012–13. By taking $10 billion of permanent budget actions in 2011–12, the size of the 2012–13 budget problem we forecast might be reduced from $22 billion to $12 billion. In 2012–13, the Legislature could address the budget problem with about $3 billion of new additional permanent actions (or the growth in savings from previously adopted solutions) and $9 billion of temporary actions.
- 2013–14. Adding together the effects of the permanent budget–balancing actions in 2011–12 and 2012–13, the budget problem we forecast for 2013–14 could be reduced from $20 billion to around $7 billion. The Legislature could address this problem with $3 billion of new additional permanent actions and around $4 billion of temporary actions.
- 2014–15. The prior permanent budget actions would reduce the 2014–15 budget problem from $20 billion to about $4 billion. Roughly another $3 billion of new, permanent budget actions could be adopted, along with $1 billion of temporary solutions.
- 2015–16. In this simplified scenario, there would no longer be a structural deficit facing the state in 2015–16 due to the accumulated effects of the permanent budget actions passed in the previous four years.
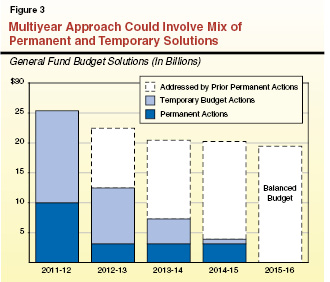
Naturally, the real work of balancing the budget would not be this simple. This scenario assumes that our revenue and expenditure forecast assumptions are correct, ignores the interaction between any increased revenues and Proposition 98 funding requirements, and assumes that no temporary budget–balancing actions—such as borrowing—increase costs (and deficits) in later years. The basic concept we offer, however, is that the Legislature can earnestly “chip away” at the budget problem, but only by beginning to enact permanent and real solutions to reduce spending and increase revenues.
The solutions needed to balance the budget will mean unavoidably painful sacrifice by today’s Californians. The benefit of this sacrifice would be putting the state on a sound fiscal footing. That sound footing may allow future Californians to live in a place where the annual state budget process is a chance to improve government’s ability to serve its residents.
Chapter 2
Economy, Revenues, and Demographics
The Economic Outlook
The National Bureau of Economic Research has determined that the national recession that began in December 2007 ended in June 2009. It was the longest recession since World War II and the most severe downturn since the Great Depression The 2007–2009 recession was precipitated by the implosion of overheated housing markets in California and throughout the United States, the resulting balance sheet deterioration of financial firms and households, and the near collapse of world credit markets.
California’s recession started even earlier than the nation’s and was deeper. Unemployment in the state—under 5 percent as recently as 2006—has topped 12 percent for over a year now, as 1.4 million jobs have disappeared. In 2009, personal income in California dropped 2.4 percent—the first annual decline since 1933.
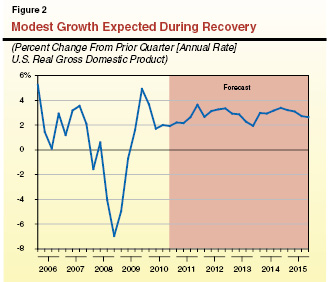
Slow Recovery Expected to Continue. The latest evidence suggests that the state and national economies continue their very slow recovery from this staggering economic drop–off. Our economic forecast—summarized in Figure 1—generally reflects the current consensus that the state and national economies will continue to recover slowly and sluggishly in the coming years.
Figure 1
The LAO’s Economic Forecast
(November 2010)
|
|
Actual
|
Estimated
|
|
Forecast
|
|
|
2009
|
2010
|
|
2011
|
2012
|
2013
|
2014
|
2015
|
2016
|
|
United States
|
|
|
|
|
|
|
|
|
|
|
Percent change in:
|
|
|
|
|
|
|
|
|
|
|
Real Gross Domestic Product
|
–2.6%
|
2.6%
|
|
2.2%
|
3.1%
|
2.9%
|
2.8%
|
3.1%
|
2.8%
|
|
Personal Income
|
–1.7
|
2.8
|
|
3.2
|
3.9
|
4.3
|
5.5
|
5.4
|
5.7
|
|
Wage and Salary Employment
|
–4.3
|
–0.5
|
|
0.9
|
2.2
|
2.2
|
1.5
|
1.4
|
1.2
|
|
Consumer Price Index
|
–0.3
|
1.6
|
|
1.6
|
1.9
|
2.0
|
2.1
|
2.1
|
2.1
|
|
Unemployment Rate (percent)
|
9.3
|
9.7
|
|
9.6
|
9.1
|
8.3
|
7.9
|
7.3
|
6.9
|
|
Housing Permits (thousands)
|
554
|
596
|
|
789
|
1,243
|
1,465
|
1,565
|
1,689
|
1,686
|
|
California
|
|
|
|
|
|
|
|
|
|
|
Percent change in:
|
|
|
|
|
|
|
|
|
|
|
Personal Income
|
–2.4
|
2.8
|
|
3.5
|
4.3
|
4.8
|
5.7
|
5.9
|
5.7
|
|
Wage and Salary Employment
|
–6.0
|
–1.7
|
|
0.7
|
2.2
|
2.4
|
1.8
|
2.0
|
1.3
|
|
Consumer Price Index
|
–0.4
|
1.6
|
|
1.6
|
1.9
|
2.0
|
2.1
|
2.1
|
2.1
|
|
Unemployment Rate (percent)
|
11.4
|
12.5
|
|
11.9
|
10.5
|
9.1
|
8.2
|
7.1
|
6.6
|
|
Housing Permits (thousands)
|
34
|
42
|
|
67
|
79
|
99
|
113
|
121
|
121
|
The U.S. Economy
Slower Recovery Than Previously Expected. Our recent economic forecasts already assumed a slow recovery, compared to past economic rebounds. Following the deep 1981–82 recession, for example, the U.S. economy bounced right back—with real gross domestic product (GDP) growing 4.5 percent in 1983 and 7.2 percent in 1984. Our updated forecast, by contrast, assumes that real GDP growth will be 2.6 percent in 2010, 2.2 percent in 2011, and no higher than 3.1 percent in any of the years between now and 2016. (Figure 2 summarizes our forecasts of quarterly changes in GDP.) Unemployment—now 9.6 percent nationally—is forecast to remain above 9 percent through 2012. Our forecasts of U.S. economic growth in 2011 and 2012 are somewhat lower than our forecasts from the past year.
What Is Causing the Slow Recovery? The slow recovery results from a combination of (1) excess inventories of residential and commercial real estate, (2) severely depressed economic confidence among both individuals and firms, and (3) for many consumers, a considerably weakened financial capacity to spend and invest. Consumers are attempting to restore their personal finances amidst the weak labor markets and diminished housing wealth. Credit remains very tight. While businesses have been spending more in recent quarters to address equipment, software, and other needs they deferred during the recession, they remain very reluctant to hire. The construction industry remains flat on its back—with few immediate prospects—due to the massive fall in residential and commercial real estate markets. While massive fiscal stimulus from the federal government helped cushion the fall, the 2009 stimulus program spending will taper off in the coming quarters, and the likelihood that Congress will enact additional fiscal stimulus appears remote. The Federal Reserve continues to take actions to stimulate the economy, but, with interest rates already at very low levels, its ability to achieve much in this regard is limited.
“Double–Dip” Recession Not Likely. While our economic and revenue forecasts reflect very modest assumptions about near–term growth, they are by no means a worst–case scenario. A minority of economic commentators have suggested that a double–dip recession—another period of diminished economic output—is possible due to the coming declines of federal economic stimulus, continued weakness in consumer spending, turmoil in the world’s sovereign debt and currency markets, and other factors. Our forecast reflects the consensus view that a double–dip recession will not occur. While employment, personal income, output, and housing permit growth, among other measures, are very weak by historical standards during a recovery, they are not shrinking. Similarly, while we expect low inflation through 2015–16, we do not forecast a period of deflation in the U.S. economy. In large part, our economic outlook reflects the view that some key economic measures (such as construction activity) have fallen so far that there is little room to fall even more.
The California Economy
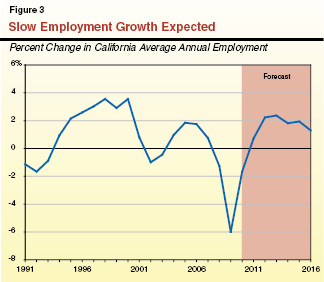
Employment Losses Subsiding. While U.S. employment has dropped about 5 percent since 2007, employment in California has declined 9 percent (1.4 million jobs). In 2010, however, the level of job losses in the state has been subsiding—a trend we expect to continue. We forecast that California will begin to experience a net increase in employment again in early 2011, causing unemployment to creep below 12 percent later in the calendar year. We expect employment in the state to grow by only about 100,000 jobs during 2011—a slower level of job growth for the year than in any of our recent forecasts. In 2012, we project slow employment growth in the state, a trend that should keep unemployment at or above 10 percent for much of that year. Growth in later years also remains fairly sluggish, as shown in Figure 3. Total employment in California does not return to its 2007 pre–recession levels in our forecast until 2016.
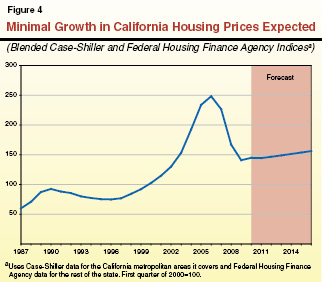
Housing Weakness Casts Formidable Shadow Over Economy. The main cause of the economic implosion of recent years has been the housing market. For now, at least, the collapse of California’s residential housing sector appears to have ended. As depicted in Figure 4, however, our forecast for California housing prices shows a very weak recovery—with minimal average gains in prices through 2016. While house prices now are more affordable—particularly in light of low mortgage interest rates—credit remains very tight. A large (but difficult to measure) “hidden inventory” of homes in default or facing foreclosure heavily influences our forecast. While residential building permits are up in 2010, they are still below 2008 levels—which, at the time, was the worst year in recent memory. Our forecast, as shown in Figure 1, expects housing permits to continue to grow slowly. Commercial building also continues to be exceptionally weak. For all of these reasons, California’s construction sector—having endured a crushing 40 percent employment decline since 2007—is not on track to regain its pre–recession strength in the foreseeable future.
Personal Income Poised to Rise With Job Growth. As job growth resumes, personal income in the state rebounds in our forecast—first, fairly slowly in 2011 and 2012, and then with some increasing strength thereafter. By 2014, we expect annual personal income growth for California in the 5.7 percent to 5.9 percent range—a level consistent with what we would consider a healthy growth rate for the state in the long run. Gradually climbing interest rates contribute to much stronger growth in dividends, interest, and rent income in the later years of our forecast. Government benefits also grow in the later years of our forecast, buoyed by growth in the aging “baby boom” population and, to some extent, the implementation of federal health care reform. All of these factors should help households in California continue to repair their finances, boost consumer confidence, and contribute to several years of increased consumption.
Revenue Projections
California’s General Fund is supported by revenues from a variety of taxes, fees, licenses, interest earnings, loans, and transfers from other state funds. About 90 percent of the total, however, is derived from the state’s “big three” taxes—the personal income tax (PIT), the sales and use tax (SUT), and the corporate income and franchise tax (CT). A summary of our revenue projections is shown in Figure 5.
Figure 5
LAO General Fund Revenue Forecast
(Dollars in Millions)
|
Revenue Source
|
2009–10
|
2010–11
|
2011–12
|
2012–13
|
2013–14
|
2014–15
|
2015–16
|
|
Personal income tax
|
$44,575
|
$46,731
|
$44,252
|
$47,909
|
$50,868
|
$54,072
|
$57,507
|
|
Sales and use tax
|
26,741
|
27,310
|
25,370
|
27,725
|
29,137
|
30,397
|
31,622
|
|
Corporation tax
|
9,500
|
10,418
|
8,567
|
8,125
|
8,531
|
9,255
|
9,963
|
|
Subtotal, “Big Three”
|
($80,816)
|
($84,460)
|
($78,189)
|
($83,760)
|
($88,536)
|
($93,724)
|
($99,092)
|
|
Percent change
|
5.4%
|
4.5%
|
–7.4%
|
7.1%
|
5.7%
|
5.9%
|
5.7%
|
|
Insurance tax
|
$2,020
|
$2,033
|
$2,060
|
$2,093
|
$2,129
|
$2,168
|
$2,223
|
|
Vehicle license fee
|
1,380
|
1,428
|
159
|
34
|
—
|
—
|
—
|
|
Estate tax
|
—
|
850
|
1,838
|
1,988
|
2,150
|
2,325
|
2,515
|
|
Sales of fixed assets
|
—
|
1,286
|
1
|
1
|
1
|
7
|
7
|
|
Other revenues
|
2,378
|
2,205
|
2,136
|
1,861
|
2,072
|
2,233
|
2,342
|
|
Net transfers and loans
|
447
|
1,021
|
–853
|
–1,014
|
–180
|
21
|
18
|
|
Total Revenues and Transfers
|
$87,041
|
$93,283
|
$83,530
|
$88,723
|
$94,708
|
$100,478
|
$106,197
|
|
Percent change
|
5.2%
|
7.2%
|
–10.5%
|
6.2%
|
6.7%
|
6.1%
|
5.7%
|
Figure 6 shows the differences between our forecasts of 2009–10 and 2010–11 revenues, as compared with those assumed in the 2010–11 budget package. For 2009–10 and 2010–11 combined, we now project that the big three and other revenues will be $447 million below the budget package assumptions. In addition, due to our assumption that passage of Proposition 22 will prevent the borrowing of some transportation funds, our net transfer and loans forecast is $378 million lower. In total, for 2009–10 and 2010–11 combined, our revenue and transfer forecast is $826 million below that assumed in the 2010–11 budget package.
Figure 6
November 2010 LAO Revenue Estimates Compared With 2010–11 Budget Package
(General Fund, In Millions)
|
Revenue Source
|
2009–10
|
|
2010–11
|
|
LAO November Forecast
|
Budget Package
|
Difference
|
LAO November Forecast
|
Budget Package
|
Difference
|
|
Personal income tax
|
$44,575
|
$44,820
|
–$245
|
|
$46,731
|
$47,127
|
–$396
|
|
Sales and use tax
|
26,741
|
26,618
|
123
|
|
27,310
|
27,044
|
266
|
|
Corporation tax
|
9,500
|
9,275
|
225
|
|
10,418
|
10,897
|
–479
|
|
Subtotal, “Big Three”
|
($80,816)
|
($80,713)
|
($103)
|
($84,460)
|
($85,068)
|
(–$608)
|
|
Other revenues
|
$5,778
|
$5,760
|
$18
|
|
$7,802
|
$7,762
|
$40
|
|
Net transfers and loans
|
447
|
447
|
—
|
|
1,021
|
1,399
|
–378
|
|
Total Revenues and Transfers
|
$87,041
|
$86,920
|
$121
|
$93,283
|
$94,230
|
–$947
|
Personal Income Tax
End of Temporary Tax Increases Affects 2011–12 Forecast. We estimate that PIT revenue will increase from its 2009–10 level of $44.6 billion to $46.7 billion in 2010–11. It will then drop off to $44.3 billion in 2011–12 as the temporary 0.25 percentage point rate increase and dependent credit reduction enacted in February 2009 expire at the end of calendar year 2010. These temporary tax increases contribute over $2 billion to PIT revenues in 2010–11. We project PIT collections to increase steadily in the out years as the economy continues to recover, but we do not expect collections to exceed their 2007–08 level of $54.2 billion until 2015–16.
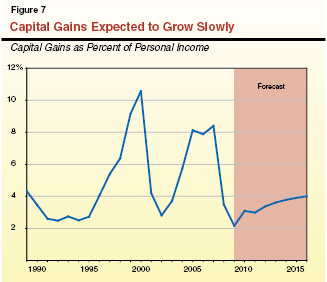
PIT Forecast Marked by Capital Gains, Federal Tax Uncertainties. Capital gains are important for PIT projections because these gains are concentrated among taxpayers who pay the highest marginal PIT tax rates. As Figure 7 shows, capital gains fluctuate wildly relative to personal income depending on the state of asset markets, and this always makes them difficult to forecast. They peaked at $120 billion in tax year 2000 at the height of the dot–com bubble but fell to $33 billion in 2002. Similarly, capital gains peaked at $132 billion at the height of the housing bubble in 2007, only to fall to $56 billion in 2008. We estimate that capital gains fell further to $34 billion in 2009. Our forecast reflects modest future growth in capital gains through 2016 due to improving stock prices and slowly increasing real estate values. If our forecast is off, this could have a significant effect on PIT collections and General Fund revenues. For example, for each $10 billion increase in capital gains, General Fund revenues increase by approximately $800 million.
Currently, there are two big variables that makes us particularly uncertain about capital gains. First, there is a large stock of unused losses. Taxpayers racked up far more capital losses than they could claim on returns in 2008 and probably again in 2009. Accordingly, we expect that these unused losses will hinder revenue growth for many years as taxpayers use 2008 and 2009 losses to offset future gains.
Second, there is significant tax policy uncertainty at the federal level regarding congressional action on expiring tax cuts. In 2001 and 2003, lower tax rates, including capital gains tax rates, were adopted, and these federal tax rate reductions are to expire this year. Our forecast assumes that this higher federal tax rate on capital gains returns to its higher level in 2011. This would cause some taxpayers to take gains in 2010 that otherwise would be taken in 2011. The actions Congress takes could affect the timing of these capital gain receipts and other economic and revenue variables in different ways. It seems as though the federal tax picture will be somewhat clearer by the time the new Governor releases his budget proposal in January.
Sales and Use Tax
End of Temporary Tax Increase and Proposition 26 Affect 2011–12 Forecast. In 2010–11, we expect SUT receipts of $27.3 billion, a 2.1 percent increase over the prior year. The 1 percent temporary SUT rate increase adopted in 2009—which contributes $4.7 billion of SUT revenue in 2010–11—will expire on June 30, 2011. For 2011–12, SUT revenues are projected to fall to $25.7 billion, reflecting the net effect of this rate drop, projected growth in the SUT taxable sales base of nearly 7 percent, and our assumption that voter approval of Proposition 26 on November 2, 2010 will undo the “fuel tax swap” adopted earlier this year. Under the terms of that measure, the gasoline sales tax is reinstated in November 2011, thereby also increasing General Fund spending on transportation. After 2011–12, taxable sales are expected to grow by 4 percent to 7 percent annually.
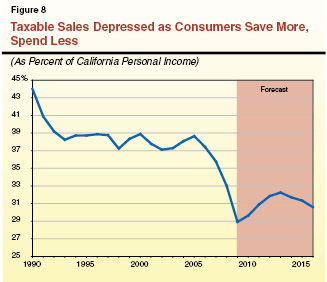
Taxable Sales Bottomed Out Last Year and Now Are Recovering. The main determinant of SUT receipts is taxable sales. About two–thirds of taxable sales result from retail spending by consumers, including a significant portion on light vehicles and trucks. Other important categories of taxable sales are the purchase of building materials involved in new construction and business–to–business transactions, where a business is the item’s final consumer. Taxable sales in California appear to have hit bottom in the second half of 2009, and are bouncing back.
As shown in Figure 8, overall consumer spending remains low relative to the levels of recent decades, when viewed as a percentage of personal income. It appears there has been a long–term trend toward lower taxable sales, relative to personal income, which has been influenced by: (1) the major recessions of the early 1990s and 2007–2009; (2) a trend toward more consumption of nontaxable services and other products (such as those purchased online, for which the collection of sales and use taxes is more difficult); and (3) increased household savings, particularly in the last few years.
Corporate Tax
Corporate Tax Forecast to Bottom Out in 2012–13 Before Rebounding. The CT receipts for 2009–10 are estimated to have totaled $9.5 billion, virtually unchanged from the previous fiscal year. Due to the slow recovery and policy changes enacted by the Legislature, we project CT receipts will fall sharply in 2011–12 and 2012–13. The tax bottoms out in 2012–13 at around $8 billion before rebounding back to around $10 billion by 2015–16.
Corporate Profit Rebound Does Not Necessarily Translate Into Higher Revenues. The main factor underlying CT receipts is the level of corporate profits that California taxes. California’s corporate profits, in turn, reflect the economic conditions facing Californians, as well as national and international economic conditions. At times, higher profits do not fully translate into higher CT receipts because these higher profits also make it possible for businesses to use more deductions and credits. Precise data on California taxable profits for 2009 and 2010 are not yet available, but our forecast assumes that corporate profits hit bottom in 2008–09 and rebounded rapidly in 2009–10. Profits in the final years of our forecast grow at about 5 percent each year.
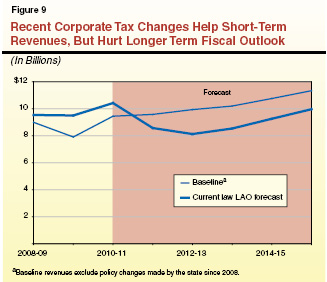
Policy Changes Reduce Long–Term Revenues. Policy changes made over the past few years have significant impacts on corporate tax receipts over the forecast period. As shown in Figure 9, increases of CT receipts due to policy changes negated what otherwise would have been a significant reduction in CT receipts in 2009–10. Recent tax policy changes also will boost receipts in 2010–11 by increasing collections by a net amount of around $1 billion. For the remainder of the forecast period, however, these same policy changes diminish CT receipts by between $1 billion and $2 billion each year. The major policy changes affecting the forecast include:
- Changes in Multistate Business Taxation. The elective single sales factor—the new option for businesses to annually choose which method is used to determine California taxable income—and associated tax law changes are estimated to reduce General Fund CT revenues by up to $1 billion per year within a few years.
- Revenue Accelerations. The Legislature has enacted several measures over the last couple of years that will allow the state to collect revenues earlier and delay the use of tax deductions or credits. The accelerations include the suspensions, for 2008 through 2011, of larger businesses’ use of net operating loss deductions. Recently enacted penalties on corporate taxpayers who are found to have significantly underpaid their taxes also serve to accelerate CT collections. This occurs as businesses try to avoid the penalties by paying upfront some of the tax they might have been forced to pay later following an audit. In addition, legislation limited the amount of tax credits a corporation could use in 2008 and 2009 to 50 percent of its tax liability for those years. This boosted near–term receipts but leads to increased use of those credits in 2010 and beyond. These changes, collectively, are estimated to bring in around $1.2 billion in 2010–11 but have the effect of decreasing CT revenues after 2011–12.
- Expanded Credit Use. Recent legislation also affected the use of tax credits. Changes in this area include the creation of new temporary tax credits for qualified employment and film production. Also, credits are now easier to use under a law that allows transfers of certain credits between companies that are treated as parts of a single unit for tax purposes. These changes reduce revenues by up to $500 million per year throughout the forecast period.
Other Revenues and Transfers
Estate Tax Highly Uncertain and Could Swell 2011–12 Problem by $2.7 Billion. Above, we discussed how congressional action in the coming months could affect capital gains and PIT receipts. In addition, congressional action or inaction on estate taxes could significantly affect the state’s ability to receive any of the $850 million of current–law estate tax receipts we project for 2010–11 (a half–year of receipts), as well as around $2 billion of annual receipts in each subsequent year of the forecast. As we discussed in prior reports, a 2002 federal law phased out estate taxes so that, by 2010, the estate tax was eliminated entirely. In 2011, this provision sunsets so that estate tax laws revert back to 2001 law—which means that tax rates would return to 2001 levels and the state pickup tax is restored. This pickup tax reduces federal estate taxes by the amount of state taxes levied on each estate, up to a certain level. As a result, many states—including California—set state tax levels at the maximum exemption level under federal law. There have been considerable efforts in recent years to change this current federal law to permanently limit both the federal and state estate tax. If Congress were to act to change the federal law, it appears there is a good chance the pickup tax exemption would not be restored. In this event, the 2011–12 budget problem would increase by $2.7 billion (recognizing the effects of both the half–year projected estate tax receipts of $850 million in 2010–11 and the first full year of receipts projected to be $1.8 billion in 2011–12). Later budget problems would grow by up to $2 billion per year above our forecast. (These amounts do not account for any Proposition 98 interactions.)
Fixed Asset Sales Slightly Above Enacted Budget Forecast in 2010–11. Assuming that recently announced sales of state office buildings and the Orange County Fairgrounds proceed as planned, our forecast projects $1.3 billion of one–time General Fund revenue in 2010–11. This total is about $100 million higher than assumed in the 2010–11 budget package.
End of Temporary Vehicle License Fee (VLF) Increase Affects 2011–12 Forecast. The temporary VLF increase enacted as part of the 2009–10 budget package expires at the end of 2010–11. This temporary increase generates $1.4 billion of revenue for the General Fund in 2010–11. Thereafter, the General Fund VLF rate declines again to zero in our forecast, although small amounts of VLF payments trickle in during subsequent fiscal years due to late payments. Figure 10 summarizes the VLF and other revenues that the state has received from the temporary tax package.
Figure 10
Estimated Revenues From Temporary Tax Increases Enacted as Part of the 2009–10 Budget Package
(In Billions)
|
|
2008–09
|
2009–10
|
2010–11
|
|
Sales and use tax—1 percentage point increase
|
$1.1
|
$4.4
|
$4.7
|
|
Personal income tax—dependent credit decrease
|
0.1
|
1.2
|
1.1
|
|
Personal income tax—0.25 percentage point increase
|
0.8
|
1.8
|
1.0
|
|
Vehicle license fee—0.5 percentage point increase
|
0.2
|
1.4
|
1.4
|
|
Totals
|
$2.2
|
$8.7
|
$8.3
|
Special Fund Loans Dominate the General Fund Transfers Forecast. In addition to tax, fee, and other revenues, the General Fund receives transfers from the state’s special funds and transfers money out to those same special funds. During the forecast period, the state’s transfers are to be dominated by loans received from special funds (the major component of the $1.4 billion of net transfers assumed in the budget package for 2010–11) and loan principal repayments back to special funds ($853 million of projected net transfers out in 2011–12, $1 billion in 2012–13, and $180 million in 2013–14). Our forecast assumes that approval of Proposition 22 on November 2, 2010 eliminates the possibility of the state borrowing $378 million of funds from transportation accounts assumed in the 2010–11 budget package. This reduces net transfers and loans in 2010–11 to $1 billion in our projections.
Demographic Projections
Department of Finance (DOF) Population Estimates Differ From Census Estimates. The DOF estimates that California’s July 1, 2009 population was 38.5 million and that the state’s population increased by 1 percent (or greater) in each year between 2001 and 2008 and by 0.93 percent in 2009. By contrast, the Census Bureau—in its annual estimates released prior to next year’s release of 2010 Census data—believed that California’s July 1, 2009 population was 37.0 million. The Census estimates differ from DOF’s because they assume that California’s net annual population growth rate has been somewhat under 1 percent in several years during the past decade. Data from the 2010 Census to be released in March 2011 should help resolve this demographic dispute.
Economic Downturn Probably Has Resulted in Fewer Newcomers. Relatively poor economic performance in California can make it less attractive for residents of other state and countries to migrate here. Based on historical experience, our population model suggests that the recent trend of Californians leaving the state probably is accelerating and will continue to do so through 2011. At the same time, the economic downturn will depress net international migration into California for the next several years. Births increase slowly as women continue to delay childbirth until later ages. Accordingly, as shown in Figure 11, our office estimates that total annual population growth in California will be 0.55 percent in 2010 and projects that population growth will be under 1 percent annually through 2015.
Figure 11
LAO’s California Demographic Forecasta
(In Thousands)
|
|
2009a
|
2010
|
|
2011
|
2012
|
2013
|
2014
|
2015
|
2016
|
|
Totals (July 1st)
|
38,488
|
38,699
|
|
38,863
|
39,137
|
39,453
|
39,803
|
40,191
|
40,643
|
|
Percent change
|
0.93%
|
0.55%
|
|
0.43%
|
0.70%
|
0.81%
|
0.89%
|
0.98%
|
1.12%
|
|
Change in population:
|
|
|
|
|
|
|
|
|
|
|
Births
|
553
|
548
|
|
527
|
526
|
534
|
542
|
549
|
557
|
|
Deaths
|
–237
|
–236
|
|
–241
|
–245
|
–249
|
–253
|
–257
|
–261
|
|
Net domestic migration
|
–173
|
–190
|
|
–225
|
–121
|
–98
|
–85
|
–54
|
–12
|
|
Net foreign migration
|
210
|
89
|
|
104
|
114
|
130
|
145
|
152
|
167
|
|
Net Change
|
353
|
211
|
|
165
|
274
|
316
|
349
|
389
|
451
|
Baby Boomers Will Swell Over–65 Population. Baby boomers born immediately after the end of World War II began to reach the age of 65 earlier this year. As this huge population cohort continues to reach this age, this group will swell in the coming years. We project the over–65 population generally will grow over 4 percent per year throughout our forecast period.
Modest Growth for K–12 and College–Age Population Groups. Our forecast assumes the K–12 population grows by 0.2 percent or less through 2013–14 before increasing slightly more rapidly. The 18–24 college age group is projected to increase very modestly through 2013 before beginning to decline thereafter. During the forecast period, this college–aged group largely consists of the offspring of the relatively small “Generation X”—those born in the two decades after the baby boom.
Chapter 3
Expenditure Projections
In this chapter, we discuss our General Fund expenditure estimates for 2009–10 and 2010–11, as well as our projections for 2011–12 through 2015–16. Figure 1 shows our forecast for major General Fund spending categories for all of these years. Below, we first discuss projected general budgetary trends and then discuss in more detail our expenditure projections for individual major program areas.
Figure 1
Projected General Fund Spending for Major Programs
(Dollars in Millions)
|
|
Estimates
|
|
Forecast
|
Average Annual
Growth From
2011–12 to
2015–16
|
|
2009–10
|
2010–11
|
2011–12
|
2012–13
|
2013–14
|
2014–15
|
2015–16
|
|
Education
|
|
|
|
|
|
|
|
|
|
|
K–14–Proposition 98
|
$35,669
|
$36,209
|
|
$34,184
|
$36,733
|
$38,847
|
$41,058
|
$43,270
|
6.1%
|
|
Proposition 98 QEIA and Settle–Up
|
300a
|
—a
|
|
750
|
750
|
750
|
750
|
472
|
–10.9
|
|
CSU
|
2,288
|
2,433
|
|
2,646
|
2,646
|
2,646
|
2,646
|
2,646
|
—
|
|
UC
|
2,449
|
2,711
|
|
2,815
|
2,815
|
2,815
|
2,815
|
2,815
|
—
|
|
Student Aid Commission
|
1,019
|
1,079
|
|
1,258
|
1,334
|
1,413
|
1,499
|
1,609
|
6.4
|
|
Health and Social Services
|
|
|
|
|
|
|
|
|
|
Medi–Cal
|
10,136
|
12,595
|
|
17,642
|
18,831
|
20,291
|
22,101
|
23,976
|
8.0
|
|
CalWORKs
|
1,995
|
2,143
|
|
3,041
|
3,140
|
3,130
|
2,960
|
2,676
|
–3.1
|
|
SSI/SSP
|
2,951
|
2,954
|
|
3,033
|
3,116
|
3,200
|
3,287
|
3,379
|
2.7
|
|
IHSS
|
1,488
|
1,419
|
|
1,732
|
1,835
|
1,903
|
1,973
|
2,045
|
4.2
|
|
Developmental Services
|
2,420
|
2,541
|
|
3,124
|
3,292
|
3,473
|
3,671
|
3,885
|
5.6
|
|
Mental Health
|
1,666
|
1,837
|
|
2,142
|
2,193
|
2,247
|
2,305
|
2,367
|
2.5
|
|
Other major programsb
|
3,185
|
2,823
|
|
3,327
|
3,460
|
3,518
|
3,457
|
3,751
|
3.1
|
|
Corrections and Rehabilitation
|
7,718
|
9,281
|
|
9,034
|
9,124
|
9,371
|
9,546
|
9,792
|
2.0
|
|
Judiciary
|
419
|
1,649
|
|
2,016
|
2,013
|
2,012
|
2,012
|
2,012
|
—
|
|
Proposition 1A Loan Costs
|
15
|
91
|
|
91
|
1,986
|
—
|
—
|
—
|
—
|
|
Infrastructure Debt Servicec
|
5,383
|
5,752
|
|
6,926
|
7,239
|
8,378
|
8,848
|
8,705
|
5.9
|
|
Other Programs/Costs
|
7,934
|
6,988
|
|
8,995
|
10,658
|
11,155
|
11,755
|
12,230
|
8.0
|
|
Totals
|
|
|
|
|
|
|
|
|
5.2%
|
|
Percent Change
|
|
6.3%
|
|
11.1%
|
8.2%
|
3.6%
|
4.8%
|
4.1%
|
|
General Fund Budget Trends
2010–11 Outlook
General Fund expenditures in 2010–11 are billions of dollars below their normal levels due to one–time or temporary actions, including (1) billions of dollars in federal stimulus funds received, (2) suspension of Proposition 98, and (3) funding shifts to non–General Fund sources. However, General Fund expenditures are forecast to increase from $87 billion in 2009–10 to $92.5 billion in 2010–11—an increase of 6.3 percent. This is much more than the budgeted increase of 0.2 percent that was expected when the budget was passed in October—due principally to our projection that a significant amount (around $3.5 billion) of assumed federal funds will not be secured. In addition, we project that several major programs—such as the prison system, In–Home Supportive Services (IHSS), and employee compensation—will be unable to achieve the full amount of budgeted reductions.
Expenditure Growth During the Forecast Period
Sharp Growth in 2011–12 as One–Time Savings Measures Expire. In 2011–12, our forecast shows General Fund spending climbing by 11 percent. This is principally the result of billions of dollars of one–time saving measures expiring. For example, Medi–Cal expenditures will increase by about $5 billion—the majority of this is due to expiring federal funds.
Lower Growth Projected After 2011–12. Our forecast shows General Fund spending growing by 8.2 percent in 2012–13, 3.6 percent in 2013–14, 4.8 percent in 2014–15, and 4.1 percent in 2015–16. As shown in Figure 1, this equates to an average annual growth rate of 5.2 percent between 2011–12 and 2015–16—slightly higher than the forecasted rate of personal income growth in the state during that period. The period is characterized by consistently high rates of growth in two areas that represent over half of the General Fund budget in 2015–16: (1) Proposition 98 spending for K–14 education, and (2) Medi–Cal. Although Proposition 98 spending for K–14 education is forecasted to drop in 2011–12, spending over the following years averages 6 percent annual growth as the economy continues its expected recovery. The largest growth in our forecast (8 percent) occurs in Medi–Cal due to growth in caseload and health care costs and, in the last two years of the forecast, the impact of federal health care reform. The remainder of the budget is forecast to grow at a modest 3.5 percent over the forecast period. This modest growth is due in part to the stated legislative policy of having no automatic cost–of–living adjustments (COLAs) or inflation adjustment for programs (as discussed in Chapter 1). For instance, our forecast shows no growth in General Fund appropriations to the universities or the courts after 2011–12.
Proposition 98—K–14 Education
State budgeting for K–14 education is governed largely by Proposition 98, passed by the voters in 1988. The measure, later modified by Proposition 111 in 1990, establishes a minimum funding requirement, commonly referred to as the “minimum guarantee,” for K–14 education. Both state General Fund and local property tax revenues apply toward meeting the minimum guarantee. Proposition 98 monies support child care, preschool, K–12 education, and the California Community Colleges—accounting for about 70 percent of total funding for these programs. (K–14 education funding also comes from the federal government, other state sources, and various local sources.)
Calculating the Minimum Guarantee. The Proposition 98 minimum guarantee is determined by one of three tests set forth in the Constitution. These tests are based on several inputs, including changes in K–12 average daily attendance, per capita personal income, and per capita General Fund revenue. Though the calculation of the minimum guarantee is formula driven, a supermajority of the Legislature can override the formulas and provide less funding than the formulas require. This happened in 2010–11, with the Legislature suspending Proposition 98 and providing less funding than otherwise required. As a result of the suspension, the state created an out–year Proposition 98 obligation referred to as a “maintenance factor.” When growth in state General Fund revenues is healthier (as determined by a specific formula set forth in the Constitution), the state is required to provide additional funding (make a maintenance factor payment) to build up K–14 funding to the level it otherwise would have been absent the earlier reduction. In essence, the maintenance factor allows the state to attain near–term savings without affecting the long–run level of K–14 support.
Proposition 98 Forecast
Minimum Guarantee Drops in 2011–12 Before Rebounding. The top part of Figure 2 shows our projections of the Proposition 98 minimum guarantee throughout the forecast period. For 2011–12, we project the minimum guarantee will be about $2 billion lower than the 2010–11 spending level due to the expiration of tax increases that temporarily raised tax revenues in 2009–10 and 2010–11. For the rest of the forecast period, we project steady increases in the minimum guarantee of $2 billion to $3 billion each year. Local property tax revenues modestly grow each year of the forecast period. In the last year of the forecast period, we project the Proposition 98 minimum guarantee and local property tax revenues would finally be higher than their pre–recession levels.
Figure 2
Proposition 98 Forecast
(Dollars in Millions)
|
|
2010–11
|
2011–12
|
2012–13
|
2013–14
|
2014–15
|
2015–16
|
|
Minimum Guarantee
|
|
|
|
|
|
|
|
General Fund
|
$36,465
|
$34,184
|
$36,733
|
$38,847
|
$41,058
|
$43,270
|
|
Local property tax
|
13,193
|
13,272
|
13,598
|
14,014
|
14,559
|
15,231
|
|
Totals
|
$49,658a
|
$47,456
|
$50,331
|
$52,861
|
$55,617
|
$58,501
|
|
Percent change
|
|
–4.4%
|
6.1%
|
5.0%
|
5.2%
|
5.2%
|
|
Proposition 98 “Test”
|
2
|
1
|
2
|
2
|
2
|
1
|
|
Proposition 98 Obligations
|
|
|
|
|
|
|
|
Maintenance Factor Created/Paid (+/–)
|
$475
|
$3,929
|
–$1,229
|
–$463
|
–$392
|
–$611
|
|
Outstanding Maintenance Factor
|
9,489
|
13,749
|
12,996
|
13,067
|
13,259
|
13,189
|
|
Key Factors
|
|
|
|
|
|
|
|
K–12 average daily attendance
|
–0.12%
|
0.14%
|
0.20%
|
0.17%
|
0.33%
|
0.50%
|
|
CCC full–time equivalent students
|
1.40
|
1.00
|
1.00
|
1.00
|
1.00
|
1.00
|
|
Per capita personal income (Test 2)
|
0.62
|
3.33
|
3.26
|
3.93
|
4.13
|
3.57
|
|
Per capita General Fund (Test 3)
|
5.92
|
–7.31
|
6.54
|
5.42
|
5.42
|
5.12
|
|
K–14 COLA
|
–0.39
|
1.78
|
1.34
|
1.76
|
2.23
|
2.37
|
|
Year–to–Year Change
|
|
–$1,946
|
$2,875
|
$2,530
|
$2,756
|
$2,884
|
|
Less Baseline Costs
|
|
|
|
|
|
|
|
K–14 COLA
|
|
–$864
|
–$663
|
–$883
|
–$1,144
|
–$1,252
|
|
K–14 attendance
|
|
–101
|
–124
|
–116
|
–206
|
–305
|
|
Backfill of one–time actions
|
|
–2,272
|
—
|
—
|
—
|
—
|
|
Funds Available/Shortfall (+/–)
|
|
–$5,184
|
$2,088
|
$1,531
|
$1,406
|
$1,326
|
Maintenance Factor Obligation Grows in 2011–12, Remains Large Throughout Period. Figure 2 also shows both how much maintenance factor is created or paid in each year of the forecast period and the total amount of outstanding maintenance factor. As shown in the figure, we estimate the state will have an outstanding maintenance factor obligation of $9.5 billion at the end of 2010–11. Using the same maintenance factor assumptions as used to build the last three Proposition 98 budgets, $4 billion in new maintenance factor would be created in 2011–12—resulting in a total outstanding obligation of about $14 billion. During the remainder of the forecast period, the state would make relatively small maintenance factor payments each year. Because maintenance factor obligations grow (akin to an inflationary adjustment) and the required payments are small, we project the state would end the forecast period still having an outstanding maintenance factor obligation of more than $13 billion.
Baseline Costs Much Higher Than Available Resources in 2011–12, Can Be Covered Thereafter. The bottom part of Figure 2 compares our projection of the year–to–year change in the Proposition 98 minimum guarantee with the amount needed to fund annual increases in baseline costs. As shown in the figure, the minimum guarantee would fall $5.2 billion short of fully funding baseline K–14 costs in 2011–12. (This shortfall would be a few hundred million dollars higher if the Legislature chooses to restore the California Work Opportunity and Responsibility to Kids [CalWORKs] Stage 3 child care program vetoed by the Governor this year.) That is, if the state funded at the minimum guarantee level in 2011–12, school districts and community college districts would face significant programmatic reductions. As shown in the figure, this is due to the decline in Proposition 98 funding in 2011–12 coupled with the cost of backfilling for the loss of one–time 2010–11 budget solutions. These reductions would occur at the same time as school districts exhaust one–time revenues from the federal American Recovery and Reinvestment Act (ARRA) of 2009 and the Education Jobs and Medicaid Assistance Act of 2010. In every subsequent year of the forecast period, the minimum guarantee funding level would be sufficient to cover growth and COLA and still have $1 billion to $2 billion to restore prior budget reductions. By 2015–16, the minimum guarantee would grow to sufficient levels that all growth and COLA costs could be paid and any reductions made in 2011–12 could be restored. Funding would be insufficient, however, to restore reductions made in 2008–09, 2009–10, and 2010–11.
Settle–Up Assumed to Be Paid in Installments Throughout Forecast Period. For 2009–10, the state provided $1.8 billion less than the minimum guarantee—creating a “settle–up” obligation of that amount. Additionally, for 2010–11, we assume a new $256 million settle–up obligation is created as a result of the Governor’s veto of Stage 3 child care funding (consistent with the administration’s intent). The 2010–11 budget contained a $300 million first payment toward retiring the 2009–10 settle–up obligation. Consistent with this action, we assume the state continues to make $300 million annual payments throughout the forecast period—fully retiring the settle–up obligations in the last year of the forecast.
Major Proposition 98 Issues
We believe the Legislature should be mindful of several major issues as it begins to develop a Proposition 98 budget strategy for the coming fiscal year.
Unresolved Maintenance Factor Issues Quickly Reemerge. As we discussed in our Analysis of the 2010–11 Budget: Proposition 98 and K–12 Education, conflicting interpretations of the constitutional provisions of Proposition 98 led to uncertainty over the amount of maintenance factor owed at the close of 2008–09. Specifically, disagreement existed regarding whether a maintenance factor was created when Test 1 applied and was lower than Test 2. The 2009–10 Budget Act resolved the issue by declaring that a maintenance factor obligation was created in 2008–09. Current law, however, does not clarify how this situation should be addressed in future years. In our forecast, this particular scenario reemerges in 2011–12, with the state potentially creating a maintenance factor obligation of $4 billion in 2011–12. (As indicated above, our forecast assumes a maintenance factor is created.) Differences of opinion also exist with regards to how maintenance factor payments should be calculated (either on top of the Test 2 level or the Test 1 level, if higher). This particular scenario reemerges in 2012–13, with an impact of about $900 million. (Our forecast assumes the lower Proposition 98 estimate, consistent with the manner in which the minimum guarantee was calculated in the 2009–10 and 2010–11 budgets.)
Potential Reductions on Horizon Suggest Rethinking Recent Deferrals. Given the potentially sizeable drop in the minimum guarantee next year (absent legislative action to add new revenues), one action the Legislature could take early in the upcoming budget cycle is eliminating the $1.8 billion in K–14 payments deferred until July 2011. (As part of the 2010–11 budget package, the state authorized 2010–11 spending using funds borrowed from 2011–12.) With the projected drop in the 2011–12 minimum guarantee, the recent payment deferrals would translate into K–14 cuts almost double the level otherwise needed in 2011–12. Given most districts have been cautious in increasing 2010–11 program support as a result of the recent deferrals and some districts have been unable to access cash sufficient to support new spending paid for by the new deferrals, many districts would not be significantly impacted in 2010–11 if the new deferral payments were eliminated. In essence, rather than encouraging school districts to hire new staff for half of the 2010–11 school year merely to have the new staff and even more existing staff laid off next year, the state would be encouraging school districts to retain their existing staff levels and plan for fewer layoffs next year. Such action would help minimize the funding cliff that could result next year.
Relying on More Deferrals Increasingly Problematic. Including the recent deferrals, 17 percent of K–14 program support is paid using funds borrowed from the next fiscal year. In monetary terms, the first $8.2 billion in Proposition 98 funds the state provides each year is paying for K–14 services that local educational agencies already have provided. Though districts are assumed to front the cash to support programs until the state makes payment, some local educational agencies (particularly small districts, districts with negative budget certifications, and charter schools) have had notable difficulty and/or have not been able to front the cash. As a result, for these agencies deferrals increasingly are translating into de facto cuts. For most districts, big and small, cash management has become an increasingly significant issue, with Fiscal Crisis and Management Assistance Teams reporting that the bulk of its district support is now devoted to cash flow management. These issues also are affecting the number of districts with negative or at–risk budget certifications, with 123 school districts in 2007–08 identified as having these certifications compared with 174 districts in 2009–10. Negative certifications in particular can make district borrowing significantly, if not prohibitively, more expensive. For all these reasons, the Legislature may want to avoid adopting new inter–year deferrals as part of its 2011–12 budget strategy as well as monitor district health to determine if more districts could need an emergency state loan in 2011–12.
Help Districts by Maximizing Flexibility and Sending Signals Early. Though the state might not be able to provide monetary relief to distressed districts, the Legislature can help school districts and CCC districts in various ways. Among the most notable ways are by retaining existing flexibility provisions, extending some of those provisions, and exploring new types of flexibility. Over the last couple of years, districts have reported relying heavily on these flexibility provisions to meet critical local needs and balance their budgets. In general, these flexibility measure expire at the end of 2012–13; yet, under state law, districts currently need to project costs through 2013–14 for budgeting purposes. Thus, another way the Legislature could help districts is by beginning to think about what flexibility rules it wants in place come 2013–14. The Legislature might want to consider fundamental school finance reform that could take a couple years to develop. Starting these conversations now will better position both the state and districts for whatever transition might happen in 2013–14.
Higher Education
In addition to the community colleges (which are discussed above as part of the Proposition 98 forecast), the state’s public higher education entities include the University of California (UC), the California State University (CSU), the California Student Aid Commission (CSAC), and the California Postsecondary Education Commission.
UC and CSU Expenditures
Our forecast assumes the universities’ annual operating costs will be roughly even at about $5.5 billion over the course of the forecast period. This reflects our overall forecast approach of not providing automatic COLAs. This amount is somewhat higher than state spending in 2010–11, which takes advantage of one–time federal stimulus funds that offset state costs. We discuss the stimulus funds in more detail below.
“Tidal Wave II” Is Over. Beginning in the 1990s, sustained growth in the traditional college–age population created ongoing enrollment pressures in higher education. This demographic bulge has been popularly known as Tidal Wave II (following a larger demographic surge in the 1960s). While there was some disagreement over the magnitude of Tidal Wave II, by all accounts the demographic growth has plateaued and the college–age population will actually be declining in the latter years of the forecast. Already the annual number of high school graduates has begun to shrink.
Enrollment demand at the universities results not just from the size of their eligibility pools, but also on the percentage of eligible individuals who seek admission. We are unable to project changes in this latter factor. We assume, however, that the shrinking eligibility pool would generally cancel out the effect of a modest increase in the demand rate. For this reason, we assume no increase in university enrollment during the forecast period.
Fees Projected to Continue Rising. A significant portion of core operating costs at the universities is covered by student fees. The state has no expressed policy for annual adjustments to these fees, which are set by the universities’ governing boards. In recent years, the universities have generally raised fees at double–digit rates in order to compensate for limited state funding. This pattern, as well as statements by the universities, suggests that student fees will continue to increase for the next few years. Any fee increases could be used to cover new costs—such as inflation and expansion of institution–based financial aid programs—that are not accounted for in our General Fund forecast. Expanded federal, state, and institutional student aid programs will offset a significant proportion of fee increases, particularly for lower–income students.
Federal Funds Provided One–Time Budget Solution. The Governor’s 2010–11 budget proposal included $305 million in General Fund augmentations to restore prior–year cuts of the same amount at UC and CSU. The Legislature instead approved General Fund augmentations of $199 million, and appropriated $106.6 million for each university system in one–time federal stimulus funding. Our forecast assumes that this federal funding is replaced with base General Fund support starting in 2011–12.
UC Restarting Contributions to Retirement Program. For close to two decades, neither the state nor UC employees have made contributions to the UC Retirement Program (UCRP). This is because, until recently, UCRP investments were sufficient to cover the retirement cost obligations for UC employees. This is no longer the case, and UC has re–instituted employee payroll contributions toward the UCRP. Meanwhile, as part of the 2009–10 budget package, the Legislature adopted statutory language declaring its intent that no new General Fund augmentations would be made toward UCRP costs. In the 2010–11 budget package, the Legislature deleted that language. A new budget provision directing UC to provide a long–term plan for renewed funding of UCRP, including a proposal for state contributions, was vetoed by the Governor.
Because there is no statutory formula or adopted plan governing state support for UCRP, we did not include General Fund costs for UCRP during the forecast period. Based on discussions with UC, however, we estimate that their proposal could call for state General Fund contributions exceeding $400 million annually by the end of the forecast period.
Key Choices Facing Legislature. Given that state General Fund resources are likely to continue to be severely constrained for the next several years, the Legislature faces key questions with regard to the higher education budget.
- How Much Should Students Pay? As noted above, the universities are likely to be increasing student fees at double–digit annual rates for at least the next several years. Not only does this affect the cost of education for students, it also increases state costs for the Cal Grant financial aid programs. The Legislature may wish to provide direction to the universities with regard to the share of education cost that non–needy students should be expected to pay.
- How Should the Universities Reduce Operating Costs? In a reversal of earlier budget reductions, the universities in 2010–11 are receiving more total funding per student than they were before the current recession began. Given the likelihood of continuing state budget constraints for the next several years, it may be necessary for the universities to reduce their per–student costs. The Legislature may wish to express expectations with regard to cost–saving opportunities related to student–faculty ratios, student remediation rates, articulation of course sequences, student assessment and placement, caps on the number of course units a student may take at subsidized rates, use of summer session, expansion of distance education and other alternative modes of instruction, and other considerations.
- How Should the State Address UCRP Costs? As discussed above, UC’s current plans to restart UCRP contributions envision a corresponding increase in UC’s General Fund support, reaching several hundred million dollars per year by the end of the forecast period. This constitutes one of the largest single General Fund augmentation requests the Legislature is likely to be considering in the near future. Until UC finalizes a detailed plan, we are unable to advise the Legislature on UC’s estimated state contribution. Besides the magnitude of any augmentation, the Legislature will also have to consider how state support would be adjusted in future years, including potential increases or decreases in UCRP normal costs and unfunded liabilities. For example, annual state contributions to UCRP could be tied to other public retirement systems (such as the California Public Employees Retirement System [CalPERS]). Alternatively, the state’s contribution to UCRP could take the form of a base increase to UC’s operating budget. The UC would then be expected to manage its retirement costs out of its regular General Fund appropriations as it does for most other ongoing support costs.
CSAC
Cal Grant Programs. Most of the state’s direct General Fund support for student financial aid is directed through the Cal Grant programs, which provide fee coverage and subsistence grants to eligible students. These costs increase with expanded program participation and fee increases. Based on these factors, we project that Cal Grant costs will increase from $1.1 billion in 2010–11 to $1.6 billion at the end of the forecast period.
Health
California’s major health programs provide health coverage and additional services for various groups of eligible persons—primarily poor families and children as well as seniors and persons with disabilities. The federal Medicaid program, known as Medi–Cal in California, is the largest state health program both in terms of funding and number of persons served. In addition, the state supports various public health programs, community services and state–operated facilities for the mentally ill and developmentally disabled, and health care insurance for children through the Healthy Families Program (HFP).
Phase–Out of Enhanced Federal Match. One factor that increases state costs for some health programs over the forecast period is the phase–out of the enhanced federal medical assistance percentage (FMAP) originally provided under ARRA and extended through June of 2011 by further congressional actions. Historically, the state and federal government share most Medi–Cal costs on a roughly equal basis. However, ARRA temporarily increased the federal share for California to almost 62 percent beginning in October 2008 and continuing through December 2010. Between January and June of 2011, the enhanced federal match will be phased out and the state’s share of most Medi–Cal costs will return to a roughly equal basis in July 2011. When the enhanced FMAP ends, it will reduce federal funding for programs in the departments of Health Care Services, Developmental Services, and Mental Health, among others. Our forecast assumes that the reductions in federal funding will be backfilled with General Fund spending. Notably, this has the effect of increasing the year–over–year percentage growth in General Fund spending for these programs in 2011–12 compared to 2010–11.
Impact of Federal Affordable Care Act (ACA). The ACA, also referred to as federal health care reform, is far–reaching legislation that will change how millions of Californians access health care coverage. Among many other provisions, the new federal law expands federal funding and eligibility for the Medi–Cal Program and mandates that individuals obtain private or public health coverage. Some key provisions will not take effect until 2014. The scope of ACA is so broad that it will be years before all of its provisions will be fully implemented and its overall ramifications fully understood. Over the next few years, the federal government will promulgate regulations that will clarify ACA and give more detailed guidance on how many of its provisions are to be implemented. Our fiscal forecast includes some significant budgetary adjustments to account for the implementation of ACA. However, our estimates of these adjustments are preliminary in nature and may change significantly in the future as more details emerge regarding ACA implementation.
Waiver Renewal Approved by Federal Authorities. The Department of Health Care Services (DHCS) submitted a Medi–Cal waiver request to the federal centers for Medicare and Medicaid Services (CMS). At the time this forecast was prepared, the waiver application had just been approved by CMS. As a result of an expected increase in federal funds of up to $500 million annually through 2014–15, we have reduced overall General Fund spending by comparable amounts. (These savings, which will accrue to various state departments, have not been allocated to specific health programs.)
Medi–Cal
Overall Spending Trends. We estimate that the General Fund spending for Medi–Cal local assistance administered by DHCS in the current year will amount to almost $12.6 billion. This is about $396 million, or 3.2 percent, more than appropriated in the 2010–11 Budget Act. We project that General Fund support will grow to $17.6 billion in 2011–12, a 40 percent increase from current–year expenditures. The biggest factors contributing to this year–over–year spending growth are: (1) changes in the FMAP discussed above that result in the need for the state to backfill lost federal funds with General Fund; (2) increases in caseload, utilization of services, and rising costs for those services; (3) erosion of budget savings; and (4) expiration of one–time solutions assumed in the 2010–11 budget plan. We project that spending will reach about $24 billion by the end of the forecast period in 2015–16.
Key Program Cost–Drivers. A significant forecast factor is our assumption that the cost per person of Medi–Cal health services will grow at an average annual rate of about 5.5 percent. We also project that the overall Medi–Cal caseload will grow nearly 4 percent annually commensurate with increases in the state population, policy changes, and other underlying trends. Due to the recent passage of ACA, as described above, Medi–Cal caseload will increase significantly beginning in January 2014. The federal government will cover the costs for those individuals who are considered newly eligible under ACA during the forecast period. The state will share costs for any increase in caseload in existing eligibility categories that results from persons enrolling in Medi–Cal in response to the individual coverage mandate created under ACA. We note that, due to ACA, our estimates related to caseload growth and other economic factors contain a significantly greater degree of uncertainty than in the last few years.
Erosion of Assumed Budget Savings. Due to implementation delays resulting from the passage of a late budget, we estimate that certain budget solutions will achieve less in savings than assumed in the 2010–11 spending plan. We also assume that none of an unspecified $323 million budget reduction in Medi–Cal will be achieved.
Expiration of One–Time Savings Measures. We estimate that Medi–Cal spending will increase significantly in 2011–12 due to the expiration of several one–time savings measures included in the 2010–11 budget plan. These savings include: (1) about $3 billion from the receipt of additional federal funds; (2) $560 million in hospital provider fee funds allocated for children’s health coverage; and (3) about $380 million in payment deferrals for institutional providers, managed care plans, and provider repayments to the federal government. The forecast assumes that these one–time savings measures will be backfilled with General Fund spending in 2011–12.
Healthy Families
We estimate that $123 million from the General Fund will be spent for support of HFP in 2010–11. An expected one–time contribution of $81 million from the California Children and Families Commission, $193 million from a temporary tax on Medi–Cal managed care plans, and reimbursements from other sources, is projected to bring total state support for the program in 2010–11 to $405 million. Due to the expiration of these one–time funding sources that offset General Fund support, we estimate that General Fund spending for HFP will grow to $425 million in 2011–12 and continue growing until 2014–15, but decline significantly in 2015–16 due to the impact of ACA.
Recent Caseload Trends Are Flat, but Growth Is Projected to Resume. Ever since enrollment dipped due to a temporary program closure in fall 2009, caseload in the HFP has remained relatively flat. We project that caseload will begin climbing again in 2011, and will continue to grow throughout the forecast period consistent with past annual caseload growth rates of approximately 5 percent.
Other Cost–Drivers. Our forecast assumes increased costs for provision of health care due to general growth in medical costs. In addition, the forecast includes local assistance cost increases associated with program changes required by the U.S. Children’s Health Insurance Program Reauthorization Act of 2009 (CHIPRA). The state may also incur further costs throughout the forecast period due to additional CHIPRA requirements for substance abuse, mental health, and dental benefits. These costs are not included in the forecast, due to uncertainty at this time regarding the cost implications of complying with these requirements.
ACA Provision Will Lower General Fund Costs in Out–Years. The ACA specifies that the federal matching rate for HFP will increase from 65 percent to 88 percent beginning October 1, 2015. If not for this enhanced match, we would project HFP General Fund costs of $570 million for 2015–16, the last year of our forecast period. Instead, we project that the enhanced federal match in 2015–16 will reduce HFP General Fund costs to $289 million.
Developmental Services
We estimate that the General Fund spending for developmental services in 2010–11 will total $2.5 billion. We project that General Fund support will grow to more than $3.1 billion in 2011–12, a 23 percent increase from current–year expenditures. This year–over–year projected growth is largely due to the phase out of the enhanced FMAP rate provided under ARRA and the expiration of temporary provider payment reductions that were implemented as a cost–cutting measure.
We project that General Fund support will grow to almost $3.9 billion by the end of the forecast period in 2015–16. This projected growth is largely due to increased caseload, utilization of services, and rising costs for community services provided in regional centers. Our forecast assumes that regional center caseloads will grow at an annual average rate of 3.6 percent, and that costs overall will grow at an average annual rate of about 7 percent.
Social Services
California’s major social services programs provide a variety of benefits to its citizens. These include income maintenance for the aged, blind, or disabled; cash assistance and welfare–to–work services for low–income families with children; protecting children from abuse and neglect; providing home–care workers who assist the aged and disabled in remaining in their own homes; and subsidized child care for families with incomes under 75 percent of the state median. Although state departments oversee the management of these programs, the actual delivery of many services at the local level is carried out by county welfare and child support departments. Most social services programs are supported by a mix of state, federal, and county funds. (In the nearby box, we also discuss the rising General Fund costs of the federal–state unemployment insurance program.)
General Fund Impact of the Unemployment Insurance Insolvency
The Unemployment Insurance (UI) program is a federal–state program that provides weekly UI payments to eligible workers who lose their jobs through no fault of their own. The UI program is financed by unemployment tax contributions paid by employers for each covered worker.
Insolvency. As we discussed in our recent report, California’s Other Budget Deficit: The Unemployment Insurance Fund Insolvency, the UI fund is currently insolvent and ended 2009 with a deficit of $6.2 billion. Based on earlier Employment Development Department (EDD) estimates, this report indicated that the deficit could reach $20 billion by the end of 2011. In its most recent fund forecast, EDD estimates that the fund will have a deficit of $10 billion at the end of 2010, rising to $13.4 billion in 2011 and $16 billion by the end of 2012.
Federal Loans. Because of the insolvency, EDD obtains federal loans on a quarterly basis to cover projected fund deficits. To date, the state has borrowed about $8.7 billion, permitting California to make benefit payments to UI claimants without interruption. Federal loans lasting more than one year generally will accumulate interest charges of about 5 percent per year on the outstanding balance.
Temporary Federal Relief. The federal economic stimulus package enacted in 2009, the American Recovery and Reinvestment Act, relieves states from making interest payments for UI loans through December 31, 2010. After December 2010, the state must resume making interest payments. The EDD estimates that the interest amount due in September 2011, for nine months of interest accruing from January 2011 through September 2011, will be about $360 million.
Addressing the Insolvency. To restore solvency, the state must increase employer taxes, reduce benefits, or do some combination of the two. Our report on the insolvency discusses the advantages and disadvantages of potential solutions to this difficult problem.
Budget Forecast. Absent corrective action, the UI fund will remain insolvent for the foreseeable future, and interest costs will continue to grow significantly. We estimate that these costs will reach about $700 million by the final year of our forecast, 2015–16. Under federal law, these interest charges cannot be paid from the UI fund. Our forecast assumes that these interest payments become a General Fund cost beginning in 2011–12.
|
Major Current–Year Adjustments. The 2010–11 budget provided $8.7 billion from the General Fund to support social services programs and departments. We now estimate that General Fund costs for social services will be $9.3 billion. Most of this increase is attributable to backfilling for assumed federal funds which have not been approved by Congress and anticipated delays in realizing savings from certain recently adopted budget solutions.
Overall Spending Trends in Social Services. Based on current law requirements, we project that General Fund spending will increase from a revised $9.3 billion in 2010–11 to approximately $10.7 billion in 2011–12 and $11 billion in 2012–13. For the final year three years of the forecast, we project that spending will remain relatively flat, reaching $11.1 billion in 2015–16. The $1.4 billion increase in 2011–12 is mostly attributable to the General Fund cost of backfilling temporary federal funds from the ARRA (discussed earlier in the “Health” section) and the expiration of certain short–term solutions adopted in the past two budget cycles. The relatively slow growth in the out–years of the forecast is because caseload growth in IHSS and Supplemental Security Income/State Supplementary Program (SSI/SSP) is offset by caseload declines in CalWORKs and Foster Care.
Costs of Providing COLAs. Current law suspends COLAs for social services programs. If the Legislature elected annually to provide the discretionary California Necessities Index COLAs for social services benefits, however, total General Fund costs in 2015–16 would be about $550 million higher than we have projected. This approach would result in additional costs of approximately $350 million in CalWORKs, $160 million in SSI/SSP, and $40 million in Foster Care. Similarly, if the Legislature elected to provide the counties, which administer most of these programs, with annual inflationary adjustments, total annual General Fund costs in 2015–16 would increase by about $410 million.
CalWORKs
Overall Spending Trends. For 2010–11, the state budget provided $1.7 billion from the General Fund for CalWORKs. The budget assumed that Congress would reauthorize the Temporary Assistance for Needy Families (TANF) Emergency Contingency Fund (ECF) and provide California with about $400 million to offset General Fund costs. However, the TANF ECF expired on September 30, 2010. Because Congress has not yet acted to continue the program, our forecast assumes a General Fund backfill of about $400 million. From a revised base of $2.1 billion in 2010–11, we project that spending will increase by about $900 million in 2011–12, peak at about of $3.1 billion in 2012–13, and then decline to about $2.7 billion by the end of the forecast period.
Our projection of a $1 billion increase in spending over the next two years is largely attributable to: (1) a General Fund backfill to replace a one–time savings from the accelerated receipt of TANF block grant funds in 2010–11, (2) caseload growth, (3) the fixed federal TANF block grant, which does not adjust for caseload increases, and (4) backfilling of TANF ECF funds. We explain these changes in more detail below. Last year, the Legislature made additional substantial short– and long–term policy changes in the CalWORKs program, as discussed below. Their fiscal effects are also reflected in the forecast.
Replacing One–Time Savings From Accelerated Receipt of Federal Funds. The 2010–11 budget assumes that California will take advantage of existing federal rules which allow states to draw down an extra 10 percent of their TANF block grant during the final quarter of the state fiscal year. On a one–time basis, this will result in increased federal funding of $366 million and corresponding General Fund savings. In 2011–12, the forecast provides a General Fund backfill of $366 million to replace the federal funding.
Caseload Costs Affected Mainly by Economic Conditions. The forecast reflects some significant assumptions about how the CalWORKs caseload and the state’s economy will change during the next five years. During 2008–09 and 2009–10, the caseload increased by about 8 percent and 10 percent, respectively, as the state suffered a severe recession. The rate of caseload growth appears to have peaked toward the end of calendar 2009 and the latest data through July 2010 indicate that the caseload has only grown by 2.3 percent over the last seven months. The latest data are consistent with the budget forecast of 4.7 percent caseload growth during 2010–11. We are forecasting growth of 4.5 percent in 2011–12 and 2.6 percent in 2012–13. After that, we expect the caseload to flatten, with a gradual decline in 2014–15 as the economy improves.
State, Rather Than Federal Government, Bears Caseload Costs. Although General Fund support for CalWORKs is only $2.1 billion in 2010–11, total program costs, including federal funds, are approximately $6 billion. Each 1 percent increase in caseload results in state costs of about $60 million per year, because the TANF block grant is fixed.
Additional Backfill for TANF ECF. Because federal support for CalWORKs from the TANF ECF ended in September 2010, the forecast assumes a backfill of about $400 million from the General Fund in 2010–11, with an additional $115 million in 2011–12.
Cost of Restoring Funds for Short–Term Policy Changes. For 2009–10 and 2010–11, the Legislature (1) exempted families with very young children or families with two or more preschool children from work participation requirements and (2) reduced associated county block grants for employment services and child care by $375 million. Our forecast reflects complete restoration of these reductions in 2011–12.
Savings From Long–Term Changes. Commencing in 2011–12, the Legislature created a system of (1) shortened time limits for most families on aid, (2) increased sanctions, and (3) new county service obligations for families affected by these new policies. The net impact of these changes is very hard to estimate, but our forecast assumes net savings of about $200 million beginning in 2011–12 and growing to $250 million in 2012–13.
SSI/SSP
State expenditures for SSI/SSP are estimated to be about $3 billion in 2010–11 and 2011–12. We project that General Fund support for SSI/SSP will increase by about $85 million each year, reaching about $3.4 billion by 2015–16.
Costs Primarily Driven by Caseload Growth. The spending increases that we project in SSI/SSP are primarily due to expected caseload growth of about 2.3 percent annually. In our forecast, the primary driver of the caseload increase is the anticipated growth in the aging population. As discussed earlier, the Legislature eliminated automatic COLAs for many programs, including SSI/SSP. Thus, COLA costs are not included in this forecast, contributing to the relatively slow spending growth in SSI/SSP.
IHSS
For 2010–11, we estimate that General Fund spending for IHSS will be about $1.4 billion, which is roughly $200 million above the budget appropriation. For 2011–12, we estimate General Fund costs will reach about $1.7 billion. We project that General Fund support for IHSS will increase to just over $2 billion in 2015–16. Most of the growth in spending occurs within the first two years of the forecast period, followed by more modest growth in the out–years. The $600 million in spending growth over the forecast period is primarily due to (1) the General Fund backfill of lost additional federal funds, (2) caseload growth, and (3) the expiration of a temporary budget reduction. Below, we first discuss the changes in 2010–11, and then turn to a discussion of the major IHSS program cost drivers in the out–years.
New Budget Solutions and Estimated Erosion in 2010–11. As noted above, our forecast assumes that IHSS program costs will be $200 million more than appropriated in 2010–11. As part of the 2010–11 budget plan for IHSS, the Legislature adopted (1) a provider tax and supplemental payment which will draw down additional federal funds, (2) a 3.6 percent reduction to authorized service hours, and (3) a caseload savings relative to prior estimates. Together, this package of solutions was estimated to save $300 million in 2010–11. For 2010–11, our review suggests that this package will only save about $155 million and that a portion of the savings ($45 million) from previously enacted anti–fraud activities will not be achieved. We discuss these adjustments below.
- Delayed Implementation. For both the provider tax and the 3.6 percent reduction in service hours, our forecast assumes later implementation than was assumed in the 2010–11 budget plan. This delay is likely because of the time required for recipient notification and automation system changes.
- Increased Utilization of Authorized Hours. In addition to our assumption related to delayed implementation, our forecast assumes further erosion of the savings associated with the 3.6 percent reduction in authorized service hours. Because not all recipients currently utilize all of their authorized hours, the approved reduction in authorized hours will not save 3.6 percent of program costs for all recipients.
- Interaction of Savings Estimates for Caseload and Anti–Fraud Activities. Due to technical interactions related to the assumed savings from anti–fraud activities and caseload savings, our forecast assumes less combined savings from these two factors than was included in the 2010–11 budget.
Backfill for Loss of Federal Funds in 2011–12. Because federal relief initially provided pursuant to the ARRA (discussed above in the “Health” section) ends in June 2011, the forecast provides a General Fund backfill of $298 million in 2011–12.
IHSS Caseload Growth. Our forecast assumes the IHSS caseload will grow at 3.3 percent per year throughout the forecast period, which is lower than in past years. This is based on recent data which reflect a slowing in the growth of the caseload. This lower caseload growth could be attributed to a combination of factors related to recent program changes.
Two–Year 3.6 Percent Service Hour Reduction and Current Law Suspension. As noted above, 2010–11 budget legislation temporarily reduced authorized hours for IHSS recipients by 3.6 percent through June 2012. As explained in our January 2010 report, How the Special Session Actions Would Affect Social Services, a federal judge has issued injunctions preventing implementation of service hours and wage reductions enacted in 2009–10. During the time the new 3.6 percent reduction is in place, budget legislation suspends the 2009–10 reductions to allow for current court challenges to be resolved. Given the uncertainty of the current litigation, our forecast assumes no savings from these 2009–10 reductions.
Judiciary and Criminal Justice
The major state judiciary and criminal justice programs include support for two departments in the executive branch—the California Department of Corrections and Rehabilitation (CDCR) and the Department of Justice—as well as expenditures for the state court system.
CDCR
Our forecast assumes that General Fund spending for the support of CDCR operations will increase from $9.3 billion in 2010–11 to $9.8 billion in 2015–16. This projection reflects additional costs to staff and operate new prison facilities that are expected to be constructed during the forecast period. As discussed below, we estimate that state spending on corrections will be almost $1 billion higher than the budgeted amount for 2010–11, primarily due to planned savings that largely will not be realized.
Policy Changes Needed to Fully Achieve Budget Savings. The 2010–11 budget assumed $820 million in savings in the federal Receiver’s inmate medical services program by releasing certain infirm inmates early from prison and placing them on parole based on their medical status and from other unspecified operational and policy changes. However, our forecast assumes that most of these savings will not be realized in the current year. This is primarily due to the absence of a complete plan as to how the Receiver will achieve all of the assumed savings. Moreover, our forecast also assumes that a separate $219 million population–related reduction in the 2010–11 budget will not be fully achieved as planned, due to the fact that sufficient statutory changes to allow for a significant reduction in correctional populations were not adopted as part of the budget.
Ongoing Operating Costs Projected to Increase. Chapter 7, Statutes of 2007 (AB 900, Solorio), authorizes the construction of tens of thousands of additional prison beds. Our projections assume that about 16,300 additional beds will be constructed pursuant to AB 900 during the forecast period, resulting in an estimated $800 million in additional General Fund expenditures to staff and operate the new facilities. As the new facilities are built, the Legislature will need to make policy and budgetary decisions regarding the level of programming and staffing to be provided at these facilities, which will determine the actual increase in operational costs. Given the likely magnitude of these eventual costs, as well as a federal court order to significantly reduce the state’s inmate population (see nearby box for more detailed information), the Legislature may wish to reconsider the need for some of the projects authorized under AB 900.
Federal Court Order to Reduce Inmate Population Not Reflected in Projections
On January 12, 2010, a federal three–judge panel issued a ruling requiring the state to reduce the inmate population in its prisons to 137.5 percent of design capacity—a reduction of roughly 40,000 inmates—within two years. However, the court stayed implementation of this court ruling pending the state’s appeal of the decision to the U.S. Supreme Court. The January 12 ruling does not specify the particular inmate population reduction measures that the state must implement. However, the court did require the administration to submit an inmate population reduction plan on November 19, 2009, and indicated in its January 12 ruling that the administration could implement the measures identified in the plan. This plan included certain changes that were adopted as part of the 2009–10 budget (such as increasing the credits that inmates can earn to reduce their stay in prison), as well as certain changes that the Governor proposed for 2010–11 but were rejected by the Legislature (such as requiring that certain felons be incarcerated in county jail in lieu of state prison).
The U.S. Supreme Court is scheduled to hear the state’s appeal on November 30, 2010. Given that the ruling is still under appeal, our forecast does not reflect the savings that could result from such a massive population reduction. However, if the court were to uphold the three–judge panel’s ruling and the state inmate population were to be reduced 137.5 percent of design capacity, we estimate that state spending could decline beginning in 2011–12 in the range of about several hundreds of millions of dollars annually relative to our baseline forecast for the California Department of Corrections and Rehabilitation.
|
Providing Inflationary Adjustments Would Further Increase Spending. As discussed earlier in this report, our forecast assumes no price adjustments for CDCR’s operating expenses and equipment. If the Legislature were to provide such adjustments each year, we estimate that the department’s expenditures would increase by about $350 million annually by the end of the forecast period, relative to our baseline projections. (This estimate does not include adjustments for employee compensation increases, which are discussed later in this chapter.)
Judicial Branch
General Fund spending for the support of the judicial branch is projected to remain relatively flat at roughly $2 billion from 2011–12 through 2015–16. This amount is, however, higher than the amount the state will spend in 2010–11. As part of the 2010–11 budget package, a one–time shift of redevelopment funding will offset $350 million in General Fund costs for the trial courts in the current year. Our forecast assumes that the General Fund will replace the $350 million in 2011–12 and future years.
Providing Inflationary Adjustments Would Further Increase Spending. As discussed earlier in this report, our forecast assumes no inflationary adjustments to the operating budget of trial courts. If the Legislature were to provide such adjustments, we estimate that operating expenditures for trial courts would increase by roughly $540 million annually by the end of the forecast period, relative to our baseline projections.
Other Programs
Employee Compensation
The 2010–11 Budget Act assumes $1.4 billion in General Fund savings from various actions affecting state employee pay and benefit costs, including: a 12–month personal leave program (PLP) and increased employee pension contribution rates for most executive branch employees; a three day per month furlough program for employees in the six bargaining units with expired contracts; and an executive order directing departments to reduce workforce costs by 5 percent.
Short–Term Net Personnel Savings. Our forecast assumes $1 billion in net employee compensation savings in 2010–11. We expect that difficulties associated with the implementation of the workforce cost reduction and other factors will result in over $300 million of the projected budget act savings not being realized.
No Net Savings in Out–Years. In our forecast, we estimate state costs to pay (1) salary increases beginning 2012 or 2013 for employees at their top step (pursuant to memoranda of understanding for the 15 bargaining units with ratified contracts) and (2) employee healthcare premiums (forecast to increase by 7.7 percent annually). By the end of the forecast period, these costs will more than offset the state’s ongoing savings from the increased employee pension contribution rates and workforce cap. In addition, we estimate that state savings from the unpaid leave programs will end by mid–2011–12 because the PLP expires after 12 months, and the administration currently does not have authority to extend furloughs beyond 2010–11. Consistent with current labor agreements and law, our forecast assumes no other salary increase through 2015–16, other than the ones described above.
Uncertainties. Many factors make it difficult to project future state employee compensation costs. New labor agreements with employee bargaining units could affect state savings under the unpaid leave programs. Similarly, actions by the Governor and/or Legislature to extend the leave programs or make other changes to employee compensation (beyond the top step pay increases included in the current bargaining agreements) could increase or decrease annual General Fund costs in the hundreds of millions of dollars each year.
Public Employee Retirement Costs
Our forecast reflects current–law increases in the state’s annual payments to four major public employee retirement programs: pension programs for state and CSU employees, the teachers’ pension program, state and CSU retiree health benefit programs, and pension programs for judges. (The teachers’ pension program is administered by the California State Teachers’ Retirement System [CalSTRS], and the other three programs are administered by CalPERS.) The state’s required contributions to CalPERS for state and CSU pensions are forecasted to be about $3.6 billion (all funds) in 2010–11, growing to $3.9 billion in 2015–16. (This figure reflects estimated savings due to recent collective bargaining agreements that increase some employees’ pension contributions.) The General Fund pays just under 60 percent of these costs. The state’s required payments to CalSTRS—paid entirely from the General Fund—are estimated to be $1.3 billion in 2010–11 and grow to over $1.5 billion in 2015–16. The state’s “pay–as–you–go” retiree health benefit contributions to CalPERS are forecast to grow from $1.4 billion in 2010–11 to over $2 billion in 2015–16.
State Payroll, Investment Return Assumptions, and Stock Values Drive CalPERS Costs. Our forecast includes fairly modest growth projections for the state’s CalPERS contributions. This is in contrast to consistent warnings from the system in recent years that state contribution rates are on track to increase significantly over time—due to the need to cover added liabilities resulting from the system’s 2008–09 investment declines and recent demographic experience of the system. There are several reasons for our projections:
- Our assumption that state employees receive no salary increases except for the one step increase included in many of the labor agreements recently passed by the Legislature. (The CalPERS actuarial assumptions, by contrast, assume steady, regular, annual pay growth.)
- Our assumption that investment returns will hit CalPERS’ current actuarial investment rate target—7.75 percent per year—each and every year and that other current actuarial assumptions will be met.
- Our assumption that the current actuarial investment rate target will not change, despite indications from system officials that it might as soon as next year.
Each of these key assumptions serves to contain growth of the state’s CalPERS contributions. If one or more of them were changed, the state’s contributions could be hundreds of millions of dollars higher than indicated in our forecast by 2015–16.
Additional Contributions to CalSTRS Assumed. Typically, the state pays about 4.5 percent of prior–year teacher payroll to CalSTRS. The CalSTRS also receives payments from school districts and teachers to cover its pension program costs. Under state law, the General Fund must contribute additional funds each year when certain unfunded liabilities emerge. Our forecast assumes that the system’s 2010 actuarial valuation—to be completed in 2011—will show that such unfunded liabilities emerge as the system recognizes more of its investment losses from 2008–09. In our forecast, these added contributions total $106 million in 2011–12 and grow to $392 million by 2012–13. (These added contributions are very small compared to the amount of funding the system would require to eliminate its unfunded liabilities over the next three decades.) In addition, our forecast assumes that in 2012–13 the state will finish paying off its court–ordered payments to compensate CalSTRS for the state’s decision to withhold a $500 million required contribution in 2003–04. Currently, the state pays $57 million per year related to the court order.
Unfunded Liabilities Will Persist. The state’s retirement programs are projected to have significant—and growing—unfunded liabilities through the forecast period. Because our forecast includes only current–law pension contribution requirements, it does not include funding sufficient to begin to reduce CalSTRS’ unfunded liabilities, and it includes no resources to assist UC in restoring its pension program to a sound funding position. It also includes no funding to begin to pay down large unfunded liabilities for state, UC, and CSU retiree health costs. If the state does not initiate benefit decreases and/or contribution increases very soon, the extra costs needed to retire these huge unfunded liabilities over the next few decades will spiral upward.
State–Mandated Local Programs (Non–Education)
Over the last several years, the Legislature has taken various actions to reduce or defer costs for state mandates on local governments (cities, counties, and special districts). These actions include permanently repealing mandates, suspending statutory requirements to implement mandates, and deferring payments towards retiring the state’s backlog of mandate claims (over $1 billion). In signing the 2010–11 budget, the Governor eliminated funding for two mandates (AB 3632 and Background Checks) and asserted that local government responsibility for implementing these mandates was suspended for 2010–11.
Mandate Costs Escalate Sharply. Our forecast assumes that the Legislature continues to suspend all mandates that it suspended in 2011–12. Because state law does not appear to authorize the Governor to suspend mandates, we assume that local governments continue to implement the AB 3632 and Background Checks mandates during 2010–11 (and throughout the forecast period) and that the state reimburses local governments for these mandated costs. Our forecast also assumes that the state makes annual payments to retire the backlog of mandate claims, as specified in current law. Under these assumptions, state costs for mandates would increase from $80 million in 2010–11 to over $500 million annually throughout the forecast period.
Debt Service on Infrastructure Bonds
The state uses General Fund revenues to pay debt–service costs for principal and interest payments on two types of bonds primarily used to fund infrastructure—voter–approved general obligation bonds and lease–revenue bonds approved by the Legislature. We estimate that General Fund costs for debt service on these bonds will be $6 billion in 2010–11 and $7.2 billion in 2011–12. General Fund debt service is projected to grow at 8.4 percent annually between 2010–11 and 2015–16. Annual General Fund costs are about $1 billion higher each year due to the recent passage of Proposition 22 and 26 which restricted the use of transportation funds to pay bond costs. The relatively high pace of debt–service growth is due in part to the increase in bond sales from the large general obligation bond authorizations in 2006 and 2008, as well as the growing issuance of AB 900 lease–revenue bonds for the prison system. Our forecast is based on the planned sale of bonds that already have been authorized, but does not include any proposed bonds—such as the water bonds now scheduled for the 2012 ballot. Our forecast also assumes a minor reduction in debt–service costs—approximately 1 percent of total General Fund debt–service costs over the forecast period—due to the planned sale–leaseback of 11 state office properties. Because the sale proceeds will be used to retire the outstanding debt on those buildings, the scheduled debt–service payments are eliminated. (This reduction in General Fund debt–service costs, however, is more than offset by the cost of leasing those facilities back from the new owners.)
Debt–Service Ratio (DSR) Expected to Rise. The DSR for general obligation and lease–revenue bonds—that is, the ratio of annual General Fund debt–service costs to annual General Fund revenues and transfers—is often used as one indicator of the state’s debt burden. There is no one “right” level for the DSR. The higher it is and more rapidly it rises, however, the more closely bond raters, financial analysts, and investors tend to look at the state’s debt practices, and the more debt–service expenses limit the use of revenues for other programs. Figure 3 shows what California’s DSR has been in the recent past and our DSR projections for the forecast period.
The DSR we are projecting—slightly above 9 percent at its peak—is considerably higher than it has been in the past. This reflects the sharp, recent fall–off in General Fund revenues, the planned sale of the large bonds approved since 2006, and the voters’ recent approval of Propositions 22 and 26. To the extent additional bonds are authorized and sold in future years beyond those already approved, the state’s debt–service costs and DSR would be higher than projected in Figure 3.