This publication summarizes California’s 2013–14 spending plan, including legislative and gubernatorial action through October 2013. A preliminary electronic version was released prior to gubernatorial actions on bills passed by the Legislature in August and September 2013. This final published version reflects gubernatorial action on those bills and various minor changes.
Figure 1 displays state and federal spending in the 2013–14 Budget Act.
Figure 1
Total State and Federal Fund Expenditures
(Dollars in Millions)
|
Fund Type
|
Revised
|
Enacteda
2013–14
|
Change From 2012–13
|
|
2011–12
|
2012–13
|
Amount
|
Percent
|
|
General Fundb
|
$86,404
|
$95,665
|
$96,281
|
$617
|
0.6%
|
|
Special funds
|
33,853
|
38,656
|
42,022
|
3,366
|
8.7
|
|
Budget Totals
|
$120,257
|
$134,321
|
$138,303
|
$3,982
|
3.0%
|
|
Selected bond funds
|
$6,104
|
$12,261
|
$6,997
|
–$5,264
|
–42.9%
|
|
Federal funds
|
73,063
|
81,299
|
87,566
|
6,266
|
7.7
|
Total State and Federal Funds Spending
The state spending plan assumes total budget expenditures of $138.3 billion from the General Fund and special funds, an increase of 3 percent over 2012–13. This consists of $96.3 billion from the General Fund and Education Protection Account created by Proposition 30 (2012), as well as $42 billion from special funds. The budget estimates that spending from federal funds in 2013–14 will total $87.6 billion, an increase of 7.7 percent over 2012–13. (Unless otherwise specified, figures in this publication generally reflect the administration’s official scoring as of late June 2013. As such, figures do not reflect budget–related legislation enacted between July and October, including Chapter 310, Statutes of 2013 [SB 105, Steinberg], which appropriated $315 million to the California Department of Corrections and Rehabilitation [CDCR] for 2013–14.)
General Fund Revenues
Figure 2 displays the key revenue assumptions underlying the 2013–14 Budget Act.
Figure 2
2013–14 Budget Act Revenue Assumptions
General Fund and Education Protection Account Combined (Dollars in Millions)
|
|
2011–12 Estimated
|
2012–13 Estimated
|
2013–14 Enacted
|
Change From 2012–13
|
|
Amount
|
Percent
|
|
Personal income tax
|
$54,261
|
$63,901
|
$60,827
|
–$3,074
|
–4.8%
|
|
Sales and use tax
|
18,658
|
20,240
|
22,983
|
2,743
|
13.6
|
|
Corporation tax
|
7,233
|
7,509
|
8,508
|
999
|
13.3
|
|
Subtotals, “Big Three” taxes
|
($80,152)
|
($91,650)
|
($92,318)
|
($668)
|
(0.7%)
|
|
Insurance tax
|
$2,165
|
$2,156
|
$2,200
|
$44
|
2.0%
|
|
Other revenues
|
2,959
|
2,641
|
2,249
|
–392
|
–14.8
|
|
Transfers and loans
|
1,509
|
1,748
|
331
|
–1,416
|
–81.0
|
|
Totals
|
$86,786
|
$98,195
|
$97,098
|
–$1,096
|
–1.1%
|
Budget Projects Lower Revenues in 2013–14. The spending plan estimates General Fund and Education Protection Account revenues of $97.1 billion in 2013–14, a decrease of 1.1 percent over 2012–13. The budget assumes that one–time state revenue associated with the 2012 Facebook initial public offering and decisions made by wealthy individuals to accelerate income from 2013 to 2012 due to changes in federal tax policy will inflate 2012–13 revenues, contributing to a year–over–year decline in 2013–14.
The Condition of the General Fund
Figure 3 summarizes the estimated General Fund condition for 2012–13 and 2013–14.
Figure 3
General Fund Condition
General Fund and Education Protection Account Combined (Dollars in Millions)
|
|
2012–13
|
2013–14a
|
Percent Change
|
|
Prior–year balance
|
–$1,658
|
$872
|
|
|
Revenues and transfers
|
98,195
|
97,098
|
–1.1%
|
|
Total resources available
|
$96,537
|
$97,970
|
|
|
Total expenditures
|
$95,665
|
$96,281
|
0.6%
|
|
Fund balance
|
$872
|
$1,689
|
|
|
Encumbrances
|
$618
|
$618
|
|
|
Reserve
|
$254
|
$1,071
|
|
2012–13 Projected to Be First Year Since 2007–08 to End With a Reserve. The administration’s May Revision estimates of 2012–13 revenues were about $2.3 billion higher than when the 2012–13 spending plan was adopted last year. As discussed in “Chapter 2,” these higher revenues result in $2.5 billion in additional expenditures under the Proposition 98 minimum funding guarantee for K–14 education. In addition, higher expenditures in other areas contributed to the estimated 2012–13 General Fund ending balance being about $694 million lower than was assumed in the 2012–13 spending plan. Nevertheless, under the spending plan 2012–13 would end with a $254 million reserve, the first such year–end positive balance in the reserve since 2007–08.
2013–14 Projected to End With a $1.1 Billion Reserve. The spending plan assumes General Fund and Education Protection Account revenues of $97.1 billion and expenditures of $96.3 billion. Those assumptions, however, are based on the administration’s official scoring as of late June 2013. As such, they do not include budget–related legislation enacted between July and October, including Chapter 310, which appropriated $315 million (General Fund) to CDCR for 2013–14. After accounting for this and other post–budget act legislation, 2013–14 would end with a roughly $700 million General Fund reserve.
Major Features of the 2013–14 Budget Plan
Contrary to recent years in which the state took actions to address multibillion dollar budget shortfalls, the spending plan augments programmatic spending in a few areas. The major features of the spending plan are summarized below. These actions and others are described in more detail in “Chapter 2.”
School Funding. Major features of the Proposition 98 budget include $2.1 billion for a new formula to distribute funding amongst schools, $1.25 billion in one–time funding to implement the Common Core State Standards, and $4.3 billion in 2012–13 and 2013–14 combined to pay down deferrals to schools and community colleges.
Medi–Cal Expansion. Legislation adopted in a special session implements a state–based plan to expand Medi–Cal. Specifically, the plan exercises an option pursuant to federal health care reform to expand eligibility for Medi–Cal to cover more than one million additional low–income adults who will become eligible for health care coverage on January 1, 2014.
Selected Restorations of Funding From Prior Year Program Cuts. The budget plan includes spending increases for a few programs that were cut or eliminated in recent years. The most significant of these actions provide a $63 million ongoing augmentation for the judicial branch and a partial restoration of adult dental benefits under Medi–Cal ($17 million, partial–year effect).
Other Program Augmentations. The spending plan also includes $143 million in one–time funding for mental health services infrastructure and provides enhanced mental health and substance use disorder services ($67 million, partial–year effect). In addition, budget–related legislation augments California Work Opportunity and Responsibility to Kids (CalWORKs) grants by diverting revenue growth in the Local Revenue Fund created by 1991 realignment that otherwise would have increased funding for county health programs and other social services programs. This action is assumed to have no General Fund effect in 2013–14. The spending plan also creates a new financial aid program for certain students at the University of California and California State University beginning in the 2014–15 school year.
Changes to 1991 Realignment. The Medi–Cal expansion discussed above shifts much of the responsibility for providing indigents with health care from the counties to the state. To capture the savings that counties are expected to experience under the expansion, the budget redirects funding from 1991 realignment to the benefit of the General Fund. The spending plan assumes the state savings to be $300 million in 2013–14.
The Governor signed the 2013–14 Budget Act on June 27, 2013. Between that date and October 2013, the Governor signed 44 budget–related bills into law. The budget and related bills are listed in Figure 4.
Figure 4
Selected Budget–Related Legislation
|
Bill Number
|
Chapter
|
Author
|
Subject
|
|
AB 110
|
20
|
Blumenfield
|
2013–14 Budget Act
|
|
AB 74
|
21
|
Budget Committee
|
Human services
|
|
AB 75
|
22
|
Budget Committee
|
Transfer of DADP programs to DHCS and DPH
|
|
AB 81
|
161
|
Budget Committee
|
Public safety: domestic abuse
|
|
AB 82
|
23
|
Budget Committee
|
Health
|
|
AB 85
|
24
|
Budget Committee
|
1991 realignment, CalWORKs grants
|
|
AB 86
|
48
|
Budget Committee
|
K–14 education and child care
|
|
AB 89
|
25
|
Budget Committee
|
Developmental services
|
|
AB 92
|
26
|
Budget Committee
|
State government
|
|
AB 93
|
69
|
Budget Committee
|
Enterprise zones
|
|
AB 94
|
50
|
Budget Committee
|
Higher education, MCS
|
|
AB 97
|
47
|
Budget Committee
|
K–12 LCFF
|
|
AB 98
|
27
|
Budget Committee
|
Seismic Safety Commission
|
|
AB 101
|
354
|
Budget Committee
|
Amendments to the 2013–14 Budget Act
|
|
AB 106
|
355
|
Budget Committee
|
Enterprise zones
|
|
AB 113
|
3
|
Budget Committee
|
Amendments to the 2012–13 Budget Act
|
|
AB 234
|
449
|
Gatto
|
Claims against the state
|
|
AB 478
|
391
|
Gomez
|
Employee compensation MOU
|
|
AB 701
|
393
|
Quirk–Silva
|
Orange County—property taxes
|
|
SB 67
|
4
|
Budget Committee
|
IHSS
|
|
SB 68
|
5
|
Budget Committee
|
Amendments to 2012–13 Budget Act
|
|
SB 71
|
28
|
Budget Committee
|
State government
|
|
SB 73
|
29
|
Budget Committee
|
Proposition 39 implementation
|
|
SB 74
|
30
|
Budget Committee
|
Corrections
|
|
SB 75
|
31
|
Budget Committee
|
Courts
|
|
SB 76
|
32
|
Budget Committee
|
Public safety
|
|
SB 78
|
33
|
Budget Committee
|
Tax on managed care organizations
|
|
SB 82
|
34
|
Budget Committee
|
Mental health wellness act
|
|
SB 85
|
35
|
Budget Committee
|
Transportation
|
|
SB 89
|
36
|
Budget Committee
|
Augmentations to the 2012–13 Budget Act
|
|
SB 90
|
70
|
Galgiani
|
Economic development
|
|
SB 91
|
49
|
Budget Committee
|
Amendments to LCFF
|
|
SB 94
|
37
|
Budget Committee
|
Medi–Cal managed care, IHSS, and CCI
|
|
SB 96
|
356
|
Budget Committee
|
Resources and environmental protection
|
|
SB 97
|
357
|
Budget Committee
|
K–12 LCFF, MCS, Proposition 39, and other education provisions
|
|
SB 98
|
358
|
Budget Committee
|
Health and human services
|
|
SB 99
|
359
|
Budget Committee
|
Active transportation program
|
|
SB 100
|
360
|
Budget Committee
|
Public finance
|
|
SB 101
|
361
|
Budget Committee
|
Health
|
|
SB 102
|
397
|
Budget Committee
|
Employee compensation MOU
|
|
SB 105
|
310
|
Steinberg
|
Prisons
|
|
SB 239
|
657
|
Hernandez
|
Hospital quality assurance fees
|
|
ABX1 1
|
3
|
John A. Pérez
|
Medi–Cal ACA implementation
|
|
SBX1 1
|
4
|
Hernandez
|
Medi–Cal ACA implementation
|
|
SCA 3
|
123
|
Leno
|
Mandates
|
Significant Operating Surpluses Estimated to Produce $1 Billion Reserve. On January 10, 2013, the Governor released his 2013–14 budget proposal, which included General Fund and Education Protection Account revenues of $98.5 billion and expenditures of $97.7 billion. The administration estimated that a $2.4 billion operating surplus in 2012–13 would be sufficient to erase the $2.2 billion 2011–12 deficit. The administration also projected that the resulting $167 million ending balance for 2012–13 and a $851 million operating surplus in 2013–14 would produce a $1 billion reserve at the end of 2013–14.
Governor’s May Revision Revenue Estimates Increase Slightly. The administration’s revenue estimates at the May Revision grew by $749 million for 2011–12, 2012–13, and 2013–14 combined. (This total excludes a $500 million loan to the General Fund from cap–and–trade revenues, which is booked on the revenue side of the state budget.) The May Revision contained a few major proposals, the most noteworthy of which realigned some fiscal responsibilities for CalWORKs, CalWORKs–related child care, and CalFresh from the state to counties. That proposal was estimated to achieve $300 million in General Fund savings in 2013–14, growing to $1.3 billion in savings by 2015–16.
Legislature Passes Budget Package. Our office’s May 2013 revenue forecast projected considerably higher revenues than did the administration’s May revenue forecast. Specifically, we estimated about $3.2 billion higher General Fund and Education Protection Account revenues across 2011–12, 2012–13, and 2013–14 combined. The most significant difference in our forecasts was our higher assumed level of capital gains and resulting personal income tax revenues in 2013–14. During hearings in late May, the budget committees in the Senate and Assembly adopted our office’s revenue estimates. After negotiations with the Governor, however, the Legislature passed a budget package that incorporated the administration’s lower revenue estimates. As discussed in “Chapter 2,” that package included a modified version of the administration’s realignment proposal that did not affect CalWORKs–related child care or CalFresh.
Budget Package Signed by Governor. The budget package was signed by the Governor on June 27, 2013. Notably, aside from one action to correct a technical error in the Franchise Tax Board budget, the Governor did not use his line–item veto authority to reduce or eliminate non–Proposition 98 General Fund spending. The Governor did, however, reduce spending from other funds by $5.6 million.
Legislature Adopts Additional Budget–Related Legislation. The Legislature sent several budget–related bills to the Governor in late June and early July. These included bills that addressed issues related to the California Public Records Act and Local Agency Ethics mandates. In addition, the Legislature passed AB 93 to phase out Enterprise Zones over several years and replace them with: (1) a partial sales tax exemption for purchases of certain manufacturing equipment, (2) a narrowly focused hiring tax credit, and (3) a program to provide tax credits to select businesses on a case–by–case basis.
Governor Signs Legislation to Address Prison Population. In September 2013, the Governor signed Chapter 310, which provides $315 million (General Fund) to CDCR to address a federal order requiring the state to reduce the prison population. Chapter 310 is described in more detail in “Chapter 2.”
Approved by voters in 1988, Proposition 98 established a set of rules relating to education funding. Most importantly, Proposition 98 established a funding requirement commonly referred to as the minimum guarantee. Each year the minimum guarantee is determined by one of three formulas, known as “tests.” The tests take into account a number of inputs, including General Fund revenues, per capita personal income, and K–12 average daily attendance (ADA). In certain cases, the state can provide less than otherwise required, but it must keep track of a resulting “maintenance factor” obligation. Moving forward, the state is required to accelerate growth in Proposition 98 funding until the maintenance factor is retired—at which time base funding is at least as high as it would have been absent the earlier reduction. The guarantee is met using both state General Fund and local property tax revenues. Proposition 98 is the main funding source for K–12 education, the California Community Colleges (CCC), and state–subsidized preschool.
Below, we walk through changes in the 2012–13 and 2013–14 Proposition 98 minimum guarantees and describe major changes in Proposition 98 spending. In the next two main sections of this chapter, we discuss the child care and higher education budgets in more detail. (In addition, the online version of this report contains a link to a packet of detailed tables relating to various aspects of the education budget.)
2012–13 Minimum Guarantee Up $2.9 Billion Due to Increases in Revenues. As Figure 1 shows, the revised 2012–13 minimum guarantee is $56.5 billion—$2.9 billion higher than the amount estimated in the 2012–13 Budget Act. The bulk of this increase—$2.5 billion—is due to General Fund revenues that count toward the guarantee being $2.4 billion higher than estimated in the 2012–13 spending plan. The growth in General Fund revenues has such a large effect on the minimum guarantee (more than dollar for dollar) because of the manner in which the budget plan makes maintenance factor payments. (Test 1 is operative in 2012–13 and the maintenance factor is being paid on top of the Test 1 rather than Test 2 level.) The minimum guarantee also increases by $364 million as a result of higher baseline property tax revenues. Because 2012–13 is a Test 1 year—in which the state provides a fixed percentage of General Fund revenues regardless of property tax revenues—an increase in baseline property tax revenues results in an increase in the minimum guarantee. (The budget package adopts LAO local property tax estimates in some cases and Department of Finance [DOF] estimates in other cases, as described in the box below.)
Budget Package Relies on Combination of Two Offices’ Local Property Tax Estimates
The budget package relies on a combination of LAO and Department of Finance (DOF) local property tax estimates. (Both offices prepared revenue forecasts in May 2012.) Specifically, the budget package uses:
- LAO estimates for 2012–13 and 2013–14 baseline property tax revenues.
- DOF estimates of 2012–13 redevelopment agency (RDA) property tax revenues (both ongoing
tax–increment revenues and one–time liquid assets).
- LAO estimates of 2013–14 RDA tax–increment revenues.
- DOF estimates of 2013–14 RDA liquid assets.
Figure 1
Proposition 98 Funding
(In Millions)
|
|
2011–12
Final
|
|
2012–13
|
|
2013–14
|
|
Budget Act
|
Revised
|
Change
|
Enacted
|
Change From 2012–13
|
|
Preschool
|
$368
|
|
$481
|
$481
|
—
|
|
$507
|
$26
|
|
K–12 Education
|
|
General Fund
|
$29,317
|
|
$32,828
|
$36,195
|
$3,366
|
|
$34,693
|
–$1,502
|
|
Local property tax revenue
|
12,125
|
|
14,342
|
13,760
|
–582
|
|
13,936
|
175
|
|
Subtotals
|
($41,443)
|
($47,170)
|
($49,955)
|
($2,785)
|
|
($48,628)
|
(–$1,327)
|
|
California Community Colleges
|
|
General Fund
|
$3,279
|
|
$3,415
|
$3,701
|
$285
|
|
$3,742
|
$42
|
|
Local property tax revenue
|
1,977
|
|
2,403
|
2,251
|
–152
|
|
2,291
|
40
|
|
Subtotals
|
($5,256)
|
($5,818)
|
($5,951)
|
($133)
|
|
($6,033)
|
($82)
|
|
Other Agencies
|
$83
|
|
$79
|
$78
|
–$1
|
|
$78
|
—
|
|
Unallocateda
|
—
|
—
|
—
|
—
|
|
$35
|
$35
|
|
Totals
|
$47,149
|
$53,549
|
$56,465
|
$2,917
|
|
$55,281
|
–$1,184
|
|
General Fund
|
$33,047
|
|
$36,804
|
$40,454
|
$3,651
|
|
$39,055
|
–$1,399
|
|
Local property tax revenue
|
14,102
|
|
16,745
|
16,011
|
–734
|
|
16,226
|
215
|
Total 2012–13 Local Property Tax Revenues Down More Than $700 Million. Despite higher baseline property tax revenues, total 2012–13 local property tax revenues are $734 million lower than in the 2012–13 Budget Act. This difference is explained by changes in redevelopment agency (RDA) property tax revenues. Actual 2012–13 property tax revenues from RDAs are $1.1 billion lower than assumed in the 2012–13 budget plan. The state adjusts the Proposition 98 calculation such that changes to RDA property tax revenues have no effect on the minimum guarantee. These lower RDA property tax revenues, however, do result in higher General Fund costs. As a result of the year–over–year increase in the minimum guarantee coupled with the decrease in overall local property tax revenues, Proposition 98 General Fund costs increase $3.7 billion in 2012–13. (The budget package allows DOF to authorize up to an additional $100 million in Proposition 98 General Fund spending in 2012–13 if RDA revenues for community colleges come in lower than anticipated.)
$1.2 Billion Decrease in 2013–14 Guarantee Caused by “Spike Protection” Provision. Under the budget plan, General Fund revenues that count toward the guarantee increase slightly (less than 1 percent) from 2012–13 to 2013–14. This slight year–over–year growth increases the minimum guarantee by $300 million. This increase is more than offset by a reduction in the guarantee due to the spike protection provision of Proposition 98. (This provision will take effect for the first time in 2013–14.) In a year when the minimum guarantee increases at a much faster rate than per capita personal income, the spike protection provision excludes a portion of Proposition 98 funding from the calculation of the minimum guarantee the subsequent year. This essentially prevents a portion of the prior–year Proposition 98 appropriation from permanently increasing the minimum guarantee in future years. Because the minimum guarantee increases much faster than per–capita personal income in 2012–13, the spike protection provisions require that $1.5 billion in 2012–13 Proposition 98 funding be excluded from the 2013–14 Proposition 98 calculation, reducing the 2013–14 minimum guarantee by a like amount. Accounting for both changes, the minimum guarantee is a net $1.2 billion lower in 2013–14 ($55.3 billion) than 2012–13 ($56.5 billion).
2013–14 Local Property Tax Revenues Up More Than $200 Million. Under the budget plan, total property tax revenues increase by $215 million from 2012–13. The budget plan assumes baseline property tax revenues increase $776 million. This increase is offset by RDA property tax revenues being $561 million lower than in 2012–13. (Similar to 2012–13, the budget package authorizes a General Fund backfill for schools and community colleges if RDA property tax revenues come in lower than anticipated in 2013–14.) Because 2013–14 is a Test 3 year, the increase in property tax revenues results in reduced General Fund Proposition 98 costs.
Figure 2 shows all major Proposition 98 spending changes in 2012–13 and 2013–14. In this section, we highlight the major changes each year and describe how those changes affect per–student funding. In the next section, we discuss the major Proposition 98 augmentations in more detail.
Figure 2
Proposition 98 Spending Changes
(In Millions)
|
2012–13 Budget Act
|
$53,549
|
|
Pay down additional deferrals
|
$1,769
|
|
Fund Common Core implementation (one time)
|
1,000
|
|
Revenue limit adjustments
|
293
|
|
Other technical adjustments
|
–145
|
|
Total 2012–13 Changes
|
$2,917
|
|
Revised 2012–13 Spending
|
$56,465
|
|
Technical Adjustments
|
|
|
Fund growth and COLA for certain categorical programsa
|
$114
|
|
Revenue limit adjustments
|
43
|
|
Other technical adjustments
|
–26
|
|
Use prior–year unspent funds
|
–94
|
|
Adjust for one–time actions
|
–4,994
|
|
K–12 Education
|
|
|
Implement LCFF for districts and charter schools
|
2,052
|
|
Allocate funds for energy projectsb
|
406
|
|
Fund Common Core implementation (one time)
|
250
|
|
Fund Career Pathways program (one time)
|
250
|
|
Pay down deferrals
|
242
|
|
Augment mandate block grant
|
50
|
|
Implement LCFF for county offices of education
|
32
|
|
Increase preschool slots
|
26
|
|
Establish CCEE to provide academic advice and assistance
|
10
|
|
Other changesc
|
37
|
|
California Community Colleges
|
|
|
Fund enrollment growth
|
89
|
|
Provide COLA
|
88
|
|
Increase categorical funding
|
88
|
|
Allocate funds for energy projectsb
|
50
|
|
Pay down deferrals
|
30
|
|
Provide building maintenance funding (one time)
|
30
|
|
Fund adult education planning grants
|
25
|
|
Fund new technology initiative
|
17
|
|
Total 2013–14 Changes
|
–$1,184
|
|
2013–14 Proposition 98 Spending Level
|
$55,281
|
Changes in 2012–13 Spending. As shown in the top part of Figure 2, the $2.9 billion increase in 2012–13 Proposition 98 spending is primarily used to pay down deferrals and implement a new one–time initiative relating to the Common Core State Standards (CCSS).
Major Changes in 2013–14 Spending—K–12 Education. For K–12 education, the largest 2013–14 augmentation ($2.1 billion) is for implementing the Local Control Funding Formula (LCFF) for school districts. Other major 2013–14 K–12 augmentations include $406 million in grants and loans for energy projects, an additional $250 million on a one–time basis for the CCSS initiative, $250 million on a one–time basis for a new Career Pathways program, $50 million to augment the mandate block grant, $32 million to implement the LCFF for county offices of education (COEs), and $10 million to establish the California Collaborative for Educational Excellence (CCEE) to provide low–performing school districts with academic assistance.
Major Changes in 2013–14 Spending—Community Colleges. Major CCC augmentations in 2013–14 include $88 million for various categorical programs, $50 million in grants and loans for energy projects, $30 million on a one–time basis for building maintenance projects (including replacing instructional equipment and library materials), $25 million for adult education planning grants, and $17 million for a new CCC technology initiative.
Other Changes in 2013–14 Spending. The budget also further pays down both K–12 and CCC deferrals. Additionally, the budget includes a 1.57 percent cost–of–living adjustment (COLA) for certain K–12 categorical programs and CCC general–purpose apportionment funding. The budget includes a slight increase to reflect 0.2 percent growth in K–12 ADA and an $89 million increase to fund 1.63 percent enrollment growth at the community colleges. The budget also provides a $26 million (5 percent) increase to the part–day/part–year State Preschool program to support approximately 7,100 new preschool slots. (The Governor vetoed $5 million for preschool—bringing the augmentation down from $31 million.)
K–12 Per–Student Funding Up 5.5 Percent Year Over Year. Given the budget package devotes virtually all of the increase in 2012–13 funding for one–time purposes, ongoing funding per student in 2012–13 changes only negligibly from the 2012–13 Budget Act. In 2013–14, despite fewer overall resources compared to 2012–13, much less funding is designated for paying down deferrals. This frees up funds in 2013–14 that can be used for other purposes. In total, the budget includes a $2.6 billion increase in K–12 ongoing funding. Ongoing funding per student (as measured by ADA) increases from $7,590 in 2012–13 to $8,005 in 2013–14—an increase of $415 (5.5 percent).
CCC Per–Student Funding Up 5 Percent Year Over Year. Like K–12 education, increases in 2012–13 funding for CCC are primarily used for one–time purposes (paying down additional deferrals), with virtually no change in ongoing funding per student. In 2013–14, also similar to K–12 education, much less funding is designated for paying down CCC deferrals, thereby freeing up funds in 2013–14 for other purposes. In total, the budget includes a $350 million increase in CCC ongoing funding. Ongoing funding per full–time equivalent (FTE) CCC student increases from $5,524 in 2012–13 to $5,792 in 2013–14—an increase of $268 (5 percent).
LCFF for School Districts and Charter Schools
Budget Package Contains Major Restructuring of K–12 Funding System. The budget package includes a major restructuring of the state’s funding system for school districts and charter schools. The new LCFF system replaces existing funding formulas for revenue limits and most categorical programs with a weighted student funding formula. Over the course of implementation, districts will receive additional funding to reduce the same share of the gap between their existing per–pupil funding rates and their targets under the LCFF. Full implmentation of the LCFF is expected to take eight years (with full implementation in 2020–21) and cost $18 billion (not accounting for future COLA costs). The 2013–14 Budget Act provides first–year funding of $2.1 billion. This is expected to close 12 percent of each district’s gap.
New Funding Formula Has Grade–Span Base Rates. Figure 3 highlights the major components of the LCFF. As shown in the figure, the LCFF establishes base rates for four grade spans. The LCFF adjusts the base rates by providing additional funding intended to be used for class size reduction (CSR) in the K–3 grades and career technical education in high school. (Hereafter, the term “base rates” includes the additional funding for the K–3 and high school adjustments.) Different base rates are intended to reflect the differential costs of providing education across the grade spans.
Figure 3
Overview of Local Control Funding Formula for School Districtsa
|
Formula Component
|
|
|
Initial base rate(s) (per ADA)
|
K–3: $6,8454–6: $6,9477–8: $7,1549–12: $8,289
|
|
Additional funding for K–3 and high school students (per ADA)
|
K–3: 10.4 percent of base rate.9–12: 2.6 percent of base rate.
|
|
Supplemental funding for certain student subgroups (per EL/LI student and foster youth)
|
20 percent of base rates, as adjusted for K–3 and high school.
|
|
Concentration funding
|
Each EL/LI student above 55 percent of enrollment generates an additional 50 percent of base rates as adjusted for K–3 and high school.
|
|
Economic Recovery Target (ERT)
|
Establishes an ERT assuming revenue–limit and categorical funding is restored to 2007–08 levels and revenue limits receive COLA from 2008–09 through 2020–21. Provides districts with the greater of their LCFF target or ERT (capped at the 90th percentile of all districts’ ERTs). If a district’s 2020–21 ERT is greater than its LCFF target, one–eighth of the amount needed to reach the district’s ERT is provided each year for the next eight years.
|
|
Special rules for four existing programs
|
Targeted Instructional Improvement Block Grant, Home–to–School Transportation, Adult Education, and Regional Occupational Centers and Programs (see text for description of the special rules).
|
|
Programs Kept/Spending Requirements Retained
|
|
Special Education, After School Education and Safety, State Preschool, Quality Education Investment Act, Child Nutrition, Mandates Block Grant, Assessments, American Indian Education Centers and Early Childhood Education Program, Foster Youth Services, Adults in Correctional Facilities, Partnership Academies, Specialized Secondary Programs, and Agricultural Vocational Education.
|
|
Programs Eliminated/Spending Requirements Removed
|
|
Summer School Programs, Grade 7–12 Counseling, Gifted and Talented Education, Economic Impact Aid, Professional Development for Math and English, Principal Training, Educational Technology, Deferred Maintenance, Instructional Materials Block Grant, Community Day School (extra hours), Staff Development, National Board Certification Incentives, California School Age Families Education, California High School Exit Exam, Tutoring, Civic Education, Teacher Dismissal, Charter School Block Grant, Categorical Programs for New Schools, Community–Based English Tutoring, School Safety, High School Class Size Reduction, Advanced Placement Fee Waiver, International Baccalaureate Diploma Program, Student Councils, Teacher Credentialing Block Grant, Professional Development Block Grant, School and Library Improvement Block Grant, School Safety Competitive Grant, Physical Education Block Grant, Certificated Staff Mentoring, Oral Health Assessments, Alternative Credentialing.
|
Includes Supplemental Funding for English Learner and Low–Income (EL/LI) Students. Under the LCFF, districts and charter schools receive significantly more funding for EL/LI students and foster youth. For each of these students, districts receive an additional 20 percent of the base per–pupil amount. For example, an EL/LI student in grades K–3 would generate an additional $1,511 for the district (20 percent of $7,557, which reflects the K–3 base rate adjusted for CSR). In addition, districts whose EL/LI populations exceed 55 percent of their enrollment receive concentration funding. Specifically, these districts receive an additional 50 percent of the base per–pupil amount for each student above the 55 percent threshold. For the purposes of generating both supplemental and concentration funding, the formula counts each student only once (regardless of whether they are EL, LI, and/or a foster youth).
Guarantees Virtually All Districts Receive as Much as They Would Have Under Previous System. To ensure that the vast majority of districts receive at least as much as they would have under the previous system, the new system includes a component called the Economic Recovery Target (ERT). The ERT assumes the revenue limit deficit factor is retired, categorical programs are restored to 2007–08 levels, and revenue limits receive a 1.94 percent COLA every year moving forward. In most cases, if a district’s ERT is greater than its LCFF target, its funding level is to increase by one–eighth of the amount needed to reach its ERT each year for the next eight years. For the vast majority of districts, the LCFF target for 2020–21 will be higher than the ERT for 2020–21. For about 230 districts, the ERT, however, will be higher. Over the next eight years, roughly 130 of these districts will receive additional payments in excess of their LCFF payments to get them to their higher ERT. (Districts that have an ERT above the 90th ERT percentile will receive no additional funding in excess of the 90th percentile. Approximately 100 districts have rates that are this high.)
Special Rules for Four Categorical Programs. Specifically, the Targeted Instructional Improvement Grant (TIIG) does not apply toward a district’s LCFF allocation. Instead, the district’s TIIG allocation is locked in at the 2012–13 level and treated as an “add–on” to LCFF. No state spending requirements are associated with this add–on funding. Home–to–School (HTS) Transportation funding also does not apply toward a district’s LCFF allocation. The state, however, established an ongoing maintenance–of–effort (MOE) requirement that districts spend as much on HTS Transportation annually moving forward as in 2012–13. Under the new system, existing funding for adult education and Regional Occupational Centers and Programs (ROCP) do count toward a district’s LCFF allocation but districts have an MOE requirement that they spend as much on each of these two programs in 2013–14 and 2014–15 as in 2012–13.
Other Notable Changes in Spending Requirements. As shown in the bottom part of Figure 3, the LCFF removes the spending requirements associated with most existing categorical programs. In lieu of most existing categorical spending requirements, districts will have to complete Local Control and Accountability Plans (LCAPs). The LCAP is an annual plan in which districts will specify how they will spend LCFF funding to improve the education of their students and implement state priorities. Districts are required to make their LCAPs publicly available and submit them to their COE for review. Charter schools will annually submit comparable reports to their chartering authority.
Develops New Technical Assistance and Intervention System. In tandem with the new funding formula, the budget package establishes a new system of district support and intervention. Under the new system, districts that fail to improve student outcomes will receive support from their COE, an academic expert or team of experts assigned by their COE, or the newly established CCEE. (For a charter school that fails to improve student outcomes, the chartering authority would be responsible for providing or arranging technical assistance.) A district that displays persistently poor student performance also may be subject to more intensive interventions at the discretion of the State Board of Education (SBE) and State Superintendent of Public Instruction (SPI). These interventions could include the SPI changing the LCAP, revising a district’s budget, or exerting control over local school board actions (with the exception of board actions involving local bargaining agreements). With SBE approval, the SPI can assign an academic trustee to the district to implement these interventions. (For charter schools, persistently poor student outcomes can lead to the chartering authority or SBE revoking their charters.)
LCFF for COEs
Establishes New Two–Part Funding Formula for COEs. The budget package also replaces the existing COE revenue limit and categorical funding system with a new two–part funding formula (see Figure 4). The new formula has (1) one part relating to funding for operational services that COEs provide to local educational agencies (LEAs) within their respective counties and (2) a second part relating to the alternative education services COEs directly provide to students. Similar to the approach for school districts, the formula establishes a funding target for each COE, counts existing funds toward the target, and uses new funding to close the same proportional share of each COE’s gap between its existing funding level and target funding level. Full implementation of the new COE system is expected to take two years (with full implementation in 2014–15) and cost $50 million. The 2013–14 Budget Act provides first–year funding of $32 million—almost two–thirds of the funding needed to bring COEs up to their target levels.
Funds COE Operational Support. As shown in Figure 4, the new funding formula provides an operations grant for each COE based on the total number of school districts and students within the county. This grant is intended to support basic COE operations and services for LEAs in the county. Each COE has considerable discretion over the use of this funding, with most existing categorical spending requirements removed. The COEs, however, must perform certain activities for school districts within their counties, including providing fiscal oversight and verifying districts’ EL/LI student counts. As described above, the budget package also gives COEs a significant role in the new district academic support and intervention system, with COEs required to review the LCAPs submitted by school districts and provide technical assistance to districts whose plans are disapproved.
Figure 4
Overview of Local Control Funding Formula for COEs
|
Operations Grant
|
|
Funding target
|
Base funding of $655,920 per COE.Additional $109,320 per school district in the county.Additional $40 to $70 per ADA in the county (less populous counties receive higher per–ADA rates).
|
|
Alternative Education
|
|
Eligible student population
|
Students who are (1) under the authority of the juvenile justice system, (2) probation–referred, (3) on probation, or (4) mandatorily expelled.
|
|
Initial base rate
|
$11,045 per ADA.
|
|
Supplemental funding for EL, LI, and foster youth
|
Additional 35 percent of base rate.a
|
|
Concentration funding
|
Additional 35 percent of base rate for EL/LI students above 50 percent of enrollment.a
|
Funds COEs for Alternative Schools. The other part of the new funding formula is for COE–operated alternative schools, including court schools, county community schools, and community day schools. The budget package limits funding for COEs to those alternative–education students who are incarcerated, on probation, referred by a probation officer, or mandatorily expelled. (The COEs can serve other types of students through arrangements with a cooperating school district to pass through a portion of the district’s funding.) As shown in Figure 4, the structure of this part of the COE formula is similar to the formula for school districts, except that the base rate is significantly higher and different percentages are used for the supplemental and concentration grants. As with school districts, the funding generated by the supplemental and concentration grants must be used to increase or improve services for the students generating the funds.
Requires LCAPs for Alternative Education. Somewhat similar to the LCAPs that school districts must develop, the budget package requires each COE to adopt an LCAP describing its plan for serving alternative–education students and making progress towards state priorities. The COE LCAP also must describe how the COE will coordinate instruction for expelled pupils (as well as services for foster youth) within the county. If the SPI does not approve a COE’s plan, the SPI must provide technical assistance to that COE.
Includes Hold Harmless Provision. Under the new system, most of the funding COEs currently receive from revenue limits and categorical programs becomes unrestricted and is applied toward each COE’s funding target. The largest categorical program rolled into the formula is ROCP, for which COEs received about $180 million in 2012–13. (The associated MOE means COEs that ran ROCPs in 2012–13 must continue to support those activities for the next two years rather than expanding or enhancing operational services or alternative education.) In 32 of the state’s 58 counties, existing funding streams exceed the COEs’ funding target under the LCFF. The COEs are allowed to continue to receive funding in excess of their LCFF target, but the intent is that these COEs not receive funding increases until their LCFF target exceeds their 2012–13 funding level.
State–Level LCFF Implementation
Up to $4.7 Million Available for State–Level LCFF Implementation. In addition to the Proposition 98 funding provided for LCFF, the budget plan includes non–Proposition 98 General Fund augmentations for state operations relating to LCFF administration. The budget plan includes up to 22 positions and $2.7 million in ongoing non–Proposition 98 General Fund support for the California Department of Education (CDE) to implement the new LCFF fiscal provisions (11 positions, $1.4 million) as well as LCAP–related provisions (11 positions, $1.3 million). Of the combined amount included in the budget plan for CDE, 11 positions and $1.2 million are contingent on DOF approval of an expenditure plan to be submitted by CDE. The budget plan also provides $2 million in one–time non–Proposition 98 General Fund support to SBE for statutorily required activities related to LCFF. Specifically, SBE is required to (1) develop regulations regarding the use of supplemental and concentration funds by January 31, 2014 and (2) create templates by March 31, 2014 for school districts, COEs, and charter schools to use in adopting their LCAPs.
Deferral Paydowns
Total of $4.3 Billion in Deferrals Paid Down in 2012–13 and 2013–14. After four consecutive years of increasing the amount of deferrals for schools and community colleges—reaching a total of $10.4 billion in outstanding deferrals by the end of 2011–12—the 2012–13 budget plan provided $2.2 billion to reduce the amount of outstanding deferrals. As Figure 5 shows, the recently enacted budget plan makes an additional $1.8 billion in 2012–13 deferral paydowns as well as $272 million in paydowns in 2013–14. Under the budget package, $6.2 billion in outstanding deferrals remain as of the end of 2013–14.
Figure 5
State Paying Down More Than $4 Billion in Deferrals
(In Millions)
|
|
K–12
|
CCC
|
Totals
|
|
Outstanding Deferrals at End of 2011–12
|
$9,469
|
$961
|
$10,430
|
|
Deferral paydowns in 2012–13 budget package
|
2,065
|
160
|
2,225
|
|
Newly authorized 2012–13 deferral paydowns
|
1,590
|
179
|
1,769
|
|
Deferral paydowns for 2013–14
|
242
|
30
|
272
|
|
Total Paydowns
|
$3,898
|
$369
|
$4,266
|
|
Outstanding Deferrals at End of 2013–14
|
$5,571
|
$592
|
$6,164
|
CCSS Implementation
Provides $1.25 Billion for Implementing CCSS. The budget plan provides $1.25 billion in one–time funding to schools for implementing the CCSS. (Of this amount, the budget plan counts $1 billion towards meeting the 2012–13 minimum guarantee and $250 million towards meeting the 2013–14 guarantee.) The CCSS are nationally developed standards for math and English/Language Arts that the state adopted in 2010. Under current law, schools are required to align instruction to the CCSS beginning in 2014–15. The $1.25 billion in CCSS funding must be spent in 2013–14 or 2014–15 for professional development, instructional materials, and technology that assist schools in aligning instruction to the CCSS. Local governing boards are required in a series of public meetings to discuss and adopt a plan for spending the funds and must report how the funds were spent to the CDE by July 1, 2015.
State Suspends Most Existing Standardized Tests as Part of Transition to CCSS. To begin the transition to the CCSS, the Legislature adopted Chapter 489, Statutes of 2013 (AB 484, Bonilla), which suspends most of the California Standards Tests (CSTs) in 2013–14. Specifically, Chapter 489: (1) suspends all CST exams in mathematics and English–language arts; (2) requires CST science exams only in grades 5, 8, and 10; and permanently eliminates all CST history/social science exams. (Because student results on these exams are the core of the state’s Academic Performance Index, this index may not be calculated for all schools in 2013–14.) Chapter 489 makes similar changes to the California Modified Assessment (CMA), an exam taken by some students with disabilities, but makes no changes to the California Alternate Performance Assessment, an exam for students with the most significant cognitive disabilities. The savings generated by not administering CSTs and CMA is to be used to field test CCSS–aligned exams, also known as the Smarter Balanced Assessment Consortium (SBAC) tests. The field test is primarily designed to assess the accuracy and reliability of SBAC test items prior to full implementation in 2014–15. The results of the field test will not be used to assess the performance of schools or students for state or federal accountability purposes.
Proposition 39
Creates $467 Million Proposition 39 Spending Plan. Passed by the voters in November 2012, Proposition 39 increases state corporate tax revenues and requires for a five–year period, starting in 2013–14, that a portion of these revenues be used to improve energy efficiency and expand the use of alternative energy in public buildings. The budget package applies the entire increase in associated corporate tax revenues to the calculations of the Proposition 98 minimum guarantee. The budget plan appropriates a total of $467 million for Proposition 39–related programs and support. The funds support a new grant program, new revolving loan program, and energy–related workforce training.
Grant Program for Schools and Community Colleges ($428 Million). The budget provides $428 million (Proposition 98 General Fund) for a new grant program for schools ($381 million) and community colleges ($47 million) to undertake energy projects. (The school program allows school districts, COEs, and charter schools—referred to as LEAs throughout the rest of this section—to access funding.) For LEAs, the plan distributes 85 percent of funding on a per–student basis, with the remaining 15 percent based on student eligibility for free and reduced price meals. The LEAs with fewer than 2,000 students receive a minimum grant (ranging from $15,000 to $100,000, depending on size) in lieu of the per–student allocation if the minimum grant is higher. The LEAs must prioritize projects according to certain criteria (such as age of facilities) and must receive approval from the California Energy Commission (CEC) prior to spending funds. For community colleges, the Chancellor’s Office is to allocate funding at its discretion. The CEC, in consultation with other state education and energy agencies, is to develop guidelines for LEAs and community colleges to evaluate energy benefits.
Loan Program for Schools and Community Colleges ($28 Million). The budget also provides $28 million (Proposition 98 General Fund) to the CEC to provide low– and no–interest revolving loans to LEAs and community colleges for eligible energy projects and technical assistance. (Though CEC has discretion to allocate the $28 million among LEAs and community colleges, the budget plan assumes $25 million for LEAs and $3 million for CCC.) Program documentation and review processes are to be coordinated with the grant program discussed above.
Workforce Training Programs ($8 Million). The budget supports two energy–related workforce training programs using non–Proposition 98 General Fund monies. Specifically, it provides (1) $5 million to the California Conservation Corps to be used for workforce development, such as energy audit and weatherization training, and (2) $3 million to the California Workforce Investment Board for a competitive grant program for workforce training organizations to provide energy–related work experience and job training to disadvantaged youths and veterans.
Provides $3.1 Million for State Operations. The budget plan provides a total of $3.1 million for supporting implementation of the Proposition 39 spending plan. The CEC receives $3 million (Energy Resources Program Account) for various administrative and support activities, including establishing guidelines, reviewing project expenditure plans, maintaining a database of projects, and providing technical assistance, particularly to smaller LEAs that need help conducting energy audits. In addition, CDE receives one new position, at a General Fund cost of $109,000.
Adult Education
Provides Planning Grants for Adult Education Providers to Form Regional Consortia. In an effort to improve coordination among adult education providers, the budget provides $25 million (Proposition 98 General Fund) for a new Adult Education Consortium Program. School districts and community colleges that form a regional consortium are eligible to apply for these funds. While the monies are in CCC’s budget, the budget package charges both CDE and the CCC Chancellor’s Office with awarding grants to consortium applicants. The grants, which may be spent over two years, are to be used by consortium members to develop joint plans for serving adult learners in their area. The trailer legislation specifies the content that each consortium must include in these plans, including (1) a needs assessment of adult education services within the region, (2) plans for coordinating and integrating existing programs (such as English as a second language instruction and vocational training), and (3) strategies for improving student success. By March 1, 2014, CDE and the CCC Chancellor’s Office must submit a report to the Legislature and Governor on the status of (1) the formation of regional consortia across the state and (2) grant allocations to these regional consortia. By March 1, 2015, CDE and the CCC Chancellor’s Office must submit a second report detailing the plans that regional consortia have developed and providing recommendations for improving the state’s new regional delivery system. The budget package also includes intent language for the Legislature to (1) work toward establishing common policies affecting adult schools and community colleges (such as student fee levels) and (2) appropriate new funds to regional consortia in 2015–16 to “expand and improve” adult education in the state.
Eliminates School District Adult Education Categorical Program, but Includes MOE Requirement. In a related action, the budget package eliminates school districts’ adult education categorical program and consolidates all associated annual funding ($635 million Proposition 98 General Fund) into the school district LCFF. The budget package, however, contains a requirement for school districts (through their adult schools) to maintain at least their 2012–13 level of state spending on adult education in 2013–14 and 2014–15.
Shifts School Districts’ Apprenticeship Categorical Funds to CCC. The budget also shifts the school district–run apprenticeship program (a type of adult education instruction related to job training) to the community colleges, thereby creating two CCC apprenticeship categorical programs—CCC’s existing program ($7.2 million), which is reinstated as a restricted CCC program, and the shifted school district program ($15.7 million). Though the latter (renamed the “Apprenticeship Training and Instruction” program) is within CCC’s budget, trailer legislation permits school districts to continue administering their existing apprenticeship programs using funds from this categorical program. The trailer legislation, however, requires CCC and school district apprenticeship programs to adopt common administrative policies (such as regular visits to apprenticeship classes) by early 2014.
Retains School Districts’ Adults in Correctional Facilities Categorical Program. The budget takes a separate approach for the Adults in Correctional Facilities categorical program (an adult education program operated by school districts at various county jails). Rather than folding the program into LCFF or shifting funds to CCC, the budget maintains Adults in Correctional Facilities as a restricted categorical program within school districts’ budget and provides $15 million (Proposition 98 General Fund) to reimburse 2012–13 program costs.
New Career Pathways Program
The budget provides $250 million in one–time Proposition 98 funding to create a “California Career Pathways Trust.” The primary purpose of the new program is to improve linkages between career technical (vocational) programs at schools and community colleges as well as between K–14 education and local businesses. The program authorizes several types of activities, such as creating new technical programs and curriculum. The program is open to school districts, COEs, charter schools, and community colleges. Funds are allocated through a competitive grant process. The SPI, in consultation with the CCC Chancellor’s Office and interested business organizations, is charged with reviewing grant applications. Grant funds are available for expenditure from 2013–14 through 2015–16. As a condition of receiving pathway grants, recipients must identify other fund sources (such as commitments from businesses) that will support the ongoing costs of the program. By December 1, 2016, the SPI and grant recipients must report to the Legislature and Governor on program outcomes, such as the number of students making successful transitions to the workforce. Of the amount provided for this program, $250,000 is designated for an independent evaluation. The budget package also provides CDE with $459,000 (non–Proposition 98 General Fund) for development of a data repository to track program outcomes and three staff positions.
CCC Categorical Programs
Augments Funding for Several Categorical Programs. The budget contains both one–time and ongoing increases for CCC categorical programs. Specifically, the budget provides $30 million on a one–time basis for CCC’s Physical Plant and Instructional Support program to fund primarily facility maintenance projects and instructional equipment purchases. In addition, the budget includes a total of $88.2 million in base augmentations for five other categorical programs.
- $50 million for the Student Success and Support Program, which funds various support services such as academic counseling and orientation for incoming students. Provisional language permits the CCC Chancellor to use up to $14 million of this augmentation for three new technology projects—electronic transcripts, electronic planning tools, and a common assessment system. Provisional language also reinstates it as a restricted program.
- $15 million for Extended Opportunity Programs and Services, which provides additional academic and financial support to underprepared and financially needy students.
- $15 million for Disabled Students Programs and Services, which provides support services and educational accommodations to CCC students with disabilities.
- $8 million for various services (such as child care and career counseling) provided to CCC students in the California Work Opportunity and Responsibility to Kids (CalWORKs) program.
- $150,000 for the CCC Academic Senate to support the joint CCC–California State University (CSU) common course numbering initiative.
Funds New CCC Technology Program. The budget provides $16.9 million in 2013–14 for a new CCC technology initiative (with an intent to provide annual ongoing funding of $10 million beginning in 2014–15). The stated goal of the initiative is to increase student access to high–quality online courses and provide alternative ways for students to earn college credit. The funds support the development of a number of projects, with the majority of funding in 2013–14 supporting the acquisition of a common learning management system (LMS) for the CCC system. (An LMS allows faculty to post syllabi, assignments, course material, and instructional content such as video presentations. Students use the LMS to perform functions such as submitting their assignments, taking tests, and participating in online discussions with classmates.) Other projects include (1) creation of an inventory of online courses that would be offered by a consortium of community colleges and available to students throughout the CCC system, (2) a single online portal for students to find and access such courses, (3) centralized round–the–clock technical and tutorial support for these online students, (4) additional professional development for faculty teaching online courses, and (5) development of standardized “challenge tests” that allow students to obtain academic credit for learning outside the traditional classroom setting. The budget contains a March 1, 2014 requirement for the CCC Chancellor’s Office to submit a report to the Legislature and Governor on the status of these projects.
CCC Chancellor’s Office
Funds Five New Positions. The budget provides a total of $508,000 (non–Proposition 98 General Fund) to fund five new positions at the CCC Chancellor’s Office—three positions in adult education, one position in apprenticeship, and one position to support primarly the new CCC technology initiative.
Education Mandates
Adds $50 Million to Block Grant for Graduation Requirements Mandate. The budget plan increases funding for the K–12 mandates block grant from $167 million to $217 million to account for the inclusion of the Graduation Requirements mandate. Enacted in 1983, this mandate requires that schools award a high school diploma to students only if they have met all state graduation requirements, including passing a second science course. Since the mandate pertains only to high schools, the block grant allocates the $50 million augmentation on a per–student basis for high school students only. All other block grant funding continues to be distributed across all students, without regard to grade level. As a result, the 2013–14 rates for school districts are $56 per student in grades 9 through 12 and $28 per student in all other grades. For charter schools, the rate is $42 per high school student and $14 per student in all other grades. (Charter schools receive lower rates because fewer mandates apply to them.)
Limits Behavioral Intervention Plans (BIP) Mandated Activities. The budget plan modifies several state requirements collectively known as the BIP mandate that specify how schools must respond when a student with a disability exhibits behavioral problems. In general, these modifications conform state BIP requirements more closely with federal BIP requirements, thereby eliminating most associated state reimbursable mandate costs. For example, schools no longer will be required to use specific types of assessments and specific types of behavioral interventions. A few state BIP requirements that exceed federal requirements are retained, however, such as procedures relating to emergency interventions. The budget provides $230,000 in one–time federal special education funds for CDE to provide technical assistance to schools regarding the BIP changes. (The budget package makes no change to existing state law provisions requiring schools to use their state special education funds to pay for any BIP mandated activities.)
Conforms With Other Local Governments on Mandate Suspensions. The budget package suspends four education mandates that have been suspended for other local governments in recent years: Absentee Ballots, Brendon Maguire Act, Mandate Reimbursement Process, and Sex Offenders: Disclosures by Law Enforcement. The Sex Offenders disclosure mandate applied only to community colleges, with the other three mandates applying to both schools and community colleges. Though the four mandates are removed from the block grants, the budget does not decrease block grant funding. (The budget plan also adds one small mandate relating to pupil expulsions to the schools block grant without adjusting block grant funding.)
Removes One Additional Mandate From Block Grant. The budget removes the Open Meetings/Brown Act mandate from the schools and community college block grants since Proposition 30 eliminated the state’s obligation to pay local governments for performing the associated activities.
Special Education
Revises Allocation Formulas. The budget package makes three notable changes to special education funding. First, the package simplifies the state’s approach to distributing funding to special education local plan areas (SELPAs) by delinking state and federal special education allocation formulas. A conforming change revises the “statewide target rate” used to fund new students to the updated statewide average per–pupil funding rate. Second, the budget provides $2.6 million in Proposition 98 funds to fully offset federal sequestration funding cuts for preschoolers and infants/toddlers with disabilities and provides $2.1 million in federal carryover funds to partially mitigate federal sequestration funding cuts for K–12 students with disabilities. Third, the package consolidates several special education grants, as described below. (As passed by the Legislature, the budget package also included $30 million to begin equalizing special education funding rates across SELPAs, but the Governor vetoed these funds.)
Consolidates Several Special Education Grants. The budget package consolidates 11 special education categorical grants into 5 larger grants. The consolidations include the following:
- Merges funding for SELPA administrative support and regional services ($90 million) and staff development ($2.5 million) into base SELPA funding. Funds will be available for any special education purpose. (The budget continues to provide $3 million in supplemental funds for small, geographically isolated SELPAs.)
- Combines two “WorkAbility” grants into one grant while maintaining the same programmatic requirements ($40 million) to provide vocational education, training, and job placements to students with disabilities.
- Combines three grants for students with low–incidence disabilities—materials ($13.4 million), services ($1.7 million), and ROCP ($2.1 million)—into one grant with fewer spending requirements reserved for serving the same group of students.
- Combines two extraordinary cost pools ($3 million each) for subsidizing high–cost student placements into one pool with a uniform set of eligibility criteria.
- Folds funds ($200,000) formerly dedicated for assessment research into an existing larger grant ($1.1 million) used to provide technical assistance to SELPAs.
As shown in Figure 6, the 2013–14 Budget Act authorizes a total of $1.7 billion in federal funds and state non–Proposition 98 funds for subsidized child care programs. (As shown earlier in Figure 1, the budget also includes $507 million in Proposition 98 funds for the State Preschool program.) Changes in funding by child care program vary, but total funding in 2013–14 is virtually unchanged from 2012–13. As shown in the bottom part of the figure, state non–Proposition 98 General Fund support for child care programs decreases slightly ($3 million) compared to 2012–13. Additionally, the figure shows that funding from the federal Child Care and Development Fund (CCDF) is anticipated to drop by $9 million. (This includes a $16 million reduction associated with federal sequestration, offset by a base increase of $7 million.) The amount of federal Temporary Assistance for Needy Families (TANF) funding dedicated for child care increases by $10 million. The budget package for child care contains several changes, as discussed below.
Makes Caseload and Statutory Growth Adjustments. As shown in the top part of Figure 6, the budget adjusts funding for CalWORKs child care based on anticipated changes in eligible caseload, including year–to–year increases for Stage 1 ($15 million) and Stage 3 ($21 million), and a decrease for Stage 2 ($61 million). (The Stage 3 funding level adopted in the budget was $15 million too high due to a technical error, which was corrected in Chapter 354, Statutes of 2013 [AB 101, Committee on Budget].) The net change in CalWORKs child care slots due to these caseload adjustments is a decrease of 2,200 slots. Embedded in the non–CalWORKs numbers shown in Figure 6 is a $1.3 million increase to fund a statutory 0.2 percent growth adjustment for the General Child Care, Alternative Payment, and migrant child care programs. This adjustment, based on projected annual changes in the state’s population of children under age five, will fund approximately 150 new slots in these programs. (As discussed next, a separate decision was made to increase slots in these programs beyond the statutorily required growth adjustment.)
Figure 6
Child Care and Preschool Budget Summary
(Dollars in Millions)
|
|
2011–12a
|
2012–13
|
2013–14
|
Change From 2012–13
|
|
Amount
|
Percent
|
|
Child Care Expenditures
|
|
|
|
|
|
|
CalWORKs Child Care
|
|
|
|
|
|
|
Stage 1
|
$309
|
$390
|
$406
|
$15
|
4%
|
|
Stage 2
|
442
|
419
|
358
|
–61
|
–15
|
|
Stage 3
|
152
|
162b
|
183c
|
21
|
13
|
|
Subtotals
|
($903)
|
($972)
|
($961)
|
(–$11)
|
(–1%)
|
|
Non–CalWORKs Child Care
|
|
|
|
|
|
|
General Child Cared
|
$675
|
$465
|
$473e
|
$8
|
2%
|
|
Alternative Payment
|
213
|
174
|
177e
|
3
|
2
|
|
Other child care
|
30
|
28
|
28e
|
—
|
2
|
|
Subtotals
|
($918)
|
($666)
|
($678)
|
($11)
|
(2%)
|
|
Support programs
|
$76
|
$76
|
$74
|
–$1
|
–2%
|
|
Totals
|
$1,897
|
$1,714
|
$1,699
|
–$15
|
–1%
|
|
Child Care Funding
|
|
|
|
|
|
|
State Non–Proposition 98 General Fund
|
$1,059
|
$779
|
$776
|
–$3
|
—
|
|
Other state funds
|
8
|
14
|
—
|
–14
|
—
|
|
Federal CCDF
|
533
|
549
|
541e
|
–9
|
–2
|
|
Federal TANF
|
297
|
372
|
383
|
10
|
3
|
|
State Preschoold (Proposition 98)
|
$368
|
$481
|
$507
|
$26
|
5%
|
Increases Slots. The budget reappropriates $10 million in unspent 2012–13 child care funds to provide a total of about 1,100 new slots in the General Child Care, Alternative Payment, and migrant child care programs.
Backfills for Federal Sequestration Cuts. The budget assumes the federal sequester will decrease California’s share of the CCDF grant by $16 million (equivalent to about 1,700 child care slots), but it provides a like amount of additional state General Fund to avoid the reduction. (The 2013–14 Budget Act authorizes DOF to make the associated reductions once the federal government provides final data on the amount of sequestration reductions.)
Large General Fund Increase but Smaller Overall Increase. The budget provides a total of $18.2 billion in support for higher education in 2013–14—a 4 percent increase from 2012–13. Of this amount, $10.9 billion is state General Fund, $3.6 billion is tuition and fee revenue, $2.3 billion is local property tax revenue, and $1.3 billion is from other sources. As Figure 7 shows, General Fund support increases $1 billion from 2012–13. Of this amount, $249 million is associated with fund swaps whereas $765 million reflects an augmentation. Regarding tuition and fees, the amount paid by students is projected to decline slightly in 2013–14 as the amount covered by existing financial aid programs grows. Revenue from local property taxes is expected to increase modestly at the community colleges whereas funding from other sources is expected to decline notably, primarily due to a $262 million reduction in federal TANF funding for Cal Grants.
Figure 7
Higher Education Core Funding
(Dollars in Millions)
|
|
2011–12
|
2012–13
|
2013–14
|
Change From 2012–13
|
|
Amount
|
Percent
|
|
University of California
|
|
General Fund
|
$2,272
|
$2,377
|
$2,844a
|
$467
|
20%
|
|
Net tuitionb
|
2,506
|
2,428
|
2,471
|
43
|
2
|
|
Other UC core funds
|
388
|
441
|
385
|
–55
|
–13
|
|
Lottery
|
30
|
37
|
37
|
—
|
—
|
|
Subtotals
|
($5,196)
|
($5,283)
|
($5,738)
|
($455)
|
(9%)
|
|
California State University
|
|
|
|
|
|
|
General Fundc
|
$2,000
|
$2,304
|
$2,607
|
$304
|
13%
|
|
Net tuitionb
|
1,948
|
1,885
|
1,909
|
24
|
1
|
|
Lottery
|
42
|
56
|
56
|
—
|
—
|
|
Subtotals
|
($3,990)
|
($4,245)
|
($4,572)
|
($327)
|
(8%)
|
|
California Community Colleges
|
|
|
|
|
|
|
General Fund
|
$3,512
|
$3,817
|
$3,861
|
$44
|
1%
|
|
Local property tax
|
1,977
|
2,251
|
2,291
|
40
|
2
|
|
Fees
|
361
|
419
|
426
|
7
|
2
|
|
Lottery
|
197
|
186
|
186
|
—
|
—
|
|
Subtotals
|
($6,047)
|
($6,672)
|
($6,763)
|
($91)
|
(1%)
|
|
Hastings College of the Law
|
|
|
|
|
|
|
Net tuitionb
|
$34
|
$35
|
$34
|
–$1
|
–3%
|
|
General Fund
|
7
|
8
|
8
|
1
|
7
|
|
Subtotalsd
|
($41)
|
($43)
|
($42)
|
(–$1)
|
(–2%)
|
|
California Student Aid Commission
|
|
|
|
|
|
General Fund
|
$1,471
|
$708
|
$1,039
|
$331
|
47%
|
|
Student Loan Operating Fund
|
62
|
85
|
98
|
13
|
16%
|
|
TANF funds
|
—
|
804
|
542
|
–262
|
–33%
|
|
Subtotals
|
($1,533)
|
($1,596)
|
($1,679)
|
($82)
|
(5%)
|
|
General Obligation Bond Debt Service
|
$666
|
$696
|
$564
|
–$132
|
–19%
|
|
Totalse
|
$16,490
|
$17,460
|
$18,164
|
$705
|
4%
|
|
General Fund
|
$9,928
|
$9,910
|
$10,924
|
$1,014
|
10%
|
|
Net tuition/feese
|
3,866
|
3,691
|
3,646
|
–45
|
–1
|
|
Local property tax
|
1,977
|
2,251
|
2,291
|
40
|
2
|
|
Other
|
450
|
1,329
|
1,025
|
–304
|
–23
|
|
Lottery
|
269
|
279
|
279
|
—
|
—
|
New Goals Delineated for Higher Education. Chapter 367, Statutes of 2013 (SB 195, Liu) establishes three goals for the state to adhere to when making budget (and policy) decisions for postsecondary education. First, state budget decisions are supposed to improve student access and success, such as by increasing college participation and graduation rates. Second, the state budget is supposed to better align degrees and credentials with the state’s economic, workforce, and civic needs. Lastly, the state budget is supposed to ensure the effective and efficient use of resources to improve outcomes and maintain affordability. The law also states the Legislature’s intent for metrics to be created to monitor progress toward these goals. (These metrics are to take into account the new performance measures for the University of California (UC) and CSU described later in this chapter.)
UC, CSU, and Hastings
Provides $2.8 Billion in General Fund Support for UC. The budget provides UC with $2.8 billion in General Fund support—an increase of $467 million from 2012–13. Of this increase, $200 million reflects a shift of funds used for paying general obligation bond debt service from a separate budget item to UC’s support item (with no corresponding increase in state costs or total UC support and capital funding). The remainder consists of various augmentations, including a $125 million increase linked with a prior–year budget agreement that the university hold tuition levels flat in 2012–13, a $125 million (5 percent) base augmentation for 2013–14, a $9 million increase for lease–revenue debt service, and a $6 million increase for retiree health benefits. In addition to state support, UC expects to receive roughly $2.5 billion in student tuition payments. (The Cal Grant Program will pay about $760 million of this amount on behalf of students.)
Provides $2.6 Billion in General Fund Support for CSU. For CSU, the budget provides $2.6 billion in General Fund support—an increase of $304 million from 2012–13. This increase consists of various augmentations, including $125 million for holding tuition flat in 2012–13, a $125 million (6 percent) base augmentation for 2013–14, an $18 million increase for lease–revenue debt service, and a $34 million increase in health care costs for retired annuitants. In addition to its General Fund support, CSU expects to receive about $1.9 billion in student tuition payments. (The Cal Grant Program will pay about $430 million of this amount on behalf of students.)
Provides $8.4 Million in General Fund Support for Hastings College of the Law. The budget provides Hastings with $8.4 million in General Fund support—an increase of $511,000 (6.5 percent) from 2012–13. Of this amount, $56,000 is intended to cover increased retiree health care costs. Hastings has discretion in deciding how to use the remaining funding. In addition to state support, Hastings expects to receive $34 million in 2013–14 from student tuition payments.
Provides Base Augmentations. As discussed above, the budget provides base increases of $125 million each for UC and CSU. (The administration derived the dollar increase based on UC’s budget, with the amount representing a 5 percent increase for UC and a 6 percent increase for CSU.) Though the increases are largely unallocated, $15 million of UC’s augmentation is for the new UC Riverside School of Medicine, which will begin serving students in 2013–14. (The Governor proposed to set aside $10 million of each university’s base increase for improving the availability of courses through technology. Though the Governor ultimately vetoed this provision, the universities indicate they will honor the administration’s intent for these funds, as detailed in the box below.)
UC and CSU Technology Initiatives
Both the University of California (UC) and California State University (CSU) will use a portion of their base funding increase to improve course availability through technology, as described below.
UC to Develop New Innovative Learning Technology Initiative. The goal of the initiative is to help undergraduates enroll in the courses they need to satisfy degree requirements and graduate in a timely manner. The UC plans to spread $10 million across the following components.
- Course Development ($4.6 Million to $5.6 Million). The UC plans to develop 150 online and hybrid courses over the next three years. These courses will be credit–bearing and meet general education or major requirements. The university will select the courses using a competitive process run through the Academic Senate.
- Technological and Instructional Support ($1 Million to $2 Million). The UC plans to make technological support available to faculty developing the hybrid and online courses. The UC also plans to fund teaching assistants to help students taking courses remotely.
- Cross–Campus Registration and Course Catalog Database ($3 Million). The UC plans to develop a new data “hub” to support cross–campus registration. The UC also plans to develop a searchable database of the new courses.
- Evaluation ($0.4 Million). The UC plans to collect data from students and faculty to determine the effectiveness of the new courses.
CSU to Focus on Reducing Bottlenecks and Improving Student Success. The CSU Chancellor’s Office plans to distribute $17.2 million among its campuses to promote five objectives. (In addition to $10 million for technology–specific activities, CSU plans to spend $7.2 million specifically for the student success programs described below.) The amount allocated to each objective will depend on the proposals the Chancellor’s Office receives from campuses. The five objectives are:
- Increasing Enrollment in Successful Online Courses. Beginning fall 2013, CSU will expand enrollment in about two dozen existing, fully online courses. The courses, nominated by campuses and selected by the Chancellor’s Office, are in high–demand subjects and have shown better completion rates and student learning outcomes. Students throughout the system will be able to enroll in these courses and receive credit at their home campuses. The Chancellor’s Office will support the development of processes that streamline registration and transfer of course credits for students.
- Replicating Successful Courses and Teaching Methods. Through a review process, the Chancellor’s Office selected several courses that showed improved student outcomes following changes in teaching methods and technology. The university plans to hold six associated summer institutes that will bring faculty who have successfully redesigned courses together with faculty from other campuses who are interested in adopting new approaches. Participating faculty (and their campus departments) must indicate that they intend to transform an existing course from face–to–face to online, hybrid, or technology–enhanced and offer the revised course in 2013–14.
- Advancing Course Redesign. Campuses will compete for funds to redesign 22 existing courses that are high–demand and have high failure rates systemwide. Redesigned courses will be piloted beginning in spring 2014. Successful approaches will be expanded and disseminated in future faculty institutes.
- Implementing Student Success Programs. The goal of this component is to improve overall student success and graduation rates and reduce disparities in these rates between underrepresented students and other students. Campuses will compete for grants to implement various student success strategies such as developing or expanding summer bridge programs, freshman seminars and learning communities, writing–intensive courses, and undergraduate research opportunities.
- Using Technology to Improve Student Advising. Campuses will compete for funds to implement automated degree audits, e–advising, and other planning tools for students.
Requires Annual Report on Specified Performance Measures. The budget package establishes a new requirement for UC and CSU to report annually, beginning on March 1, 2014, on a number of performance outcomes. Among other metrics, the universities are required to report on graduation rates, spending per degree, and the number of transfer and low–income students enrolled. See Figure 8 for a full list of specified performance measures.
Figure 8
Performance Metrics for UC and CSU
|
Metric
|
Definition
|
|
CCC transfers
|
(1) Number of CCC transfers enrolled.(2) CCC transfers as a percent of undergraduate population.
|
|
Low–income students
|
(1) Number of Pell Grant recipients enrolled.(2) Pell Grant recipients as a percent of total student population.
|
|
Graduation ratesa
|
(1) Four– and six–year graduation rates for freshmen entrants.(2) Two– and three–year graduation rates for CCC transfers. Both of these measures also calculated separately for low–income students.
|
|
Degree completions
|
Number of degrees awarded annually in total and for: (1) Freshman entrants. (2) Transfers. (3) Graduate students. (4) Low–income students.
|
|
First–year students on track to degree
|
Percentage of first–year undergraduates earning enough credits to graduate within four years.
|
|
Spending per degree
|
(1) Total core funding divided by total degrees.(2) Core funding for undergraduate education divided by total undergraduate degrees.
|
|
Units per degree
|
Average course units earned at graduation for: (1) Freshman entrants.(2) Transfers.
|
|
Degree completions in STEM fields
|
Number of STEM degrees awarded annually to:(1) Undergraduate students.(2) Graduate students.(3) Low–income students.
|
Requires Biennial Reports on Cost of Education. In addition to annual performance reports, the budget requires biennial reports from UC and CSU, beginning in 2014, on the costs of education. The reports are to identify the costs of undergraduate education, graduate academic education, professional education, and research. For all four areas, costs are to be disaggregated by (1) Science, Technology, Engineering, and Mathematics (STEM) disciplines; (2) health sciences; and (3) all other disciplines. The first two reports, in 2014 and 2016, may reflect systemwide costs. Two subsequent reports must include campus–by–campus costs. The reporting requirement sunsets on January 1, 2021, following the fourth report.
Sets No Enrollment Expectations. The budget act typically specifies the number of FTE students the state expects the universities to enroll. For 2013–14, the Legislature adopted budget language stating its intent that the universities serve no fewer students in 2013–14 than in 2012–13. Accordingly, the language included enrollment targets of 211,499 FTE students for UC and 342,000 FTE students for CSU. The Governor, however, vetoed these provisions. In his veto message, the Governor stated that institutional performance, rather than enrollment, should drive university funding.
Expects No Tuition Increases. The administration expressed its intent that the universities not raise student tuition levels in 2013–14 and both UC and CSU have indicated they do not plan to increase tuition for resident students. Tuition rates for California resident undergraduates attending UC and CSU in 2013–14 are expected to remain at $12,192 and $5,476, respectively, for the third consecutive year. (The community colleges also plan to hold student fees flat in 2013–14—at $46 per unit.)
Again Eliminates Earmarks. The Governor vetoed virtually all provisions in the 2012–13 Budget Act that designated funding for specific purposes and did not include these spending requirements in his 2013–14 budget proposal. The Legislature restored a number of these provisions—most notably a $25 million earmark for student outreach programs—and stated its expectation that the universities continue supporting other programs—such as UC’s Subject Matter Projects for K–12 teachers—that previously were specified in budget act provisions. The Governor again vetoed the earmarking, citing a desire to give the universities greater flexibility (with the exception of funding for the Riverside Medical School) to manage their resources.
Changes CSU Retirement Funding Model. Traditionally, the state has adjusted CSU’s budget to account for changes in its contributions to the California Public Employees’ Retirement System (CalPERS). Under the traditional model, CSU’s CalPERS contributions have been determined by multiplying its current payroll costs by its employer contribution rate. Starting in 2013–14, adjustments to CSU’s budget are to be based permanently on the university’s 2013–14 payroll costs. Because 2013–14 payroll costs are permanently locked in as a base moving forward, CSU will have to fund retirement costs on any payroll above that level from its base budget appropriation. As a result, CSU will have a greater incentive to take into account retirement costs when it makes its initial hiring decisions.
Contains Intent Language Regarding UC Retirement Costs. The budget plan does not designate any funding for UC employer retirement costs, though the university expects these costs to increase by $67 million in 2013–14. Budget trailer bill language states, however, that the absence of such an earmark does not imply legislative support for UC employees paying more toward retirement. In addition, trailer legislation requires UC to apply any reductions in annual debt–service costs achieved as part of a debt restructuring (as discussed further below) towards its pension costs, including its unfunded pension liabilities.
Authorizes New Capital Outlay Process for UC. As noted earlier, the budget plan shifts funds for existing debt service on UC capital outlay projects from a separate budget item to the university’s main support appropriation. It does this as part of a new capital outlay process. Under the new process, UC may pledge its General Fund support appropriation (excluding the amounts necessary to repay existing debt service) to issue its own debt for capital projects involving academic facilities. In addition, the new process allows UC to restructure some of the state’s outstanding debt on UC projects. The new process limits the university to spending at most 15 percent of its pledgeable General Fund on (1) debt service on new bonds for academic facilities, (2) pay–as–you–go academic–facility projects, and (3) existing state lease–revenue debt. In order to use the new authority, the university is required to submit certain information about its capital plans to the Legislature and DOF for review and approval.
Funds a Few Capital Outlay Projects. The budget plan authorizes UC to construct a $45.1 million classroom and academic office building at the Merced campus using the new capital outlay authority discussed above. In addition, the budget provides UC with (1) $5 million from resources bond funds to replace a pier and wharf located at the Scripps Institution of Oceanography at the San Diego campus and (2) $4.2 million in general obligation bond funding for the equipment phase of a science and engineering building located at the Merced campus. For CSU, the budget authorizes (1) $76.5 million in lease–revenue bond funding to replace academic and classroom space found to be seismically unsafe at the Pomona campus, (2) $5.9 million from general obligation bond funds for the equipment phases of five previously approved capital outlay projects, and (3) $1.8 million from general obligation bond funds to upgrade the structural systems of the Dore Theatre at CSU Bakersfield to correct seismic deficiencies. (The budget also appropriates $1.3 million in general obligation bond funding for the planning phases of a building renovation project at Solano Community College.)
Financial Aid
Provides $1 Billion in General Fund Support for Cal Grants. The spending plan provides a total of $1.7 billion for Cal Grants, including $1 billion in General Fund support, $542 million in federal TANF funds, and $98 million from the Student Loan Operating Fund. This is an $82 million (5 percent) overall spending increase for Cal Grants from 2012–13. Though General Fund spending increases by $331 million from 2012–13 to 2013–14, a large part of this increase offsets a reduction in federal funding. Though virtually all state support for financial aid currently is for the Cal Grant program, the budget package creates a new state–supported financial aid program to be implemented beginning in 2014–15. In addition, the budget makes two changes to California Student Aid Commission (CSAC) operations. The components of the budget package are discussed below.
Creates New Financial Aid Program. The budget package creates the Middle Class Scholarship Program, a new financial aid program for certain UC and CSU students. The program is designed for undergraduate students who do not have at least 40 percent of their tuition covered by Cal Grants and other public financial aid programs. Specifically, students with family incomes up to $100,000 qualify to have 40 percent of their tuition covered (when combined with all other public financial aid). The percent of tuition covered declines for students with family income between $100,000 and $150,000, such that a student with a family income of $150,000 qualifies to have 10 percent of tuition covered. The program is to be phased in over four years, beginning in 2014–15, with awards in 2014–15 set at 35 percent of full award levels, then 50 percent, 75 percent, and 100 percent of full award levels the following three years, respectively. Budget legislation provides $107 million for the program in 2014–15, $152 million in 2015–16, and $228 million in 2016–17, with funding for the program capped at $305 million beginning in 2017–18. If the appropriation is insufficient to provide full awards to all eligible applicants, CSAC is to reduce award amounts proportionately. In addition, the budget package authorizes the Director of Finance to reduce the appropriation by about one–third if the May Revision projects a budget deficit for the next fiscal year. (The budget also provides CSAC with $250,000 for two permanent positions, one limited–term position, and associated implementation costs, as well as $500,000 in ongoing funding for the California Student Opportunity and Access Program to conduct outreach.)
Transfers Support Services to CSAC. For about 15 years, several of CSAC’s administrative support services have been provided by the agency administering the federal guaranteed student loan program in California—initially EdFund, and more recently ECMC (previously the Education Credit Management Corporation). These services include printing, warehouse, mailroom, courier, and information technology (IT) services. The agreement with ECMC is to terminate June 30. The budget provides $610,000 and seven positions to transfer these services back to CSAC, effective July 1.
Creates Reimbursement Mechanism for CSAC to Provide Technical Assistance to Other States. Since enactment of the California Dream Act—Chapter 604, Statutes of 2011 (AB 131, Cedillo)—CSAC has developed an online application that mirrors the Free Application for Federal Student Aid (FAFSA) for students who are unable to use the FAFSA due to their immigration status. Several other states have enacted legislation similar to the California Dream Act and are working to implement expanded aid eligibility. At least one state (Minnesota) has requested technical assistance from CSAC for its initial Dream Act implementation. The budget package creates a mechanism for CSAC to provide assistance to other states and recover the costs of doing so by charging fees for services.
The spending plan provides $20.7 billion from the General Fund for health programs. This is an increase of $1.2 billion, or about 6 percent, compared to the revised 2012–13 spending level, as shown in Figure 9. The net increase reflects both increases in caseload and utilization of services, implementation of the Patient Protection and Affordable Care Act (ACA), also known as federal health care reform, and other health care initiatives. The major program–specific changes are summarized in Figure 10 and discussed in more detail below.
Figure 9
Major Health Programs and Departments—Spending Trends
General Fund (Dollars in Millions)
|
|
2011–12
|
2012–13
|
2013–14
|
Change From
2012–13 to 2013–14
|
|
Amount
|
Percent
|
|
Medi–Cal—local assistance
|
$15,156
|
$14,928
|
$16,094
|
$1,166
|
7.8%
|
|
Department of Developmental Services
|
2,563
|
2,677
|
2,802
|
125
|
4.7
|
|
Department of State Hospitals
|
—
|
1,351
|
1,453
|
102
|
7.5
|
|
Department of Mental Health
|
1,329a
|
—
|
—
|
—
|
—
|
|
Healthy Families Program—local assistance
|
271
|
163
|
20
|
–143
|
–87.7
|
|
Department of Public Health
|
125
|
131
|
114
|
–17
|
–13.0
|
|
Department of Alcohol and Drug Programs
|
37
|
34
|
—
|
–34
|
—
|
|
Other Department of Health Care Services programs
|
59
|
96
|
93
|
–3
|
–3.1
|
|
Emergency Medical Services Authority
|
7
|
7
|
7
|
—
|
—
|
|
All other health programs (including state support)
|
76
|
161
|
165
|
4
|
2.5
|
|
Totals
|
$19,623
|
$19,548
|
$20,748
|
$1,200
|
6.1%
|
Figure 10
Major Changes—State Health Programs
2013–14 General Fund Effect (In Millions)
|
Program
|
Amount
|
|
Medi–Cal—Department of Health Care Services (DHCS)
|
|
|
Implements Coordinated Care Initiative
|
$21
|
|
Restores some, but not all, adult dental services
|
17
|
|
Lifts restriction on enteral nutrition benefit
|
2
|
|
Assumes savings from hospital fee extension
|
–310
|
|
Imposes a tax on Medi–Cal managed care organizationsa
|
–340
|
|
Medi–Cal—DHCS Patient Protection and Affordable Care Act Implementation
|
|
|
Expands Medi–Cal eligibility to include adults up to 133 percent of federal poverty levelb
|
—
|
|
Assumes costs from increased enrollment from currently eligible populations
|
$104
|
|
Provides funding for county administration costs
|
87
|
|
Enhances mental health and substance use disorder services
|
67
|
|
Receives additional federal funding for preventative services
|
–8
|
|
Shifts certain Medi–Cal enrollees to Covered California
|
–29
|
|
Changes to 1991 Health Realignment
|
|
Redirects 1991 Health Realignment Funds to offset state General Fund costs
|
–$300
|
|
Department of Developmental Services
|
|
Sunsets regional center and provider payment reduction
|
$32
|
|
Addresses decertification of residential units at Sonoma Developmental Center
|
19
|
|
Regional centers will cover managed care copayments and coinsurance
|
10
|
|
Eliminates sunset for annual family program fee
|
–4
|
|
Department of State Hospitals
|
|
Funds California Health Care Facility Stockton startup costs
|
$101
|
|
Continues to install personal duress alarm system
|
17
|
|
Activates new state hospital units
|
16
|
|
Investment in Mental Health Wellness
|
|
Improves the state’s mental health infrastructurec
|
$143
|
Affordable Care Act
The spending plan includes several significant changes associated with implementation of the ACA—also known as federal health care reform. Below, we describe some of the major ACA–related changes with significant effects on the state’s spending plan.
Expands Medi–Cal Eligibility to Include Adults Up to 133 Percent of the Federal Poverty Level (FPL). Beginning January 1, 2014, the ACA gives the state the option to expand Medi–Cal eligibility to include over one million adults with incomes up to 133 percent of the FPL who are currently ineligible—also known as the optional Medi–Cal expansion. (The FPL is currently $23,550 in annual income for a family of four.) For three years, the federal government will pay 100 percent of the costs of health care services provided to the newly eligible population. Beginning January 1, 2017, the federal share of costs associated with the expansion will be decreased over a three–year period until the state pays for 10 percent of the expansion and the federal government pays the remaining 90 percent.
Enacted legislation adopts the optional Medi–Cal expansion and the budget assumes roughly $1.7 billion in federal funds will be used to provide health coverage to the newly eligible population in 2013–14. The state will provide a set of benefits to the newly eligible population that largely mirrors the benefit package currently offered to Medi–Cal beneficiaries, with a couple of exceptions.
- Long–Term Services and Supports (LTSS) will generally be an excluded benefit. However, the state will seek federal approval to provide LTSS to newly eligible beneficiaries who are able to demonstrate that they have limited financial assets—also known as an asset test.
- Some mental health and substance use disorder services that are not currently covered under Medi–Cal managed care (but that will be covered effective January 1, 2014, as described below) will be included as benefits. These services are those that are included in the state’s essential health benefits (EHB) package contained in plans sold on Covered California (California’s Health Benefit Exchange).
Enacted legislation makes ongoing implementation of the optional expansion contingent on minimum level of federal financial support. If the federal government reduces the federal matching rate for the expansion population to 70 percent or less prior to January 1, 2018, the optional Medi–Cal expansion will be terminated within 12 months.
Enhances Mental Health and Substance Use Disorder Services for Currently Eligible Populations. The budget includes $67 million General Fund to provide enhanced mental health and substance use disorder services to currently eligible Medi–Cal enrollees beginning January 1, 2014. Currently eligible populations will be provided mental health and substance use disorder services contained in the state’s EHB package, thereby making the level of mental health and substance use disorder services consistent across currently eligible and newly eligible Medi–Cal populations.
Assumes Costs From Increased Enrollment From Currently Eligible Populations. The spending plan assumes an additional $104 million in General Fund costs in 2013–14 largely associated with providing health coverage to additional currently eligible persons expected to enroll in Medi–Cal under the ACA. The ACA and state legislation enacted during a special session contain several provisions that are expected to simplify and streamline the Medi–Cal eligibility and enrollment process, including:
- Requiring greater use of electronic data to verify eligibility.
- Eliminating the asset test for certain populations.
- Eliminating semiannual reporting requirements.
- Creating a new annual redetermination process that reduces the amount of information that must be provided by beneficiaries and, instead, relies on available electronic data.
These changes will likely increase the number of currently eligible persons who enroll in Medi–Cal. In addition to these changes, other aspects of the ACA—such as the penalties for individuals without health coverage (also known as the individual mandate) and enhanced outreach activities—are expected to encourage greater enrollment from currently eligible, but unenrolled, populations. Unlike health care services provided to the optional expansion population, the state will generally be responsible for 50 percent of the costs for services provided to individuals who would have been eligible under current Medi–Cal eligibility standards.
Provides Funding for County Administration Costs Related to the ACA. The budget includes $87.3 million General Fund to pay for county administration workload associated with implementing various provisions of the ACA, including processing applications and eligibility redeterminations for newly enrolled populations and training eligibility workers. (This amount includes a $15.4 million General Fund COLA for Medi–Cal county administration.) The budget also provides authority to spend an additional $32.7 million General Fund (up to a combined $120 million General Fund) for county administration activities needed to implement the ACA in 2013–14.
Makes Changes Needed to Receive Additional Federal Funding for Preventative Services. The budget assumes $7.5 million General Fund savings from a higher federal matching rate for preventative services authorized under the ACA. Effective January 1, 2013, the ACA established a 1 percentage point increase in the federal matching rate for preventative services and adult vaccines in states that meet certain requirements. In order to qualify for the increase, a state must cover all preventative services assigned a grade A or B by the United States Preventative Services Task Force and all approved vaccines recommended by the Advisory Committee on Immunization Practices. Also, states may not impose beneficiary cost–sharing on such services. Medi–Cal currently covers all of the qualifying preventative services and vaccines and budget–related legislation specifies that Medi–Cal will not impose beneficiary cost–sharing for these services.
Shifts Certain Medi–Cal Enrollees to Covered California. The budget assumes $29.1 million in net General Fund savings associated with shifting the following populations from Medi–Cal to Covered California beginning January 1, 2014.
- Newly Qualified Aliens. The budget includes $2.7 million in General Fund savings from shifting certain qualified aliens who have been in the country for less than five years, also known as newly qualified aliens.
- Certain Pregnant Women. The budget assumes $26.4 million in General Fund savings from shifting pregnant women with incomes from 100 percent to 200 percent of the FPL. (At the time of this report, legislation that would authorize such a shift has not been enacted.)
Individuals will be shifted only if they are eligible for federally subsidized coverage from plans offered through Covered California. The state will cover all beneficiary out–of–pocket expenditures—such as premiums and copayments—as well as any benefits that otherwise would have been covered in Medi–Cal, but that are not provided through Covered California plans.
Provides Funding for Other State Administrative Costs. The budget includes $9.5 million General Fund for state administrative costs associated with the ACA, including IT consultant services, IT system modifications, and managed care plan rate development. The budget also makes permanent or extends 21 limited–term positions ($893,000 General Fund) within the Department of Health Care Services (DHCS) to perform various administrative activities related to the ACA.
The California Health Benefit Exchange (Covered California)
The California Healthcare Eligibility, Enrollment, and Retention System (CalHEERS) Project. The spending plan includes $119.2 million (primarily federal funds) for the development, implementation, maintenance, and operation phases of the CalHEERS Project. The ACA establishes Health Benefit Exchanges through which individuals and small businesses will be able to purchase health coverage. Covered California, jointly with DHCS, sponsored the CalHEERS Project to meet the requirements of the ACA. Specifically, the CalHEERS Project builds a web–based portal designed to allow individuals and small businesses to research, compare, check their eligibility for, and purchase health coverage. The CalHEERS must be operational by the federal deadline of January 1, 2014 to meet the goals and requirements of the ACA. This implementation date requires an aggressive schedule, which increases the risk of missing deadlines and successfully completing the project. Consequently, CalHEERS functionality was prioritized so that federally mandated functionality is available by designated deadlines, while additional functionality, such as integration of CalHEERS with human services programs, is scheduled for later.
Changes to 1991 Health Realignment
Currently, counties have the fiscal and programmatic responsibility for providing health care for low–income populations without health coverage—also known as indigent health care. As part of 1991 realignment, the state provided a dedicated funding stream to counties for indigent health care and public health—hereafter referred to as health realignment funds. In addition, 1991 realignment required counties to meet MOE requirements by spending a specified amount of county general purpose revenues on indigent health care and public health programs.
Medi–Cal Expansion Is Expected to Reduce County Indigent Responsibilities. Counties are likely to experience significant savings in their indigent health care programs with the implementation of the optional Medi–Cal expansion. The optional Medi–Cal expansion shifts much of the responsibility for indigent health care to the state. This shift of responsibility will reduce the need for county expenditures on indigent health care and eventually create new state costs as the enhanced federal matching rate for the expansion population is phased down in future years as described earlier in this report.
Budget Establishes a Structure for Redirecting Some Health Realignment Funds to Offset State General Fund Costs. In recognition of the shifting responsibilities for indigent health care under the optional Medi–Cal expansion, the budget establishes a structure under which a portion of county health realignment dollars will be redirected to benefit the state General Fund. To generate state General Fund savings, the budget requires that a portion of health realignment funds be redirected to help pay CalWORKs grant costs in each county. It is important to note that this approach does not fundamentally increase county financial responsibility for supporting CalWORKs or change the authority or programmatic responsibility for CalWORKs. Rather, it simply requires that any redirected health realignment funds be used for the purposes of paying CalWORKs grants, thereby offsetting state General Fund costs.
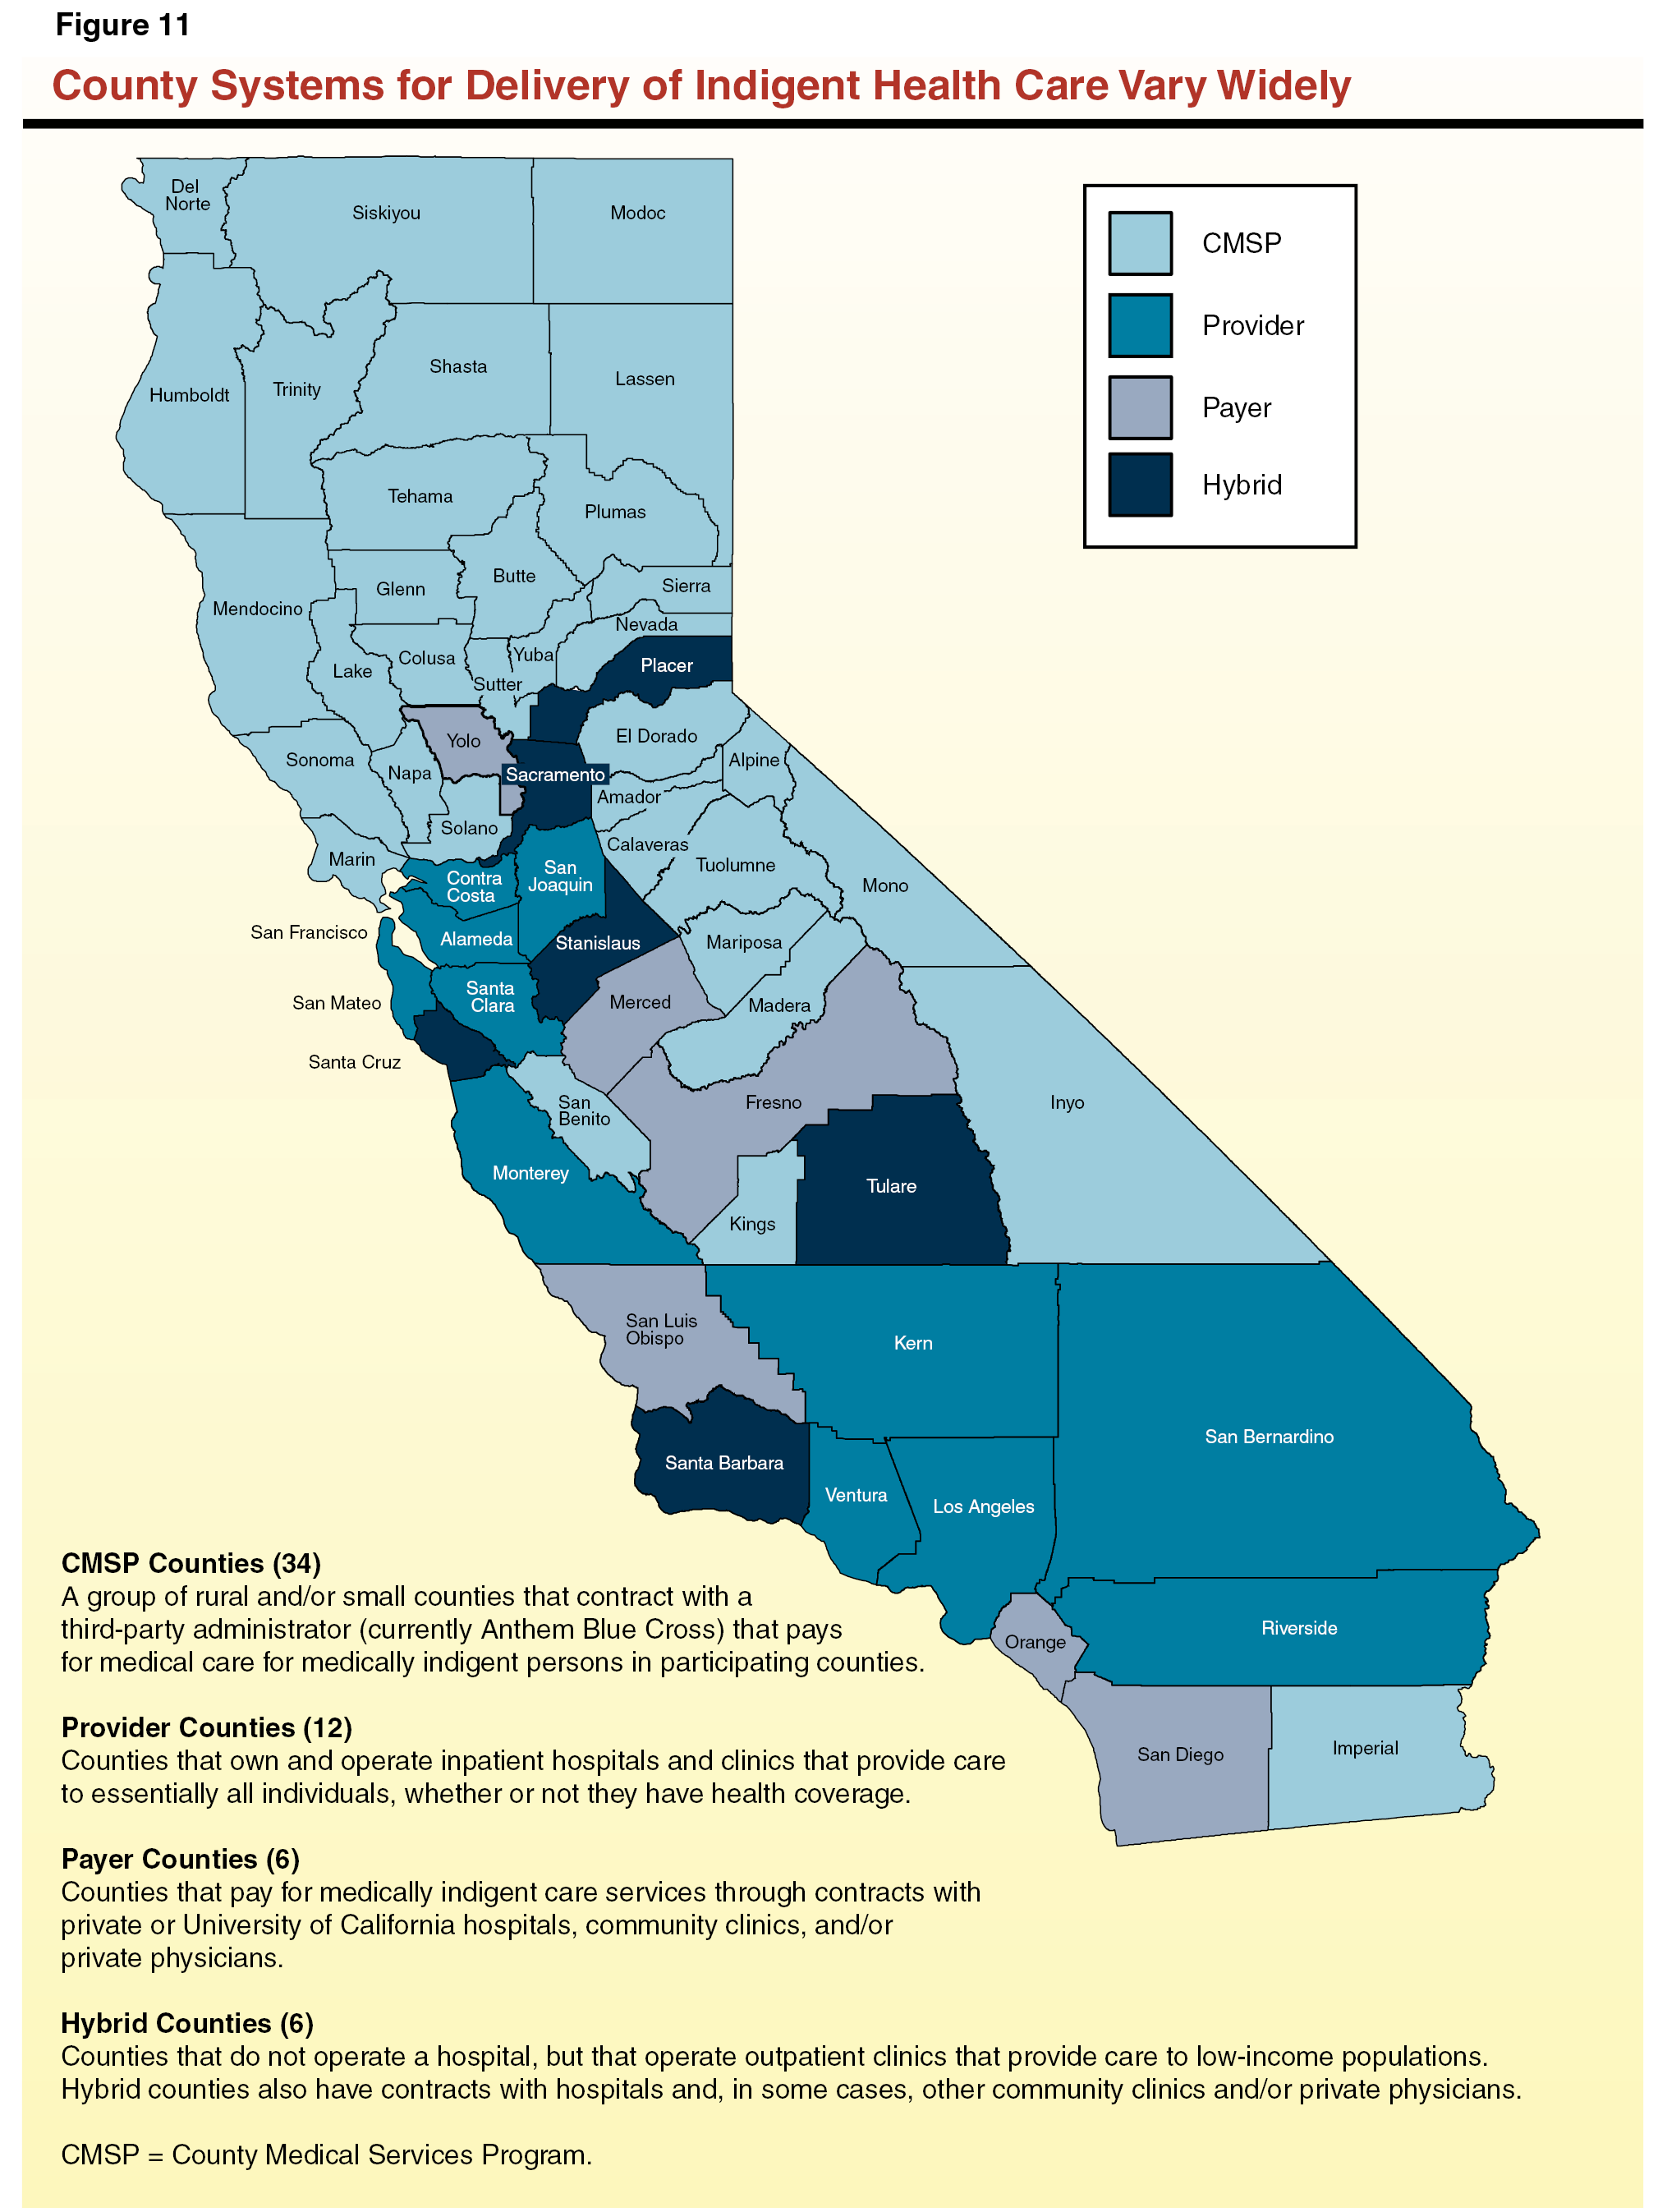
Amount of Redirected Health Realignment Funds Will Be Determined by County–Specific Methods and Decisions. As shown in Figure 11, the manner in which counties currently deliver indigent health services varies from county to county. In recognition of the significant differences among counties and the Legislature’s interest in protecting the county health care safety net, the budget establishes a complex structure to determine the amount of redirected health realignment funds. The methods used to determine the redirected amount differ among counties and many counties will have the option to choose between two different approaches. We discuss these county–specific methods and choices in more detail below.
Provider Counties Given Option to Choose Method for Determining the Redirected Amount. For each of the 12 provider counties, the budget establishes two options for determining the amount of county savings available for redirection. The first option, the “60 percent option,” redirects 60 percent of the sum of: (1) the 1991 health realignment funds that would have otherwise been allocated to the county and (2) the 1991 health MOE in the county. The second option consists of a “shared savings” formula. The formula, which contains many complex details, generally calculates total county savings as the difference between the county’s revenues and costs associated with providing health care services (except for mental health and substance use disorder services) to Medi–Cal and uninsured patients. Below, we briefly describe these two main components of the formula.
- Revenues. For each fiscal year, the formula incorporates most federal, state, and private payments associated with Medi–Cal and uninsured patients (including direct payments for services and supplemental payments such as Disproportionate Share Hospital payments). Revenues under the formula also include each county’s historical use of 1991 health realignment funds and county general purpose funds for indigent health care, trended forward to the current fiscal year.
- Costs. For each fiscal year, the formula incorporates certain operating costs incurred by county hospitals and clinics for providing services to Medi–Cal and uninsured patients, up to a specified cap based on spending levels in prior years. Costs under the formula include only 50 percent of any operating costs above this cap.
The formula defines the amount of county savings available for redirection as the lesser of (1) 80 percent of total county savings as calculated by the formula or (2) the county’s historical use of 1991 health realignment funds for indigent health care, trended forward to the current fiscal year.
Hybrid and Payer Counties Also Given Option to Choose Method for Determining Redirected Amount. Similar to the provider counties, hybrid counties and payer counties also will have the option to redirect funds under the 60 percent option or a variation of the shared savings formula. Generally, the shared savings formula for hybrid and payer counties attempts to calculate the difference between historic county indigent health revenues and ongoing county indigent health costs. Seventy percent of the county savings estimated under the shared savings formula would be redirected to generate state General Fund savings in 2013–14 and 80 percent would be redirected each year thereafter—subject to a cap that is based on the historical proportion of 1991 health realignment funds that were being used to fund indigent health programs.
CMSP Counties Redirect a Predetermined Percentage of 1991 Health Realignment Funds. Unlike the other counties, County Medical Service Program (CMSP) counties do not have the option to use the shared savings formula to determine the redirected amount. The amount of health realignment funds redirected from CMSP and its participating counties will be 60 percent of the sum of: (1) the 1991 health realignment funds that would have otherwise been allocated to those counties, (2) the health MOE in those counties, and (3) the amount that would otherwise have been allocated directly to CMSP.
Total Amount Redirected in 2013–14 Will Not Exceed $300 Million. The budget assumes that the total amount redirected from county health programs—and the associated General Fund savings—will be $300 million in 2013–14. The portion of the $300 million that will be redirected from each county will be based on a schedule determined by DOF, in consultation with the California State Association of Counties. In May 2014, if DHCS estimates that an individual county’s shared savings is less than the amount that was initially scheduled, then the redirected amount will be adjusted downward to reflect the updated shared savings estimate. Shared savings estimates will be reconciled with actual county savings within two years of the close of a fiscal year, as described in more detail below.
Creates County “True–Up” Process Used to Reconcile Estimated Savings With Actual Savings. Beginning in 2014–15, in counties that elect the shared savings formula, the amount that is initially redirected each fiscal year will be based on savings estimates provided by DHCS. Within two years of the end of each fiscal year, counties must submit documentation of county revenues and expenses that will be used to calculate actual county savings and adjust the redirected amount accordingly.
DHCS—Medi–Cal
The spending plan provides $16.1 billion from the General Fund for Medi–Cal local assistance expenditures administered by DHCS. This is an increase of $1.2 billion, or 7.8 percent, in General Fund support for Medi–Cal local assistance compared to the revised prior–year spending level. Spending in 2012–13 was about $483 million greater than the amount appropriated in the 2012–13 budget. Some of the major factors that contributed to the higher–than–expected 2012–13 spending levels in the Medi–Cal Program were: (1) legal challenges prevented $300 million in General Fund savings from reducing certain Medi–Cal provider payments up to 10 percent, (2) failure to obtain federal approval for changes to payments to non–designated public hospitals prevented $94 million in General Fund savings, and (3) failure to obtain federal approval for a seven–visit limit on physician and clinic visits prevented $19 million in General Fund savings.
Differences in Medi–Cal spending between 2012–13 and 2013–14 are in large part the result of underlying cost drivers in the program, such as changes to caseload and utilization of services. We discuss the major policy–driven spending changes that were adopted as part of the 2013–14 Medi–Cal Program budget below.
Coordinated Care Initiative (CCI) Implementation. The 2012–13 budget package authorized CCI as an eight–county demonstration project consisting of three main components: (1) integrating Medi–Cal and Medicare benefits for seniors and persons with disabilities who are enrolled in both programs—known as “dual eligibles”—under the same managed care plans (hereinafter referred to as “demonstration plans”)—this duals demonstration component of CCI is known as Cal MediConnect; (2) requiring mandatory enrollment of dual eligibles into demonstration plans for their Medi–Cal benefits (dual eligibles are passively enrolled into these plans for Medicare benefits, meaning they will be enrolled unless they actively opt out); and (3) shifting Medi–Cal LTSS—including In–Home Supportive Service (IHSS)—to managed care benefits available exclusively through demonstration plans. For a brief overview of the CCI implementation plan assumed under the 2012–13 Budget Act, please see our October 2012 report
The 2012–13 Budget: California Spending Plan. For general background on CCI, please see our February 2013 report
The 2013–14 Budget: Coordinated Care Initiative Update.
In March 2013, the administration announced the signing of a memorandum of understanding (MOU) with the federal Centers for Medicare and Medicaid Services (CMS) to implement Cal MediConnect. The administration also announced that CCI enrollment would begin no sooner than January 1, 2014. Major differences between the terms and conditions of the MOU and the implementation plan assumed under the 2012–13 spending plan include:
- No Medicare Shared Savings. The MOU does not allow the state to share any savings resulting from Cal MediConnect that would otherwise accrue to Medicare. Compared to the Governor’s January budget proposal for 2013–14, which assumed $63 million in Medicare shared savings in 2013–14 and $253 million annually under full CCI implementation, the spending plan assumes none.
- No Six–Month Stable Enrollment. The MOU does not require dual eligibles to remain in demonstration plans for their Medicare benefits for six months before they may opt out. Instead, dual eligibles may elect to opt out of the Medicare portion of the demonstration plans on a month–by–month basis.
- Passive Enrollment Capped for Los Angeles County. The MOU caps passive enrollment of dual eligibles into demonstration plans for their Medicare benefits at 200,000 for Los Angeles County. This brings total estimated enrollment in Cal MediConnect (under full implementation in the eight pilot counties) to approximately 456,000.
The spending plan assumes a net General Fund cost of $21 million related to the first six months of CCI implementation beginning January 1, 2014. (The Governor’s January budget proposal for 2013–14 assumed savings of $171 million General Fund.) Once fully implemented in 2016–17, CCI is expected to save $141 million General Fund annually.
As part of the budget package, the Legislature enacted statutory changes to CCI partly to comply with the MOU with the federal government. These changes include:
- Delinked Implementation of Three CCI Components. Under budget–related legislation, mandatory enrollment of dual eligibles into Medi–Cal managed care and the shift of LTSS to managed care benefits are not required to occur simultaneously with Cal MediConnect in the eight pilot counties. However, at least one of these three components must proceed in a county before IHSS collective bargaining responsibilities in that county can transition to the state level.
- Modified “Poison Pill” Provision. The legislation modifies criteria for the state to proceed with CCI implementation. Under these changes, the Director of Finance will provide a net fiscal estimate of CCI by (1) 30 days prior to the planned start date for enrollment into Cal MediConnect, and (2) January 10 of each fiscal year thereafter. This estimate will compare General Fund costs under CCI to assumed baseline costs if CCI were not operative. The legislation also requires the fiscal estimate to incorporate General Fund savings from imposing a 3.9 percent managed care organization (MCO) tax on Medi–Cal managed care plans. If the Director of Finance’s fiscal estimate does not project net General Fund savings from CCI implementation, all three major components of CCI would become inoperative. For IHSS, collective bargaining at the state level and the existing county MOE for IHSS program costs would both become inoperative.
Assumes Savings From Hospital Fee Extension. The budget package includes $310 million in savings during the last six months of 2013–14 from extending the existing hospital quality assurance fee. The state currently assesses this fee on private hospitals and uses most of the proceeds to draw down federal matching funds to increase Medi–Cal payments to private hospitals. The state also retains a portion of the fee revenue to offset General Fund costs for children’s health coverage.
Lifts Restriction on Enteral Nutrition Benefit. Beginning in May 2014, the spending plan assumes partial–year costs of $1.7 million General Fund from restoring orally consumed enteral nutrition products that were eliminated as a Medi–Cal benefit (with exceptions for individuals with certain diagnoses) as part of the 2011–12 budget package. The estimated full–year cost to restore this benefit is roughly $14 million General Fund.
Restores Some Adult Dental Services That Were Eliminated in 2009. The spending plan assumes partial–year costs of $17 million General Fund from restoring certain adult dental services that were eliminated as a Medi–Cal benefit in 2009. Beginning in May 2014, Medi–Cal will restore coverage for a portion of the previously eliminated adult dental services, including preventative and diagnostic services, services needed to restore damaged teeth, and full mouth dentures. These services will be available for currently eligible adult populations, as well as individuals who become newly eligible under the optional Medi–Cal expansion beginning in 2014 (discussed in more detail earlier). Other dental services, such as implants, will continue to be excluded benefits for adults in Medi–Cal. The estimated full–year cost of partially restoring adult dental services is about $85 million General Fund.
Imposes a Tax on Medi–Cal MCOs. The spending plan assumes roughly $506 million in reduced General Fund spending from establishing two separate taxes on Medi–Cal MCOs. The state’s gross premium tax rate of 2.35 percent will be applied retroactively to premium revenues collected during 2012–13 and a tax rate of 3.9 percent (equal to the current state sales tax rate) will be applied to premium revenues collected from July 1, 2013 through June 30, 2016. The revenue from these taxes will be matched with federal Medicaid funds and will be used to: (1) increase Medi–Cal managed care capitated rates by an amount that offsets the tax paid by MCOs and (2) fund state health programs. The 2012–13 tax is estimated to offset General Fund spending by $166 million—primarily in the Healthy Families Program (HFP). The 2013–14 tax is estimated to offset General Fund spending by $340 million in the Medi–Cal Program.
Department of Developmental Services (DDS)
Under the budget plan, General Fund spending for DDS will increase from $2.7 billion in 2012–13 to $2.8 billion in 2013–14, or 4.7 percent. The net year–over–year increase in General Fund support is partly due to increases in caseload and utilization of services and partly due to other factors. Below, we discuss the most significant spending changes that were adopted in the DDS budget.
Sunsets Regional Center (RC) and Provider Payment Reduction. The budget provides an increase of $32 million General Fund to reflect the June 30, 2013 sunset of a 1.25 percent reduction to RC operations and the rates paid to community–based providers of services.
RCs Will Cover Managed Care Copayments and Coinsurance. The budget provides almost $10 million General Fund in 2013–14 to support payments by RCs of health insurance copayments and coinsurance for services identified as necessary in a consumer’s individual program plan.
Eliminates Sunset for Annual Family Program Fee (AFPF). The budget plan assumes almost $4 million in General Fund savings by eliminating the June 30, 2013 sunset date for the AFPF. This fee is generally paid by families with adjusted gross family incomes at or above 400 percent of the FPL.
Addresses Decertification of Residential Units at Sonoma Developmental Center (DC). The budget provides a total of almost $19 million General Fund in 2013–14 to fund ongoing operations and address deficiencies at Sonoma DC. In January 2013, the Department of Public Health (DPH) announced that it was taking significant actions action to protect Sonoma DC residents due to deficient practices at the DC that have harmed some residents. (The DPH licenses health facilities and certifies them on behalf of CMS—facilities must be certified to receive federal Medicaid funding.)
Backfills Federal Sequester. The spending plan includes an increase of roughly $12 million General Fund in 2013–14 to backfill federal sequestration reductions to federal grants that are used to partially fund RC purchase of services for consumers.
Department of State Hospitals (DSH)
Under the budget plan, General Fund spending for DSH will increase from about $1.4 billion in 2012–13 to $1.5 billion in 2013–14 (7.5 percent). The net year–over–year increase in General Fund support is due to several factors, including the startup of the new California Health Care Facility (CHCF) in Stockton and the activation of new units within the state hospitals.
CHCF Startup. The budget plan includes almost $101 million General Fund for the ongoing activation of 514 beds within the new CHCF in Stockton. The total includes $68 million for additional staff in 2013–14 to complete the activation and $33 million to recognize the full–year costs of positions approved in the 2012–13 Budget Act. The CHCF is operated by the California Department of Corrections and Rehabilitation (CDCR). However, DSH staff will provide mental health services at the facility.
Activates New State Hospital Units. The budget includes $16 million General Fund to fund the activation of four new units at three state hospitals. (The new units have between 35 and 50 beds each.) In addition, DSH will convert one unit from treating mentally disordered offenders to treating persons found incompetent to stand trial.
Continues to Install Personal Duress Alarm System (PDAS). The budget includes about $17 million General Fund to continue to install and support the operation of a new PDAS at state hospitals. The state hospitals have experienced a substantial increase in violence in recent years as the forensic population has increased. The PDAS is one of the major safety initiatives being implemented at the state hospitals, with each staff person wearing a personal alarm.
Investment in Mental Health Wellness—Infrastructure Grants
The budget plan includes a total of $206 million ($143 million General Fund) to make improvements to the state’s mental health infrastructure. The responsibility for the administration of this initiative is placed in three state agencies: the California Health Facilities Financing Authority (CHFFA), the Mental Health Services Oversight and Accountability Commission (MHSOAC), and the Office of Statewide Health Planning and Development (OSHPD). The initiative includes a total of $500,000 in one–time Proposition 63 Mental Health Services Act (MHSA) funds to cover state administrative costs of the initiative.
CHFFA. The budget includes almost $143 million in one–time General Fund spending and $6.8 million in other funds to build capacity for mental health treatment services. The CHFFA will administer the following:
- $125 million General Fund for grants to expand capacity by at least 2,000 crisis stabilization and residential treatment beds over the next two years.
- $15 million General Fund for grants to expand crisis stabilization units that provide expedited services lasting less than 24 hours to mentally ill persons that have an urgent condition requiring immediate attention.
- $2.5 million General Fund and $6.8 million other funds ($4 million MHSA funds and $2.8 million federal funds) for grants to fund mobile crisis teams that can provide crisis intervention, family support, and certain types of evaluations.
MHSOAC. The budget includes $54 million in ongoing funding ($32 million MHSA funds and $22 million federal funds) for the MHSOAC to provide funding for 600 triage personnel in select rural, urban, and suburban areas. The budget also includes $400,000 in one–time MHSA funds for the MHSOAC to develop consensus guidelines and best practices for involuntary commitment care and provide applicable training.
OSHPD. The budget includes $2 million in ongoing MHSA funds for OSHPD to provide peer support training in the areas of crisis management, suicide prevention, recovery planning, and targeted case management.
Department Eliminations, Program Shifts, and Other Transfers
The budget plan completes the elimination of the Department of Alcohol and Drug Programs (DADP), shifts some programs from one department to another, and transfers state–level administration of some functions between departments. We discuss these organizational changes below.
Eliminates DADP. As part of its 2011–12 budget proposal, the administration stated its intent to eventually eliminate DADP. State–level oversight of the Drug Medi–Cal program was shifted from DADP to DHCS effective July 1, 2012, and budget legislation transferred other administrative and programmatic functions of DADP to unspecified departments within the California Health and Human Services Agency (HHSA) effective July 1, 2013. The legislation required that HHSA, in consultation with stakeholders and affected departments, submit a detailed plan for the reorganization of DADP’s functions to the Legislature as part of the 2013–14 Governor’s Budget and made the ultimate placement of DADP’s programmatic and administrative functions contingent upon enactment of the 2013–14 Budget Act and implementing legislation.
The budget shifts almost $314 million in all funds ($34 million General Fund) and 225.5 positions from DADP to DHCS to reflect the shift of the following programs and functions: (1) federal grants administration, (2) licensing activities, (3) Driving Under the Influence Program, (4) narcotic treatment programs, and (5) parolee services programs. The budget also shifts $3.7 million (all funds) and four positions from DADP to DPH to reflect the transfer of the Office of Problem Gambling. The budget assumes that the year–over–year net fiscal effect of the shift of DADP’s functions, programs, and positions is neutral.
Continues to Shift Children Enrolled in HFP to Medi–Cal. As part of the 2012–13 budget plan, the Governor proposed shifting all enrollees in HFP—administered by the Managed Risk Medical Insurance Board—to Medi–Cal—administered by DHCS—over a nine–month period beginning in October 2012. In response, the Legislature enacted Chapter 28, Statutes of 2012 (AB 1494, Committee on Budget), to implement a modified version of the Governor’s proposal to shift all HFP enrollees into Medi–Cal (hereinafter referred to as the “transition”). The Legislature’s plan delayed the start of the transition to January 2013, included direction on how the transition is to be conducted, and provided for legislative oversight. Beginning January 1, 2013, the transition started to take place in four phases throughout 2013. Phases one and two are underway and include more than 600,000 children. Phase three is scheduled to begin no sooner than August 1, 2013 and includes about 135,000 children. Phase four is scheduled to begin no earlier than September 1, 2013 and includes about 43,000 children.
Shifts Access for Infants and Mothers (AIM)–Linked Infants to DHCS. Children born to women in the AIM program, which covers families whose incomes are up to 300 percent of the FPL, are eligible for health, dental, and vision services for two years. The AIM–linked infants whose mothers have incomes up to 250 percent of the FPL are scheduled to transition to Medi–Cal as part of the shift of HFP to Medi–Cal. The budget plan transfers the remaining AIM–linked infants between 250 percent and 300 percent of the FPL to DHCS.
Overview of Total Spending. The spending plan provides $7.3 billion from the General Fund for human services programs. This is a decrease of $118 million, or 1.6 percent, compared to the revised prior–year spending level, as shown in Figure 12. This net decrease largely reflects a decrease in the General Fund support for the CalWORKs program due to the shifting of $562 million of costs from the General Fund to other fund sources (1991 realignment revenues and federal funds) without a corresponding reduction in program levels. If not for these funding shifts, there would be a net increase in General Fund expenditures for human services programs in 2013–14, reflecting a number of policy changes and other adjustments resulting in General Fund costs, mainly in the CalWORKs program.
Figure 12
Major Human Services Programs and Departments—Spending Trends
General Fund (Dollars in Millions)
|
|
2011–12
|
2012–13
|
2013–14
|
Change From
2012–13 to 2013–14
|
|
Amount
|
Percent
|
|
SSI/SSP
|
$2,721.6
|
$2,752.8
|
$2,787.0
|
$34.1
|
1.2%
|
|
CalWORKs
|
1,156.9
|
1,521.4a
|
1,194.9b
|
–326.5
|
–21.5
|
|
In–Home Supportive Services
|
1,725.9
|
1,792.9
|
1,874.9
|
81.9
|
4.6
|
|
County Administration/Automation
|
569.4
|
684.4
|
742.5
|
58.1
|
8.5
|
|
Department of Child Support Services
|
306.6
|
306.8
|
312.6
|
5.8
|
1.9
|
|
Department of Rehabilitation
|
54.5
|
55.3
|
56.6
|
1.3
|
2.4
|
|
Department of Aging
|
31.8
|
32.1
|
32.2
|
0.1
|
0.4
|
|
All other social services (including state support)
|
232.2
|
240.2
|
267.6
|
27.4
|
11.4
|
|
Totals
|
$6,798.9
|
$7,385.9
|
$7,268.2
|
–$117.7
|
–1.6%
|
Summary of Major Changes. Figure 13 shows the major General Fund changes in the 2013–14 Budget Act for human services programs. Most of the budget changes were in the CalWORKs and IHSS programs. Absent the changes shown in the figure, General Fund spending for human services programs in 2013–14 would have been almost $200 million lower. Below, we discuss the major changes in each program area.
Figure 13
Major Changes—Human Services Programs
2013–14 General Fund Effect (In Millions)
|
Program
|
Amount
|
|
CalWORKs
|
|
|
5 percent grant increase
|
—a
|
|
Updated employment services budgeting methodology
|
$142.8
|
|
Funding for early engagement strategies
|
48.3
|
|
In–Home Supportive Services
|
|
|
8 percent across–the–board reduction in service hours
|
–175.0
|
|
Repeal of 20 percent across–the–board reduction in service hours
|
180.0
|
|
Total
|
$196.1
|
CalWORKs
The budget provides $1.2 billion from the General Fund ($5.5 billion total funds) in support of the CalWORKs program. This is roughly $240 million (all funds) more than would have been spent absent the policy changes discussed below. The General Fund amount for CalWORKs reflects an estimated $300 million shift of CalWORKs General Fund responsibility to counties in connection with the Medi–Cal expansion (for more information, see the “Health” section earlier in this report). In addition, the 2013–14 spending plan partially reverses a 2012–13 funding swap between CSAC and CalWORKs that decreased federal funding for CalWORKs and increased the amount of General Fund provided to CalWORKs by a like amount, with no net effect overall on total CalWORKs expenditures or General Fund spending. The smaller swap results in a year–over–year decrease in General Fund support for CalWORKs ($262 million) and a like increase in federal funding for the program.
New Grant Increase Mechanism Funded With Redirected Realignment Revenues. Budget legislation creates a new statutory mechanism to redirect the growth in certain 1991 realignment revenues to offset the General Fund costs of providing future CalWORKs grant increases. The budget package begins this process by providing a 5 percent grant increase, effective March 2014, at an estimated partial–year cost of $50.9 million. The estimated full–year cost of this increase is $150 million. As displayed in Figure 14, the increase is estimated to result in approximately $30 of additional cash assistance per month for a family of three with no income. This increase will be partially offset by a corresponding decrease in food assistance through the CalFresh program. For background on 1991 realignment and a discussion of these changes, see the box below.
Figure 14
Monthly CalWORKs Grant and CalFresh Benefitsa
|
|
February 2014
|
March 2014b
|
Change
|
|
Amount
|
Percent
|
|
High–Cost Counties
|
|
|
|
|
|
Grant
|
$638
|
$670
|
$32
|
5%
|
|
CalFresh benefit
|
494
|
485
|
–9
|
–2
|
|
Totals
|
$1,132
|
$1,155
|
$23
|
2%
|
|
Grant as percent of FPL
|
39%
|
41%
|
|
|
|
Grant and CalFresh benefit as percent of FPL
|
70
|
71
|
|
|
|
Low–Cost Counties
|
|
|
|
|
|
Grant
|
$608
|
$638
|
$30
|
5%
|
|
CalFresh benefit
|
497
|
494
|
–3
|
–1
|
|
Totals
|
$1,105
|
$1,132
|
$27
|
2%
|
|
Grant as percent of FPL
|
37%
|
39%
|
|
|
|
Grant and CalFresh benefit as percent of FPL
|
68
|
70
|
|
|
1991 Realignment
Program Changes. In 1991, the state enacted a major change in the state and local government relationship, known as realignment. The 1991 realignment package: (1) transferred several programs from the state to the counties, including indigent health, public health, and mental health programs; (2) changed the way state and county costs are shared for certain social services and health programs termed the “Social Service Subaccount programs” (In–Home Supportive Services [IHSS], California Children’s Services, welfare–to–work programs, and child welfare programs); and (3) increased the sales tax and vehicle license fee and dedicated these increased revenues for the increased financial obligations of counties.
Funding Allocations Laws. The original 1991 realignment allocated revenues to counties based on the amount of funding each county received from the state for the realigned programs just prior to realignment. State law specified, however, that future growth in these realignment revenues was to be allocated based on a separate set of formulas. Under these formulas, revenue growth is first used to fund prior–year increases in county costs for the Social Service Subaccount programs. Then, all remaining revenue growth—known as “General Growth”—was allocated to counties in proportion to their historical share of state funding for the realigned programs.
2012 Changes to IHSS. In 2012, as part of the Coordinated Care Initiative, the state made several major changes to IHSS, including the creation of a county maintenance–of–effort (MOE) requirement. Specifically, counties previously paid 17.5 percent of IHSS program costs, using 1991 realignment revenues for the vast majority of those costs. The county MOE established in 2012 replaced this 17.5 percent share of costs with a requirement that counties generally maintain their 2011–12 expenditure levels for IHSS beginning in 2012–13, to be adjusted annually by 3.5 percent beginning in 2014–15. Although the county MOE will continue to be funded from 1991 realignment revenues, county costs are expected to grow more slowly in future years under the MOE than under the prior funding arrangement because IHSS program costs have historically grown faster than the 3.5 percent annual adjustment. As less realignment revenue growth is needed to satisfy county IHSS costs, more revenue growth should be available for allocation as General Growth.
2013–14 Budget Changes General Growth Allocation. Under prior law, the additional General Growth funds made available by the creation of the IHSS MOE would have been distributed across all 1991 realignment programs based on historical formulas. However, the budget package redirects a portion of these General Growth funds to pay for California Work Opportunity and Responsibility to Kids (CalWORKs) grant increases. Specifically, the share of General Growth allocated to county indigent health and public health programs will be cut by roughly two–thirds, while Social Services Subaccount programs will no longer receive General Growth allocations. These funds instead will be used to pay for future CalWORKs grant increases.
The new statutory mechanism requires that DOF regularly perform certain calculations to determine the level of grant increase, if any, to be provided each year. Each January and May, in connection with the release of the Governor’s budget and May Revision, DOF will estimate (1) the amount of redirected realignment revenues available to support grant increases and (2) the cumulative cost of all grant increases previously provided under the new mechanism. If the available funds exceed the cost of previous grant increases, DOF will calculate the percentage increase in CalWORKs grants that can be supported on an ongoing basis by these excess funds. Such an increase would take effect the following October. If, on the other hand, no excess funds are estimated to be available, no additional grant increase will be provided. In the event that redirected realignment revenues are estimated to be insufficient to cover the costs of previous grant increases, the previous increases will remain in effect and the shortfall will be paid for out of the General Fund. In this scenario, no additional grant increases would be provided under the mechanism until the previous grant increases are fully supported by the redirected funds.
While the new mechanism will provide automatic grant increases to the extent that funding is available from a dedicated revenue source outside of the General Fund, the Legislature and Governor retain the ability to make changes to CalWORKs grant levels through the annual budget process that are separate from increases provided under the new mechanism. Costs and savings associated with such changes would accrue to the General Fund.
Increased Employment Services Funding From a Higher Budgeted Cost Per Case. The methodology historically used to budget CalWORKs employment services became less reliable in recent years due to short–term changes in work exemption policies that were intended to achieve General Fund savings to mitigate the state’s recent budget problems. The budget plan addresses this issue by adopting a new cost–per–case methodology that ties back to average funding levels used before these changes were made. Transitioning to this new methodology results in additional ongoing General Fund costs of $142.8 million.
Early Engagement Strategies Adopted. The 2012–13 budget package made significant changes to the CalWORKs program that resulted, among other things, in increased flexibility in the state rules governing mandatory work participation and a new 24–month limit on adult eligibility for aid under these more flexible rules. The 2013–14 budget package includes $48.3 million General Fund (partial–year effect, with an estimated full–year cost of $134 million) for three strategies intended to help recipients more effectively engage with the CalWORKs program in light of the prior–year’s program changes. Specifically, the budget provides the following spending increases from the General Fund: (1) $9.4 million to develop and implement a new statewide welfare–to–work appraisal tool, (2) $10.8 million for counties to provide enhanced services to certain CalWORKs families, and (3) $39.3 million to fund additional subsidized employment positions (with offsetting grant savings of $11.2 million). Budget legislation defines these strategies in statute and also makes other changes to state law that clarify how existing welfare–to–work processes will be modified to accommodate the new strategies.
Changes to Vehicle Asset Limit. Budget legislation also increases the limit on the value of a vehicle that a family can own and qualify for CalWORKs assistance. Going forward, the limit will be automatically adjusted for inflation. This change will result in increased costs as more families qualify under the higher vehicle asset limit, but the budget assumes that these costs will be fully offset by county administrative savings, resulting in no net effect on program spending.
In–Home Supportive Services
The budget increases General Fund support for IHSS by $82 million (4.6 percent) in 2013–14 when compared to the revised 2012–13 level. The major budgetary changes for IHSS relate to (1) enacting and implementing the terms of an IHSS litigation settlement agreement and (2) enacting legislation that makes changes to the conditions under which IHSS may shift from a fee–for–service benefit to a managed care plan benefit in eight counties under CCI. Below, we describe the major changes to the IHSS program.
Repeals Three Enacted IHSS Reductions. The budget plan enacts the terms of a settlement agreement reached between the state and plaintiffs in March 2013, effectively settling two IHSS–related lawsuits. This settlement agreement provides for the repeal of three previously enacted IHSS program reductions that had been legally challenged and preliminarily enjoined by court orders. In their place, the settlement agreement provides for a compromise reduction plan intended to realize some General Fund savings while lessening the magnitude of IHSS program reductions. The three enacted–but–enjoined reductions repealed by the budget plan include: (1) establishing a stricter threshold of need to receive IHSS, (2) reducing IHSS hours by 20 percent, and (3) reducing state participation in IHSS provider wages and benefits. (For further background on these three reductions, please see our
Analysis of Settlement Agreement for In–Home Supportive Services (IHSS) Lawsuits. The repeal of these three previously enacted reductions is estimated to result in General Fund costs of approximately $180 million in 2013–14. (This estimate reflects the Governor’s January budget assumption that the 20 percent reduction in authorized hours would have been implemented for eight months in 2013–14.) This loss of General Fund savings in 2013–14 is almost entirely offset by an alternative savings mechanism that is part of the settlement agreement and is discussed further below.
One–Time 8 Percent Across–the–Board Reduction in Authorized Hours. In accordance with the terms of the settlement agreement, the budget plan enacts an 8 percent across–the–board reduction in authorized hours for 2013–14. The 8 percent reduction is estimated to result in net General Fund savings of approximately $175 million in 2013–14. The repealed 20 percent reduction and the new 8 percent reduction yield almost the same level of savings in 2013–14 primarily because (1) the 20 percent reduction was assumed to be implemented for only eight months—versus 12 months of implementation for the 8 percent reduction—and (2) the 20 percent reduction included a supplemental process to fully or partially restore hours for certain recipients, while the 8 percent reduction does not. Because IHSS recipients experienced a 3.6 percent reduction in authorized hours in 2012–13, they will experience an additional 4.4 percentage point reduction in 2013–14.
Ongoing 7 Percent Across–the–Board Reduction in Authorized Hours Beginning in 2014–15. The budget plan also enacts an ongoing 7 percent across–the–board reduction in authorized hours beginning in 2014–15—another aspect of the IHSS settlement agreement. (In effect, IHSS recipients will experience a 1 percentage point restoration of authorized hours beginning July 1, 2014.) This ongoing across–the–board reduction is estimated to result in net General Fund savings of approximately $172 million in 2014–15.
Intent to Implement Assessment on Home Care Services. Reflecting the terms of the settlement agreement, the budget plan enacts intent language specifying that the ongoing 7 percent reduction will be fully or partially rescinded if the costs are offset by General Fund savings resulting from an assessment on home care services (including home health care and IHSS). Additional legislation will be required to authorize this assessment on home care services.
The IHSS Program as a Managed Care Plan Benefit in Eight Counties. The 2012–13 budget plan enacted a transition of IHSS to a managed care plan benefit in the eight CCI counties. For a full discussion of the budgetary plan adopted in 2013–14 for CCI, please refer to the CCI write–up under the “Health” section of this chapter.
County Welfare Automation Projects
The Child Welfare Services–New System (CWS–NS) Project. The 2011–12 Budget Act indefinitely suspended the Child Welfare Services Web (CWS/Web) project proposed to replace the current child welfare case management system, which is based on outdated technology and not fully compliant with federal system requirements. The CWS/Web project was suspended due to escalating project costs. However, the Legislature made clear its continued interest in addressing the deficiencies in the existing system through 2011–12 budget legislation that directed the Department of Social Services (DSS) and the Office of Systems Integration (OSI), in consultation with stakeholders, to recommend an option for addressing the deficiencies.
In their 2012 report to the Legislature, DSS and OSI stated that it was neither technically feasible nor cost–effective to maintain and upgrade the existing system. Instead, they recommended its replacement using a “buy/build approach,” which would involve the purchase of an application (or a suite of applications) that is already available in the marketplace. Additional functionally would be identified and built over time, so as to customize the system for California’s program needs. The replacement system project is referred to as CWS–NS.
The spending plan includes $9.8 million ($4.4 million General Fund) for planning and procurement activities associated with the CWS–NS. The resources are intended to provide the necessary project management, fiscal, procurement and contracting, business analysis, and technical expertise to support the development of the CWS–NS project during the planning and procurement phase. The CWS–NS is estimated to cost $392.7 million (all funds), including one full year of maintenance and operations, and planned to be fully implemented by September 2017. The successful implementation of CWS–NS is intended to meet the business needs of CWS, comply with state and federal laws and regulations, result in enhanced data reliability and availability, allow user mobility, and allow for automated system interfaces with other state partners for data sharing.
The budget act and subsequent legislation provides $10.3 billion from the General Fund for judicial and criminal justice programs, including support for ongoing programs and capital outlay projects (see Figure 15). This is an increase of $936 million, or 9.6 percent, above the revised 2012–13 General Fund spending level. Figure 16 summarizes the major General Fund changes adopted by the Legislature in the criminal justice area, which we discuss in more detail below.
Figure 15
Judicial and Criminal Justice Budget Summarya
General Fund (Dollars in Millions)
|
Program/Department
|
2011–12
|
2012–13
|
2013–14
|
Change From 2012–13
|
|
Amount
|
Percent
|
|
Department of Corrections and Rehabilitationb
|
$9,206
|
$8,698
|
$9,199
|
$501
|
5.8%
|
|
Judicial branch
|
1,215
|
755
|
1,218
|
463
|
61.3
|
|
Department of Justice
|
101
|
167
|
174
|
8
|
4.6
|
|
Board of State and Community Corrections
|
—
|
42
|
44
|
3
|
6.7
|
|
Other criminal justice programsc
|
53
|
51
|
13
|
–38
|
–74.6
|
|
Totals
|
$10,576
|
$9,712
|
$10,649
|
$936
|
9.6%
|
Figure 16
Major General Fund Changes—Judicial and Criminal Justice Programs
2013–14 (In Millions)
|
Program
|
Amount
|
|
Judicial Branch
|
|
|
Restore one–time reductions
|
$418
|
|
Increase funding for court operations
|
63
|
|
California Department of Corrections and Rehabilitation
|
|
|
Increase funding to comply with prison population cap
|
315
|
|
Increase funding for employee compensation (expiration of PLP)
|
258
|
|
Begin activation of Correctional Health Care Facility and DeWitt Annex
|
151
|
|
Increase funding for debt service on lease–revenue costs
|
45
|
|
Expand fire camps
|
15
|
|
Additional savings from 2011 realignment of adult offenders
|
–225
|
|
Modify probation incentive grant funding formula
|
–30
|
|
|
Judicial Branch
The budget provides nearly $3.2 billion for support of the judicial branch—an increase of $268 million, or 9.2 percent, from the revised 2012–13 level. This amount includes $1.2 billion from the General Fund and $499 million from the counties, with most of the remaining balance of nearly $1.5 billion derived from fine, penalty, and court fee revenues. The General Fund amount is an increase of $463 million, or 61 percent, from the revised 2012–13 amount. Funding for trial court operations is the single largest component of the judicial branch budget, accounting for nearly four–fifths of total spending.
Trial Court Operations. The budget package fully restores a one–time $418 million General Fund reduction made to the trial courts in 2012–13. The budget also provides an ongoing $60 million General Fund augmentation for increasing public access to trial court services and requires that these funds be allocated based on the new workload–driven funding formula recently adopted by the judicial branch. (The statewide courts—the Supreme Court, Courts of Appeal, and Habeas Corpus Resource Center—received an augmentation of $3 million for their operations.) As shown in Figure 17, the $60 million augmentation reduces the amount of ongoing prior–year reductions to the trial courts to $664 million in 2013–14. The budget also assumes that $446 million in actions—including local trial court reserves, transfers from various special funds, and revenues from fine and fee increases made in prior years—will be taken to help offset a large portion of this reduction. On net, this leaves $218 million in reductions allocated to the trial courts in 2013–14, a similar amount as taken in recent years.
Figure 17
Trial Court Budget Reductions
(In Millions)
|
|
2011–12
|
2012–13
Estimated
|
2013–14
Budgeted
|
|
General Fund Reductions
|
|
|
|
|
One–time reduction
|
—
|
–$418
|
—
|
|
Ongoing reductions (cumulative)
|
–$606
|
–724
|
–$664
|
|
Total Reductions
|
–$606
|
–$1,142
|
–$664
|
|
Actions to Address Reduction
|
|
|
|
|
Construction fund transfers
|
$213
|
$299
|
$55
|
|
Other special fund transfers
|
89
|
102
|
52
|
|
Trial court reserves
|
—
|
385
|
200
|
|
Increased fines and fees
|
71
|
121
|
121
|
|
Statewide programmatic changes
|
19
|
21
|
18
|
|
Total Actions
|
$392
|
$928
|
$446
|
|
Net Reductions Allocated to the Trial Courtsa
|
–$214
|
–$214
|
–$218
|
As described below, the final budget package also includes a number of policy changes related to court operations.
Trial Court Reserves and Cash Management. The budget package maintains the new trial court reserves policy enacted in 2012–13, which limits trial court reserves—unspent funds from prior years—to 1 percent of prior–year operating budgets beginning in 2014–15. (As noted above, $200 million in trial court reserves is assumed to be used to offset ongoing prior–year reductions on a one–time basis in 2013–14.) The budget package also includes legislation that provides some fiscal tools to help trial courts manage their cash under this reserves policy. Specifically, the budget (1) authorizes intra–branch special fund loans totaling up to $150 million to trial courts for cash management purposes, (2) requires annual reporting regarding the amount of loans made, and (3) exempts reserves which must be used for specific statutory purposes from the calculation of a trial court’s 1 percent limit.
Administrative Efficiencies and User Fee Increases. To further assist trial courts address their ongoing budget reductions, the budget authorizes four administrative efficiencies and user fee increases to help courts operate more efficiently or recover costs: (1) limiting the information courts are required to provide to state agencies for the state’s Tax Intercept Program as operated by the Franchise Tax Board, (2) expanding administrative authority to waive repayment of court–ordered dependency counsel fees, (3) increasing the fee for “exemplification” of records (involving triple certification of records, generally for use as evidence in jurisdictions outside of California) from $20 to $50, and (4) increasing the fee for mailing claims to defendants in small claims actions from $10 to $15.
Other Provisions. Other major policy changes included in the final budget package include: (1) limiting audits conducted by the California State Auditor to five judicial branch entities biennially and requiring their selection to be based on certain risk factors, (2) requiring reporting on the Judicial Council’s policy regarding public access to committee meetings, and (3) making permanent the current requirement that trial courts publicly report their budgets prior to adoption.
Capital Outlay. The budget provides roughly $830 million for various court construction projects. This amount consists of: (1) $752 million in lease–revenue bond authority for the construction of two previously approved projects (San Diego and Stockton); (2) $75 million from the Immediate and Critical Needs Account (ICNA) for acquisition, design, and construction activities for 13 projects; and (3) $4 million in local reimbursements to ICNA for design activities for one project. (In accordance to Chapter 311, Statutes of 2008 [SB 1407, Perata], ICNA receives revenue from certain court fee and fine increases.)
The budget also transfers $200 million from ICNA to the General Fund on a one–time basis, resulting in the design activities of 12 projects being delayed for up to a year. Additionally, the budget authorizes $35 million from ICNA for the first service payment for the Long Beach Courthouse, commencing upon occupancy in September 2013, and requires the Judicial Council to complete a report assessing the public–private partnership delivery method used for the project’s construction. The use of ICNA funds for Long Beach service payments will result in the indefinite delay of four additional construction projects. (Earlier in 2012–13, the Judicial Council indefinitely delayed eight projects to address prior redirections of ICNA funds to trial court operations or the General Fund.) Finally, the budget includes the reversion of $30 million in unspent ICNA funds due to lower–than–anticipated acquisition costs as well as the indefinite delay of certain projects.
Corrections and Rehabilitation
The budget act and related legislation contains $9.2 billion from the General Fund for support of CDCR. This is a net increase of $501 million, or 5.8 percent, above the revised 2012–13 level of spending. This increase primarily reflects (1) costs to expand the use of contracted beds, (2) additional employee compensation costs due to the expiration of the personal leave program (PLP), and (3) costs associated with the activation of CHCF and the DeWitt Nelson Correctional Annex in Stockton. The budget package also includes $5 million for CDCR to expand the provision of sex offender treatment to all sex offenders on parole. These increases are partially offset by additional savings from the decline of the state inmate and parolee populations due to the 2011 realignment, which shifted responsibility for managing many lower–level adult offenders from the state to counties.
Adult Correctional Population. Figure 18 shows the recent and projected changes in the inmate and parolee populations. As shown in the figure, these populations are projected to decline through 2015 and then grow slightly in subsequent years. The reductions are due largely to the effect of the 2011 realignment. The prison population is projected to decline to about 129,000 inmates by the end of 2013–14, and the parole population is projected to decline to about 37,000 parolees.
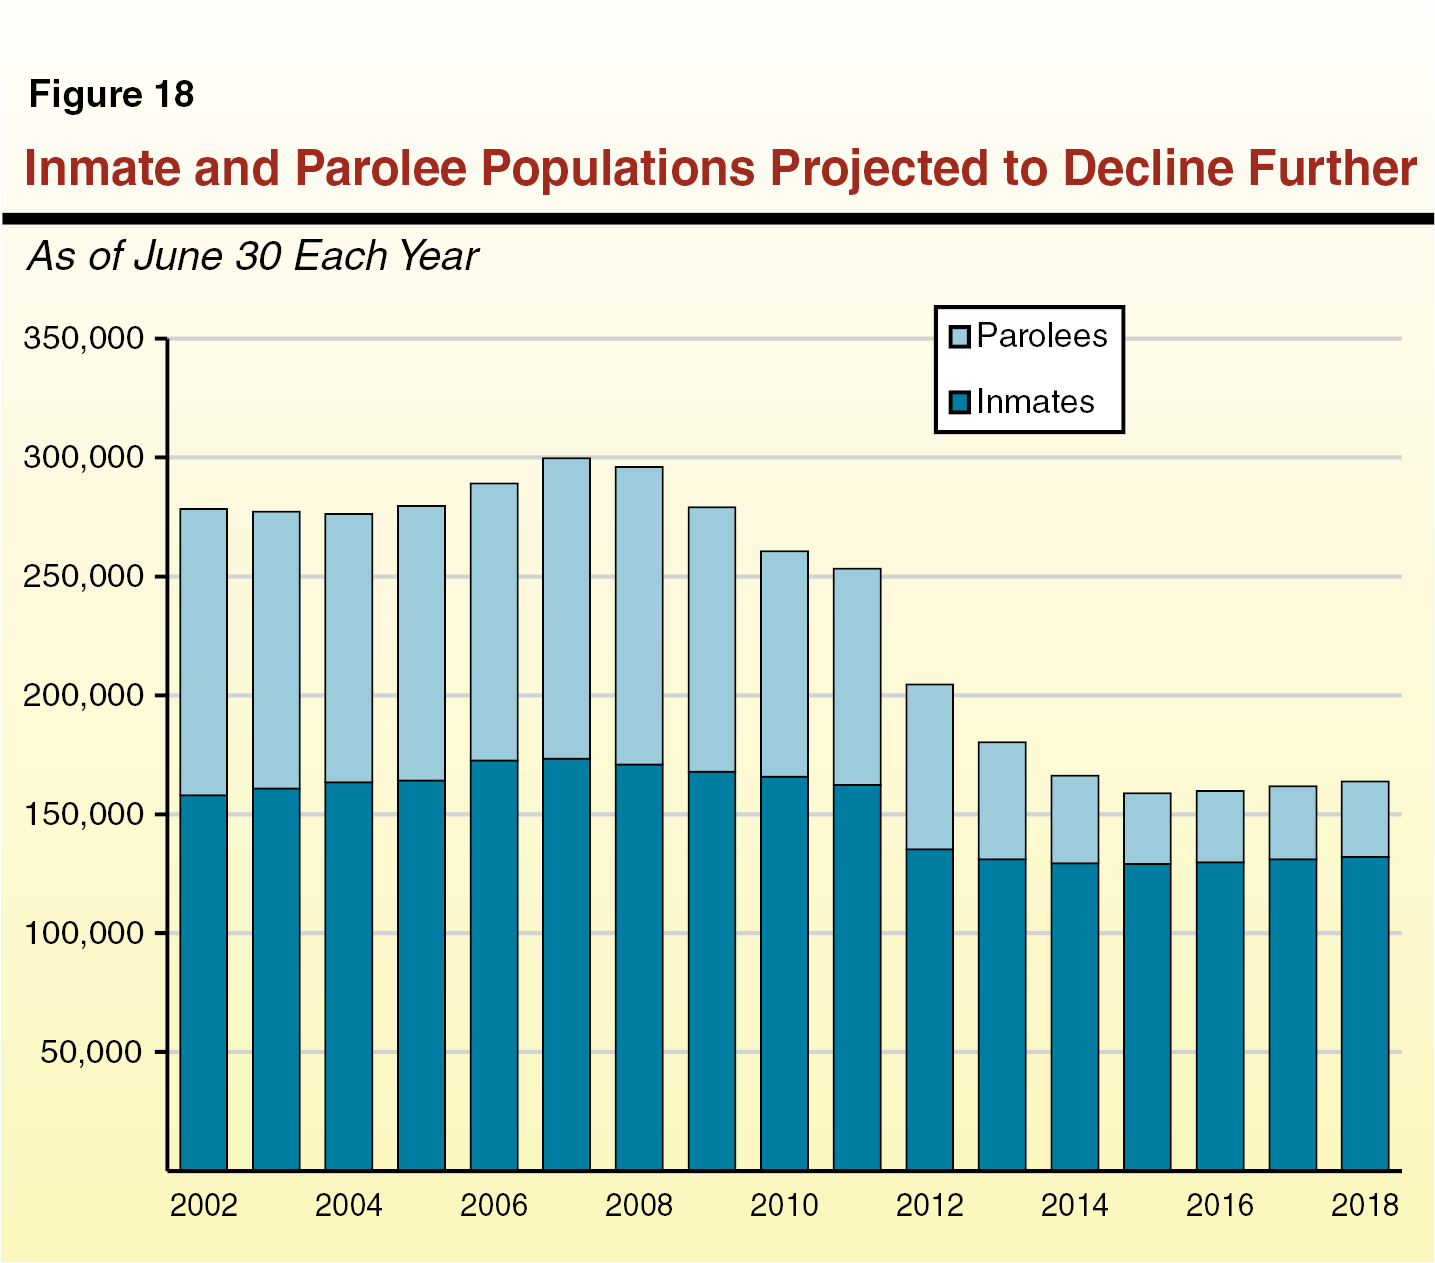
Meeting the Prison Population Cap. In September 2013, the Legislature passed and the Governor signed Chapter 310, Statutes of 2013 (SB 105, Steinberg) to address the federal three–judge panel order requiring the state to reduce the prison population to no more than 137.5 percent of design capacity by December 31, 2013. Chapter 310 provides CDCR with an additional $315 million (General Fund) and authorizes the department to enter into contracts to secure a sufficient amount of inmate housing to meet the court order and to avoid the early release of inmates which might otherwise be necessary to comply with the order. The administration estimates that this funding would allow it to contract for about 12,500 beds. The types of contracted beds could include those operated by public or private providers in California or other states. In addition, Chapter 310 authorizes CDCR to lease a private facility in California City and convert the facility’s existing staff to state employees. The authority provided to CDCR to expand its contract capacity expires January 1, 2017.
The measure also requires that if the federal court modifies its order capping the prison population, a share of the $315 million appropriation in Chapter 310 would be deposited into a newly established Recidivism Reduction Fund. Specifically, the measure requires that the first $75 million of freed up funds resulting from having to contract for fewer beds than projected would be deposited into the fund. Any remaining funds would be split evenly between the Recidivism Reduction Fund and the General Fund. The measure provides that any money deposited into the Recidivism Reduction Fund is for activities designed to reduce the state prison population, including recidivism reduction programs.
In addition, Chapter 310 includes a provision suspending the closure of the California Rehabilitation Center (Norco), which was scheduled to occur by December 31, 2016. Chapter 310 also requires that the administration submit reports to the Legislature by April 2014 and January 2015 regarding the prison overcrowding problem and that provide recommendations that are cost–effective and protect public safety.
On September 24, 2013, the three–judge panel issued an order directing the state to meet with inmate attorneys to discuss how to implement a long–term overcrowding solution. The order also prohibits the state from entering into any new contracts for out–of–state housing during this meeting process. A subsequent order moved back the deadline for meeting the population cap to February 24, 2014.
Operational Impacts of Realignment. The budget package also includes several changes related to realignment consistent with previous administration implementation plans. Specifically, the budget includes $225 million in net savings in 2013–14 related to the 2011 realignment. This includes reduced parolee–related costs and savings related to parole revocation hearings. (Under realignment, trial courts, rather than the Board of Parole Hearings, will conduct parole revocation hearings beginning in 2013–14.) In addition, the budget includes $15 million to expand inmate fire camps capacity, roughly to their levels prior to realignment. Funding for this program had been cut previously because of anticipated population reductions due to realignment. However, the population of inmates eligible for the camps has been higher than was originally expected. The budget package also includes other realignment–related policy changes, such as a requirement that CDCR share with counties certain health records of offenders being released from prison to county supervision, as well as authorization for CDCR to establish a pilot reentry program to transfer some inmates to county jail up to 60 days prior to their release from prison.
Probation Incentive Program. As part of the 2013–14 budget package, the Legislature adopted statutory changes to the grant program authorized by Chapter 608, Statutes of 2009 (SB 678, Leno). The SB 678 grant program was enacted to improve outcomes for adult felony probationers by giving counties a share of the state prison and parole savings that occurs when fewer felony probation failures are sent to state prison. Collectively, the adopted changes to this program have the net effect of reducing total program funding by about $30 million. This reduction largely reflects savings from changes in the grant formula to account for the fact that fewer probationers can come to state prison under realignment. These savings are partially offset by changes to expand the program to reward counties when they successfully send fewer felony probation failures to jail. In addition, Chapter 310 increases the amount provided to counties per failure reduced beginning in 2014–15. In total, counties are budgeted to receive $108 million in SB 678 grant funds in 2013–14.
Employee Compensation Cost Increases. The budget includes an increase of $258 million associated with increased employee compensation costs. Most of this increase is a result of the expiration of the PLP, which reduced affected employees’ pay by about 5 percent and gave them eight hours of leave each month in 2012–13.
Correctional Health Care. The budget package includes $151 million from the General Fund for CDCR to begin operating the CHCF and the adjacent Dewitt Nelson Correctional Annex in Stockton, both of which are scheduled to open in 2013–14. The budget also includes funding to make permanent 211 existing nursing positions for distributing medications to inmates. The annual General Fund cost of the positions, which were initially approved on a two–year limited term basis in 2011–12, is $15 million. In addition, the budget provides $7 million to expand (1) the Transitional Case Management Program to pre–enroll all eligible inmates into Medi–Cal before they leave prison, and (2) the Integrated Services for Mentally Ill Parolees program, which provides mental health treatment and other wraparound services to parolees. Increasing prerelease Medi–Cal enrollment is expected to allow the state to draw down about $7 million in increased federal Medi–Cal reimbursements for parolees’ medications, offsetting existing General Fund costs.
Division of Juvenile Justice (DJJ). The budget provides $170.9 million in General Fund support of DJJ. This includes a reduction of $8.7 million related to the juvenile ward population. The average daily ward population is projected to decline by 17 percent, from 821 wards in 2012–13 to 679 wards in 2013–14. These savings are partly offset by an increase of $8.1 million to reflect actual expenditures that had not been accounted for in prior budgets, specifically higher–than–average salaries for security staff and a contract with DSH to provide inpatient mental health services to wards.
Other Criminal Justice Programs
Board of State and Community Corrections (BSCC). The budget includes $129 million ($44 million from the General Fund and $85 million from other funds) for BSCC, which is responsible for administering various public safety grants, overseeing local correctional standards, providing technical assistance to local criminal justice agencies, and collecting data. Compared to the revised spending estimates for 2012–13, the budget increases support for law enforcement grants to cities by $3.5 million. The budget package also adds a new member to BSCC’s board to act as a full–time chairperson and authorizes an additional four administrative and five research positions, which are funded by redirecting some of BSCC’s existing spending authority.
Enforcement of Firearms Laws. The budget includes an augmentation of $3.2 million from the Dealers’ Record of Sale (DROS) Special Account primarily to support increased Department of Justice (DOJ) workload related to conducting background checks of persons seeking to purchase firearms. In addition, Chapter 2, Statutes of 2013 (SB 140, Leno), provides a one–time supplemental appropriation of $24 million in 2012–13 from the DROS Special Account to reduce a backlog of cases in DOJ’s Armed Prohibited Persons System (APPS). The APPS confiscates firearms from persons legally prohibited from possessing them due to criminal history, mental illness, or other prohibiting factors.
Public Safety Communications Office. As part of the budget package, the Legislature approved the Governor’s proposal to transfer the Public Safety Communications Office and $187 million in various special funds from the Department of Technology to the Office of Emergency Services (OES). (The California Emergency Management Agency became OES on July 1, 2013, pursuant to the Governor’s Reorganization Plan Number 2 of 2012.) This office supports the state’s 911 system and public safety radio infrastructure. The Legislature also approved budget trailer legislation to transfer to OES the authority to set the amount of the surcharge levied on certain telecommunication services to support the 911 system.
The 2013–14 budget provides a total of $7.2 billion from various funds for programs administered by the Natural Resources and Environmental Protection Agencies. This is a decrease of $2.7 billion, or 27 percent, when compared to revised 2012–13 expenditures. Most of this reduction reflects lower bond expenditures in 2013–14. (We discuss funding for the California Public Utilities Commission [CPUC] in the “Other Major Provisions” section of this report.)
As shown in Figure 19, the budget includes $4.4 billion (including $2.1 billion from the General Fund) for the support of various resources programs in 2013–14. This is a decrease of $2.6 billion, or 37 percent, from the revised 2012–13 spending level. Most of this reduction in year–over–year spending is attributable to a decline in bond fund spending. The largest single General Fund expenditure in the resources area is debt service on general obligation bonds—totaling $1 billion in 2013–14.
Figure 19
Resources Budget Summary
(Dollars in Millions)
|
|
2011–12
|
2012–13
|
2013–14
|
Change From 2012–13
|
|
Amount
|
Percent
|
|
Expenditures
|
|
|
|
|
|
|
Department of Water Resources
|
$732
|
$2,108
|
$733
|
–$1,375
|
–65%
|
|
General obligation bond debt service
|
898
|
890
|
1,000
|
109
|
12
|
|
Department of Forestry and Fire Protection
|
734
|
877
|
846
|
–31
|
–4
|
|
Department of Parks and Recreation
|
648
|
778
|
530
|
–249
|
–32
|
|
Energy Resources Conservation
|
321
|
499
|
489
|
–10
|
–2
|
|
Department of Fish and Wildlife
|
321
|
428
|
364
|
–64
|
–15
|
|
Department of Conservation
|
85
|
106
|
83
|
–23
|
–21
|
|
California Conservation Corps
|
72
|
84
|
71
|
–12
|
–14
|
|
Wildlife Conservation Board
|
112
|
672
|
66
|
–606
|
–90
|
|
Other resources programs
|
309
|
530
|
197
|
–333
|
–63
|
|
Totals
|
$4,231
|
$6,973
|
$4,379
|
–$2,594
|
–37%
|
|
Funding
|
|
|
|
|
|
|
General Fund
|
$1,909
|
$2,030
|
$2,124
|
$94
|
5%
|
|
Special funds
|
939
|
1,179
|
1,227
|
48
|
4
|
|
Bond funds
|
1,223
|
3,447
|
823
|
–2,624
|
–76
|
|
Federal funds
|
161
|
316
|
205
|
–111
|
–35
|
Department of Water Resources (DWR)
The budget includes $733 million from various fund sources to support DWR, a net reduction of $1.4 billion, or 65 percent, from the revised 2012–13 level. This is primarily due to a reduction in planned bond expenditures. The budget does, however, include funding increases for certain DWR–related programs. For example, the budget provides $11.3 million in Proposition 84 bond funds to begin the remediation of the Lake Perris dam in order to ensure its seismic safety. Specifically, the funding provided in the budget reflects the state’s share of the total repair costs in 2013–14, with the remaining costs to be paid by the state’s water contractors. (The state’s share of costs is based on the Davis–Dolwig Act of 1961, which establishes that contractors should not be charged for the costs incurred to enhance fish and wildlife or provide recreation on the State Water Project [SWP].) According to DWR, the estimated total cost of the Lake Perris dam project is $287 million. However, the total cost of the project may be determined to be less in the future if certain parts of the remediation are unnecessary. This would reduce the overall amount of state funding needed. In addition, the budget provides $10 million in bond funds for a grant to several local agencies to fund a fish screen for a new water project along the Sacramento River that will serve the cities of Davis and Woodland. The fish screen would protect migrating fish (such as salmon). The $10 million appropriation provides a match to secure federal funding.
Delta–Related Expenditures
The budget provides a total of $270 million in state funds—mainly SWP funds and various bond funds—across nine state entities (such as DWR, the Department of Fish and Wildlife [DFW], and the Delta Stewardship Council) to address a number of interrelated water problems in the Sacramento–San Joaquin Delta region. The largest program expenditures are for improvements to the existing conveyance system ($158 million) as part of the Bay Delta Conservation Plan and ecosystem restoration ($41 million).
Forestry and Fire Protection
The budget includes total expenditures of $846 million for the California Department of Forestry and Fire Protection (CalFire) from various funding sources, a decrease of $31 million, or 4 percent, from the revised 2012–13 level. Of this total, $654 million is for fire protection activities. (This does not include reimbursements from local governments for cooperative fire protection, which is expected to be $301 million in 2013–14.) The General Fund provides $661 million for CalFire operations, which is a net decrease of $80 million from the prior year. As has been the case in previous years, the budget includes $177 million from the General Fund for emergency fire protection activities and allows the Director of Finance to augment this amount to pay for additional fire protection expenses, as needed.
Department of Parks and Recreation (DPR)
The budget provides a total of $530 million for the support of DPR. This is a decrease of $249 million, or 32 percent, from the revised 2012–13 level, mainly due to a reduction in bond fund expenditures for local assistance grants. The budget includes $116 million from the General Fund, about $100 million from fees paid by park visitors, $197 million in other special funds, $82 million in bond funds, and $34 million in federal funds.
Boating and Waterways. The DPR budget includes a fund shift of $33.7 million in special funds (mainly boat fuel taxes and registration fees) to support the newly created Division of Boating and Waterways within DPR. Under the Governor’s Reorganization Plan Number 2 of 2012, responsibilities of the Department of Boating and Waterways were transferred to DPR effective July 1, 2013.
Funding for Maintenance at Goat Canyon. The budget provides $1 million from the State Parks Recreation Fund each year for three years to perform maintenance on the Goat Canyon Sediment Basins at Border Fields State Park, which must be cleared of trash that flows in from the Tijuana River in order to comply with various state environmental regulations. The budget package also requires DPR to provide a report to the Legislature in 2015–16 on alternative funding sources to support the ongoing annual maintenance costs at the Goat Canyon Sediment Basins.
Energy Commission
The budget provides a total of $489 million for the support of the Energy Resources Conservation and Development Commission (commonly referred to as the California Energy Commission, or CEC). This is a decrease of $10 million, or 2 percent, from the revised 2012–13 budget. The budget authorizes the expenditure of $193 million from the Electric Procurement Investment Charge established by the CPUC. Specifically, this surcharge is intended to support those activities previously funded by the “public goods charge,” such as investments in public interest energy research and incentive payments for renewable energy production.
Department of Fish and Wildlife
The budget includes $364 million from various fund sources to support DFW, a net reduction of $64 million, or 15 percent, from the revised 2012–13 level. This is primarily due to a reduction in planned bond expenditures and federal funding. The budget does, however, include increased reimbursements of $2.5 million in revenues generated from agricultural and grazing leases (Wildlife Restoration Fund), as well as trailer bill language that allows these revenues to be used for improving and maintaining the land. These changes were adopted in response to concerns that revenues from leases had been improperly used or never collected.
Other Resources Programs
Salton Sea Restoration. The budget provides a total of $32.4 million for activities related to the restoration of the Salton Sea. Specifically, the budget includes: (1) $28.4 million in reimbursement authority for DWR to construct 800 to 1,200 acres of habitat to test future restoration concepts for the Salton Sea, (2) $2 million in local assistance to the Secretary of Natural Resources from the Salton Sea Restoration Fund for a study to develop a financially feasible restoration plan, and (3) $2 million to DWR in reimbursement authority to support program administration.
Timber Harvest Plan (THP) Regulation. The budget provides a $6.6 million augmentation from the Timber Regulation and Forest Restoration Fund to support 49.3 additional positions for THP regulation, which reflects a 35 percent increase from 2012–13 staffing levels. The additional positions will be allocated across the four departments responsible for reviewing THPs—CalFire, DFW, the State Water Resources Control Board, and the Department of Conservation—as well as the Natural Resources Agency. Some of the additional positions are intended to restore staffing for THP regulation at these departments to their 2007 staffing levels in order to ensure that THPs receive the legally required reviews. Additional positions are also provided to CalFire to allow the department to complete additional reporting requirements.
California Coastal Commission. The budget provides a one–time increase of $4 million in General Fund support for the California Coastal Commission to review and certify the plans that local governments within the coastal zone develop to govern land use in those areas. The increase includes $3 million to fund 25 limited–term positions and $1 million for grants to local governments. The additional funding is intended to help ensure that all local plans are completed and up to date.
As shown in Figure 20, the budget includes $2.8 billion (mostly from special funds) for various environmental protection programs. This is a decrease in spending of $111 million, or 4 percent, from the revised 2012–13 spending level.
Figure 20
Environmental Protection Budget Summary
(Dollars in Millions)
|
|
2011–12
|
2012–13
|
2013–14
|
Change From 2012–13
|
|
Amount
|
Percent
|
|
Expenditures
|
|
|
|
|
|
|
Department of Resources, Recycling, and Recovery
|
$1,445
|
$1,460
|
$1,485
|
$25
|
2%
|
|
State Water Resources Control Board
|
698
|
763
|
629
|
–134
|
–18
|
|
Air Resources Board
|
474
|
405
|
422
|
17
|
4
|
|
Department of Toxic Substances Control
|
159
|
190
|
177
|
–13
|
–7
|
|
Department of Pesticide Regulation
|
78
|
82
|
81
|
–1
|
–1
|
|
Other environmental programs
|
32
|
40
|
36
|
–4
|
–11
|
|
Totals
|
$2,886
|
$2,941
|
$2,830
|
–$111
|
–4%
|
|
Funding
|
|
|
|
|
|
|
General Fund
|
$40
|
$47
|
$46
|
–$1
|
–2%
|
|
Special funds
|
2,448
|
2,484
|
2,454
|
–30
|
–1
|
|
Bond funds
|
180
|
210
|
127
|
–83
|
–39
|
|
Federal funds
|
218
|
199
|
202
|
3
|
1
|
Resources, Recycling, and Recovery
The budget provides a total of $1.5 billion to the Department of Resources, Recycling, and Recovery (CalRecycle) for waste management and recycling efforts. Of this amount, $1.2 billion is to support the department’s Beverage Container Recycling Program (BCRP), which is funded from beverage container redemption payments that are collected and deposited into the Beverage Container Recycling Fund (BCRF). Specifically, the budget provides eight, three–year limited–term positions and $984,000 from the fund to develop new procedures for certifying recyclers.
The budget package also includes funding and trailer bill language for the department to begin the process of reforming BCRP to address both the program’s structural deficit and recycling fraud. Specifically, the budget provides eight three–year, limited–term positions and $984,000 from the BCRF to develop new procedures for certifying recyclers, as well as eliminates the use of a comingled rate for returned beverage containers, and mandates the use of CalRecycle’s data reporting system for all program participants.
Air Resources Board (ARB)
The budget provides a total of $422 million to the ARB, an increase of $17 million, or roughly 4 percent, from the revised 2012–13 level. This amount includes Proposition 1B bond funds for infrastructure projects, activities related to freight movement, and programs to reduce the state’s emission of greenhouse gases (GHGs).
Climate Change. The budget provides $38 million in special funds across eight state agencies for implementation of the California Global Warming Solutions Act of 2006 (Chapter 488, Statues of 2006 [AB 32, Núñez]) to reduce GHG emissions to 1990 levels by 2020. Figure 21 lists expenditures, number of positions, funding sources, and activities funded on an agency–by–agency basis for the implementation of AB 32 in 2013–14. Expenditures include about $33 million for ARB to continue implementation of various measures, such as the cap–and–trade program discussed below. The budget also includes $649,000 and five positions for the Department of Housing and Community Development to review the housing elements of local governments’ general plans. The balance of the expenditures is to be used primarily to fund research and planning of other GHG emission reduction activities. As shown in the figure, the funding source for AB 32 implementation is the AB 32 cost of implementation fee that ARB began assessing in 2010–11 on major GHG emitters who are subject to the cap–and–trade regulation. For 2013–14, the fee is also intended to repay various special fund loans that supported the implementation of AB 32 between 2007–08 and 2009–10.
Figure 21
Allocation of AB 32 Implementation Fee for 2013–14
(Dollars in Thousands)
|
Agency
|
Positions
|
Expenditures
|
Activity
|
|
Air Resources Board
|
158
|
$35,894
|
Implement GHG emission reduction regulations.
|
|
Department of Housing and Community Development
|
6
|
783
|
Review housing elements for local governments.
|
|
Secretary for Environmental Protection
|
4
|
586
|
Oversee Climate Action Team activities.
|
|
State Water Resources Control Board
|
2
|
578
|
Implement and monitor GHG emission reduction measures.
|
|
Department of Forestry and Fire Protection
|
1
|
576
|
Conduct carbon sequestration analysis.
|
|
Department of Resources, Recycling, and Recovery
|
6
|
515
|
Implement and monitor GHG emission reduction measures.
|
|
Department of Public Health
|
—
|
348
|
Develop sustainable community modeling.
|
|
Department of Water Resources
|
2
|
324
|
Conduct SWP climate change/energy program activities.
|
|
Totals
|
179
|
$39,694
|
|
Cap–and–Trade. In order to achieve the state’s emission reduction goal (as specified in AB 32), ARB implemented a cap–and–trade program that places a “cap” on aggregate GHG emissions from entities responsible for roughly 80 percent of the state’s emissions. As part of this program, ARB began holding quarterly auctions in 2012–13 for entities to obtain carbon allowances. As of June 2013, these auctions have raised a total of $257 million. Planned auctions for 2013–14 are expected to raise additional revenue. The budget plan authorizes the Director of Finance to loan up to $500 million in cap–and–trade auction revenues to the General Fund. The budget also provides $577,000 in auction revenue to the Office of Environmental Health Hazard Assessment to identify disadvantaged communities that can benefit from investments of cap–and–trade revenues. In addition, two positions and $1.3 million in auction revenue is provided to ARB to enhance oversight of auction activities.
The spending plan provides $19.8 billion from various fund sources for transportation programs. As shown in Figure 22, this is an increase of $273 million, or 1.4 percent, when compared to the revised level of spending in the prior year.
Figure 22
Transportation Program Expenditures
Various Funds (Dollars in Millions)
|
Program/Department
|
2011–12
|
2012–13
|
2013–14
|
Change From 2012–13
|
|
Amount
|
Percent
|
|
Department of Transportation
|
$11,416
|
$13,261
|
$12,757
|
–$504
|
–3.8%
|
|
High–Speed Rail Authority
|
112
|
2,432
|
3,247
|
815
|
33.5
|
|
California Highway Patrol
|
1,809
|
1,805
|
1,879
|
74
|
4.1
|
|
Department of Motor Vehicles
|
915
|
951
|
979
|
28
|
2.9
|
|
Transit Capital
|
767
|
598
|
480
|
–118
|
–19.7
|
|
State Transit Assistance
|
396
|
415
|
392
|
–23
|
–5.5
|
|
California Transportation Commission
|
53
|
28
|
29
|
1
|
3.6
|
|
Totals
|
$15,468
|
$19,490
|
$19,763
|
$273
|
1.4%
|
Department of Transportation (Caltrans)
The budget plan includes total expenditures of $12.8 billion from various fund sources for Caltrans. This level of expenditures is less than in 2012–13 by roughly $500 million (or 3.8 percent). The budget provides approximately $4.6 billion for transportation capital outlay, $3.2 billion for local assistance, $1.8 billion for capital outlay support (COS), and $1.7 billion for highway maintenance and operations. The budget also provides $1 billion for Caltrans’ mass transportation and rail programs and $218 million for transportation planning. The balance of funding goes for program development, legal services, and other purposes.
Active Transportation Program. Active transportation involves the traveler being physically active, such as biking and walking. The budget package consolidates three existing active transportation programs—the federal Transportation Alternatives Program, Safe Routes to Schools, and the Bicycle Transportation Account—into a single active transportation program and provides a total of $129.5 million annually for this new program. As specified in budget trailer legislation, 50 percent of the funds are available for statewide projects, 40 percent available for large urban areas through metropolitan planning organizations, and 10 percent available for rural areas. The legislation also specifies that at least $24 million of the program funding must be spent on Safe Routes to Schools projects for each of the first three years of the program (2013–14 through 2015–16). The California Transportation Commission is required to develop guidelines and select projects for the state’s share of the funding.
Continued Use of Transportation Funds to Pay Debt Service. The budget uses $67 million in transportation revenues that are not constitutionally restricted to pay General Fund debt–service costs on transportation bonds in 2013–14. These particular revenues come from miscellaneous sources, such as rental income and the sale of surplus property. In addition, the Legislature adopted budget trailer legislation to permanently dedicate all such revenues collected in future years to pay debt service on transportation bonds.
COS Program Review. The budget provides $1.8 billion for 10,149 FTE staff in the COS program to support Caltrans’ capital outlay projects. Staff in the COS program conduct environmental reviews, design and engineer projects, oversee construction, and perform various other related activities. Due to concerns regarding the lack of workload information to fully justify the actual level of COS resources that Caltrans needs each year, the Legislature adopted supplemental report language requiring DOF and our office to jointly conduct a comprehensive review of Caltrans’ COS program. The review is to focus on identifying workload metrics, improving program processes, and achieving a transparent and standardized workload–based assessment of staffing needs. The Legislature’s intent is that the results of the review be incorporated into the 2014–15 budget.
Proposition 1B Appropriations. Proposition 1B, a ballot measure approved by voters in November 2006, authorized the issuance of $20 billion in general obligations bonds for state and local transportation improvements. All Proposition 1B funds are subject to appropriation by the Legislature. The budget appropriates $258 million of Proposition 1B funds for various transportation programs. This appropriation level is significantly lower than the appropriations made in recent years because the majority of funds have already been appropriated.
High–Speed Rail Authority (HSRA)
The budget plan includes total expenditures of $3.2 billion from various fund sources for HSRA. This is an increase of $815 million, or 34 percent, compared to the level of spending in 2012–13, which is mainly due to the timing of the expenditure of funds available for the high–speed rail project. Of the $3.2 billion in total expenditures, the budget plan assumes $2.3 billion will be from the sale of Proposition 1A (2008) bonds and $900 million from federal funds. We note, however, that Proposition 1A funds will not be available for expenditure until the state court affirms through a validation action that the overall project is consistent with the funding requirements of Proposition 1A.
Increased Funding for Additional Staffing. The budget provides $10.5 million to fund an additional 105 positions at HSRA—more than double the number of positions funded in 2012–13. The additional staff will handle increasing workload related to procurements, IT, human resources, and moving some project management and oversight activities from external consultants to in–house staff.
Public Transportation Account Loan. The budget plan authorizes a one–time loan of up to $26.2 million from the Public Transportation Account to the High–Speed Passenger Train Bond Fund. This loan will provide short–term funding for the cost of state operations as the HSRA pursues a validation action. These funds are to be repaid with interest when the state is once again able to sell Proposition 1A bonds.
California Highway Patrol (CHP)
The budget provides $1.9 billion to fund CHP operations, $74 million, or 4 percent, more than in 2012–13. Virtually all of this amount is from the Motor Vehicle Account (MVA), which generates its revenues primarily from driver license and vehicle registration fees. The budget includes $17 million for CHP to replace three helicopters and one airplane. In addition, the budget provides $4.9 million to fund the acquisition and preliminary plans for a new CHP area office in Santa Fe Springs, as well as $1.5 million for advanced planning and site selection to replace up to five unspecified CHP area offices.
Department of Motor Vehicles (DMV)
The budget provides $979 million for DMV operations, $28 million, or 3 percent, more than in 2012–13. Of this total amount, 96 percent is from the MVA. The budget includes $6.5 million in funding for the construction phase of the replacement DMV field office in Grass Valley. In addition, the budget includes nearly $1 million for DMV to develop regulations for the safe operation of autonomous vehicles by January 1, 2015, as required by Chapter 570, Statutes of 2012 (SB 1298, Padilla).
Information Technology Modernization (ITM) Project Terminated. The ITM Project’s goal was to modernize the DMV’s core driver license and vehicle registration systems. In 2012, disagreements arose between the department and the primary vendor on how to effectively manage the workload and maintain the project on schedule, including the quantity of vendor staff necessary and their required experience. According to the department, the disagreements seriously and negatively affected the project schedule. Based on concerns regarding the lack of progress towards reaching an agreement on a path forward for the project, the California Technology Agency terminated the ITM Project on January 31, 2013. The termination notice directed DMV to complete a small amount of remaining work on the driver license component of the project. That work has since been completed and the driver license system is fully upgraded. Minimal work was completed on the vehicle registration component of the ITM Project, and there is no current plan to address necessary upgrades. Of the estimated $242 million in total project costs, a total of $140 million (MVA) has been spent on the project. The DMV anticipates that $11 million of the $16 million 2012–13 appropriation for the project will remain unspent due to its termination, resulting in savings. Going forward, DMV plans to evaluate options for addressing the continued need for a modernized vehicle registration system.
Enterprise Zones
For about three decades, the Enterprise Zone program has provided a collection of tax benefits—most significantly tax credits for recently hired employees and purchases of certain equipment—to businesses that operate or hire employees residing in specifically defined geographical areas. In 2010, the most recent year for which data are available, the Enterprise Zone program reduced General Fund revenues by more than $700 million.
Enterprise Zones Eliminated. Legislation enacted shortly after the 2013–14 Budget Act—Chapter 69, Statutes of 2013 (AB 93, Committee on Budget)—eliminates the Enterprise Zone program on January 1, 2014. No new Enterprise Zone tax credits will be issued for new hires or equipment purchases occuring after January 1, 2014. However, businesses are permitted to “carry forward” hiring and sales tax credits received prior to that date to offset future tax liabilities for a period of ten years. Therefore, the state will continue experiencing some Enterprise Zone–related revenue losses for the next decade.
New Tax Expenditure Programs Adopted. Effective January 1, 2014, Chapter 69 and Chapter 70, Statutes of 2013 (SB 90, Galgiani) also establish a package of new tax expenditure programs to replace the Enterprise Zone program. This package includes a sales tax exemption for certain equipment purchases. Specifically, business expenditures on qualified manufacturing and research and development equipment are exempt from the state General Fund portion of the sales tax rate (3.94 percent). This exemption expires on January 1, 2022. As described below, the tax expenditure package also includes a new hiring credit and tax credit agreements.
New Hiring Credit. Certain businesses operating in former Enterprise Zones or newly designated areas (census tracts which are in the top 25 percent of the state in both unemployment and poverty rates) are eligible to receive a tax credit for each newly hired full–time employee earning a minimum of 150 percent of the state minimum wage ($12 per hour) who is: (1) unemployed for more than six months, (2) a veteran who is unemployed following discharge, (3) a recipient of the federal Earned Income Tax Credit or cash assistance through CalWORKs or county General Assistance programs, or (4) an ex–offender. The new employee must also represent an increase in the firm’s total statewide employment. The hiring credit is equal to 35 percent of wages paid above 150 percent (or $10 per hour, in some cases) and below 350 percent of the state minimum wage and may be received for up to five years per new employee. Temporary help, retail, food and beverage service, and certain other entertainment businesses would not be eligible for the hiring credit. The tax credit program would expire on January 1, 2021.
GO–Biz Tax Credit Agreements. General Fund savings resulting from the elimination of Enterprise Zones in excess of the cost of the new sales tax exemption and hiring credit—up to $30 million in 2013–14, $150 million in 2014–15, and $200 million thereafter—are allocated to a new tax credit program administered by the Governor’s Office of Business and Economic Development (GO–Biz). Under this new program, GO–Biz will negotiate agreements with targeted businesses to provide tax credits under certain circumstances. The amount and extent of the tax credits are to be based on criteria specified in state law. Additionally, a business’ receipt of the tax credits is contingent upon its fulfilling predefined employment and compensation targets. A new five–member committee (California Competes Tax Credit Committee) must approve all tax credit agreements. The State Treasurer, DOF, GO–Biz, Senate, and Assembly each appoint one representative to the committee.
Employee Compensation
Increased Employee Compensation Costs. Relative to 2012–13, the budget package provides about $600 million in increased General Fund support for employee compensation. As described below, these increased resources offset state departments’ costs associated with the end of furloughs, pay increases, and health care cost increases.
End of PLP and Furloughs. For 2012–13, all state employees were subject to PLP or furloughs. The two policies are similar—employees receive eight hours of unpaid leave, corresponding with a 4.6 percent reduction in pay. June 2013 was the last month of PLP/furloughs. As a result of these policies ending, departmental General Fund employee compensation costs increase by $370 million in 2013–14.
“Top Step” Pay Increase. Employees at the top step of their pay ranges received a pay increase in July 2013. Depending on their MOU, affected employees received between a 2 percent and 5 percent pay increase—for a total of $221 million increased state General Fund costs.
Rising Health Care Costs. For 14 of the state’s 21 bargaining units and the state’s managerial and supervisorial employees, the state pays a percentage of a weighted average of the premiums for the four state health plans with the largest enrollment, plus a percentage of the average additional premiums to enroll dependent family members. For these employees, the state’s contributions automatically increase to reflect any increases in premium costs. The budget assumes that these General Fund costs will increase by about $20 million in 2013–14. The budget assumes that the state’s contributions toward health premium costs for all other state employees will not increase in 2013–14.
New MOUs Will Increase State Costs Relative to Budget Assumptions. Shortly after the budget was passed, the Legislature ratified new MOUs for 16 bargaining units. Beginning in 2013–14, the new MOUs change the state’s contribution towards health premiums for some employees and their dependents, increase pay for certain classifications, and increase travel reimbursement rates available to employees when they travel on state business. These changes increase state 2013–14 General Fund costs by about $20 million relative to the amounts included in the budget package. The new MOUs also provide pay increases in 2015–16. (Some of the MOUs would provide pay increases in 2014–15 if DOF determines that the state revenues are sufficient.) By 2015–16, these pay changes and other changes will increase ongoing state General Fund costs by about $400 million annually. Three bargaining units have expired MOUs. New MOUs with these other bargaining units could further increase state employee compensation costs beyond what is assumed in the budget and in future years.
21st Century Project
Project Suspended. In February 2013, the California Technology Agency suspended the 21st Century Project, an IT effort by the State Controller’s Office (SCO) to replace the state’s aging payroll systems. The state suspended the project because the initial pilot phase of the project was unable to issue accurate payroll. System errors included under– and over–compensation of wages, failure to issue payments to retirement accounts, and erroneous deductions related to employee insurance. At the same time, SCO terminated its contract with the project’s primary vendor, SAP Public Services Inc. To date, the state has spent over $262 million of the estimated $373 million total project costs.
One–Year Proposal to Reconcile Payroll Errors and Prepare for Litigation. In a May Revision letter submitted to the Legislature, the Governor proposed $14.6 million ($11.9 million General Fund) in 2013–14 to (1) ensure SCO employees and vendors received accurate payments and information during the pilot period, (2) archive the pilot system for record–keeping purposes, and (3) prepare for contractually mandated mediation and potential legal proceedings with SAP. The 2013–14 Budget Act reflects these changes in full, but limits funding for these activities to the first two months of the fiscal year ($2.4 million General Fund), which correspond with a planned legislative oversight hearing. Funding for the remainder of the fiscal year—$12.1 million General Fund—was made available in August after a legislative hearing and upon notification of the Joint Legislative Budget Committee and the appropriations committees in each house.
FI$Cal
Financial Information System for California (FI$Cal). The FI$Cal project seeks to build an integrated financial information system for the state to replace the current systems, which are fragmented and outdated. In his 2012–13 May Revision, the Governor proposed eliminating all General Fund support for FI$Cal in 2012–13, proposing instead to accelerate special fund contributions and defer General Fund expenditures to future project years. The 2012–13 Budget Act reflected the adoption of the Governor’s proposal, providing $89 million (special and other funds) to continue with FI$Cal development. The 2013–14 Budget Act continues to reflect General Fund savings through accelerated special fund contributions for support of FI$Cal. The spending plan includes $84.8 million ($2.1 million General Fund) for the continuation of the design, development, and implementation of FI$Cal.
The FI$Cal project implemented the new financial information system within the first group of departments (what is known as the pre–wave group of departments), as scheduled in July 2013 without incident. The project will continue to implement the system in a growing number of departments through subsequent deployments. The FI$Cal project is estimated to cost $617 million (all funds) and is planned to be fully implemented in July 2016.
Labor Programs
Interest Payment for Federal Unemployment Insurance Loan. California’s Unemployment Insurance (UI) fund has been insolvent since 2009, requiring the state to borrow from the federal government to continue payment of UI benefits. California’s outstanding federal loan is about $10 billion. The state is required to make annual interest payments on this federal loan, and the interest costs are estimated to be $261.5 million (General Fund) in 2013–14.
State Mandates (Non–Education)
Few Mandates Funded. The budget plan provides $48.4 million from the General Fund for 13 mandates primarily related to criminal justice and tax administration. The budget bill suspends 59 non–education mandates, including mandates related to elections, local coastal plans, and animal shelters. When a mandate is suspended, local government compliance with the mandate’s provisions is optional during the budget year.
Backlog Payments Deferred. Similar to state budget actions in recent years, the budget deferred payment for two labor relations mandates: Peace Officer Procedural Bill of Rights and Local Government Employment Relations. The budget also deferred making payments towards retiring the state’s accumulated non–education mandate debt (owed primarily to counties). This debt consists of approximately:
- $1.1 billion for claims submitted by local governments in or after 2004. Almost all of these claims are for mandates that the state has subsequently suspended, repealed, or substantially revised. State law does not specify a payment plan for retiring these mandate obligations.
- $800 million for claims submitted before 2004. State law specifies a 15–year payment plan for these mandates, but the state has not made a payment on this plan since 2006–07.
Four Mandates Eliminated. Budget trailer legislation (Chapter 28, Statutes of 2013 [SB 71, Committee on Budget and Fiscal Review], as modified by Chapter 161, Statutes of 2013 [AB 81, Committee on Budget and Fiscal Review]) modifies state statutes to prospectively eliminate four mandates that have been suspended annually for two decades. These state mandates were recast as recommended “best practices” for local governments.
Two Open Government Measures Included in Proposed Constitutional Amendment. The California Public Records Act and Open Meetings Act were included in a legislative constitutional amendment. If approved by the state’s voters in the June 2014 primary election, Senate Constitutional Amendment 3 would eliminate the state’s obligation to reimburse local governments for their future costs to implement the California Public Records Act. (The state’s obligation to reimburse local governments for their future costs to implement the Open Meetings Act was eliminated under Proposition 30 of 2012.) In 2013–14, the budget package specifies that these measures’ requirements are:
- California Public Records Act—in effect for all local governments, including schools and community college districts.
- Open Meetings Act—in effect for schools and community college districts, but suspended for cities, counties, and special districts.
California Public Utilities Commission
The budget provides a total of $1.3 billion to the CPUC, an increase of $60 million, or roughly 5 percent, from the revised 2012–13 level. This amount reflects an increase in programmatic spending in Universal Lifeline and Deaf and Disabled Teleconnect programs. Budget–related legislation adopts a series of changes to increase transparency and oversight of the CPUC’s regulatory activities. In addition, the Legislature approved supplemental report language requiring the CPUC to provide a report regarding each pending administrative or judicial action involving claims arising from the energy crisis of 2000–02 in which the commission is a party. The Legislature also requested that the California State Auditor audit the CPUC’s books and records to ensure appropriate accounting processes are being used.
Seismic Safety Commission
Budget legislation establishes a $0.15 annual assessment on the owners of each commercial and residential property insured by a property insurance policy. The funds raised from the assessment will be deposited into a special account within the Insurance Fund and used to pay the ongoing operating costs of the Seismic Safety Commission.