The sales and use tax is the state’s second largest revenue source as well as a major funding source for cities, counties, and some special districts. Broadly speaking, the amount of sales taxes generated each year depends on two factors: (1) growth in the tax base or taxable sales, the total amount of money spent on taxable items in California, and (2) the sales tax rate. Historically, growth in taxable sales kept pace with growth in the state’s economy, meaning that sales taxes generally grew along with the economy when the tax rate was kept constant (and increased when the tax rate was increased).
Starting in 1980, however, California consumers began to spend a smaller share of their income on taxable goods and a larger share on nontaxable items, especially services such as healthcare and housing. Although total consumer spending kept pace with the state’s economy, this shift in spending caused growth in taxable sales to lag behind growth in the state’s economy each year.
Figure 1 highlights the key growth rates discussed in this brief: taxable sales, state and local sales tax revenue, and personal income. (Growth in personal income, the total income earned by businesses and individuals in California, is a standard measure of economic growth.) As shown in the figure, sales tax revenues have outpaced taxable sales since 1980 because the tax rate was increased during this time. Due to the shift in consumer spending from taxable goods toward services, however, neither taxable sales nor sales tax revenue have kept pace with growth in the state’s economy.
This brief begins with a background on the sales tax and consumer spending and then examines:
- Why are consumers spending a growing share of their income on services and a declining share on taxable items?
- How has this shift affected sales tax revenue for the state and local governments?
- Will this trend continue?
How Much Revenue Does the Sales and Use Tax Raise?
California’s sales tax raised about $43 billion in 2011–12. Approximately $20 billion was allocated to the state General Fund. The rest (about $23 billion) was distributed to counties, cities, and some special districts and used for a variety of purposes. The statewide base sales tax rate is 7.5 percent. With voter approval, however, local governments may increase (by up to 2.5 percentage points) the local tax rate to generate additional local sales tax revenue. Accounting for locally approved rate increases, the average sales tax rate in California is 8.4 percent.
What Is Taxable?
The sales tax applies to the retail purchase of most tangible goods. Some tangible goods, such as groceries and medicine, are considered necessities and are exempt. Intangible goods are primarily services—such as healthcare, education, financial planning, and auto repair—and are not subject to the tax. In most cases, businesses do not pay sales taxes when they purchase raw or intermediate goods that are used to construct a final product. (This is to prevent the sales tax from being collected multiple times on the same good. For example, a cabinetry business does not pay sales tax on the lumber or hardware used to build its products, nor do stores pay the tax when they purchase goods for resale.)
A taxable sale is a purchase that is subject to the sales tax. The total value of all of these purchases in California each year is taxable sales. California taxable sales were $558 billion in 2012. Figure 2 shows that California’s taxable sales increased moderately in most years since 1970 and at an average rate of 4.4 percent beginning in 1980.
How Do California Households Spend Their Money?
As shown in Figure 3, Californians spend their money on various types of goods and services. (Most also save a portion of their income.) Each type of spending—on housing, transportation, education, and so on—represents a percentage of a household’s total spending. Spending on transportation, for instance, accounts for about 15 percent of the average household’s total spending.
Consumer Spending Has Shifted Away From Taxable Items and Toward Nontaxable Ones. Consumers today spend a greater share of their income on services like housing and healthcare than they did in the past. Commensurately, spending on clothing, electronics, household items, and other taxable goods makes up a smaller share of consumer spending than it once did. As consumer spending shifted from taxed goods to untaxed services, the share of purchases subject to the sales tax declined. Increased online purchases, many of which go untaxed, also contributed to this decline.
The Sales Tax Base Has Contracted Relative to the Size of the Economy. Over time, the share of consumer income spent on taxable items has declined, causing taxable sales to grow less quickly than the state economy. Beginning in 1980, taxable sales have grown about 1.4 percentage points slower, on average, than the state’s economy. As shown in Figure 4, taxable sales as a share of personal income (a ratio used to track the size of the sales tax base relative to the economy), declined from a peak of 53 percent in 1979 to 33 percent in 2012.
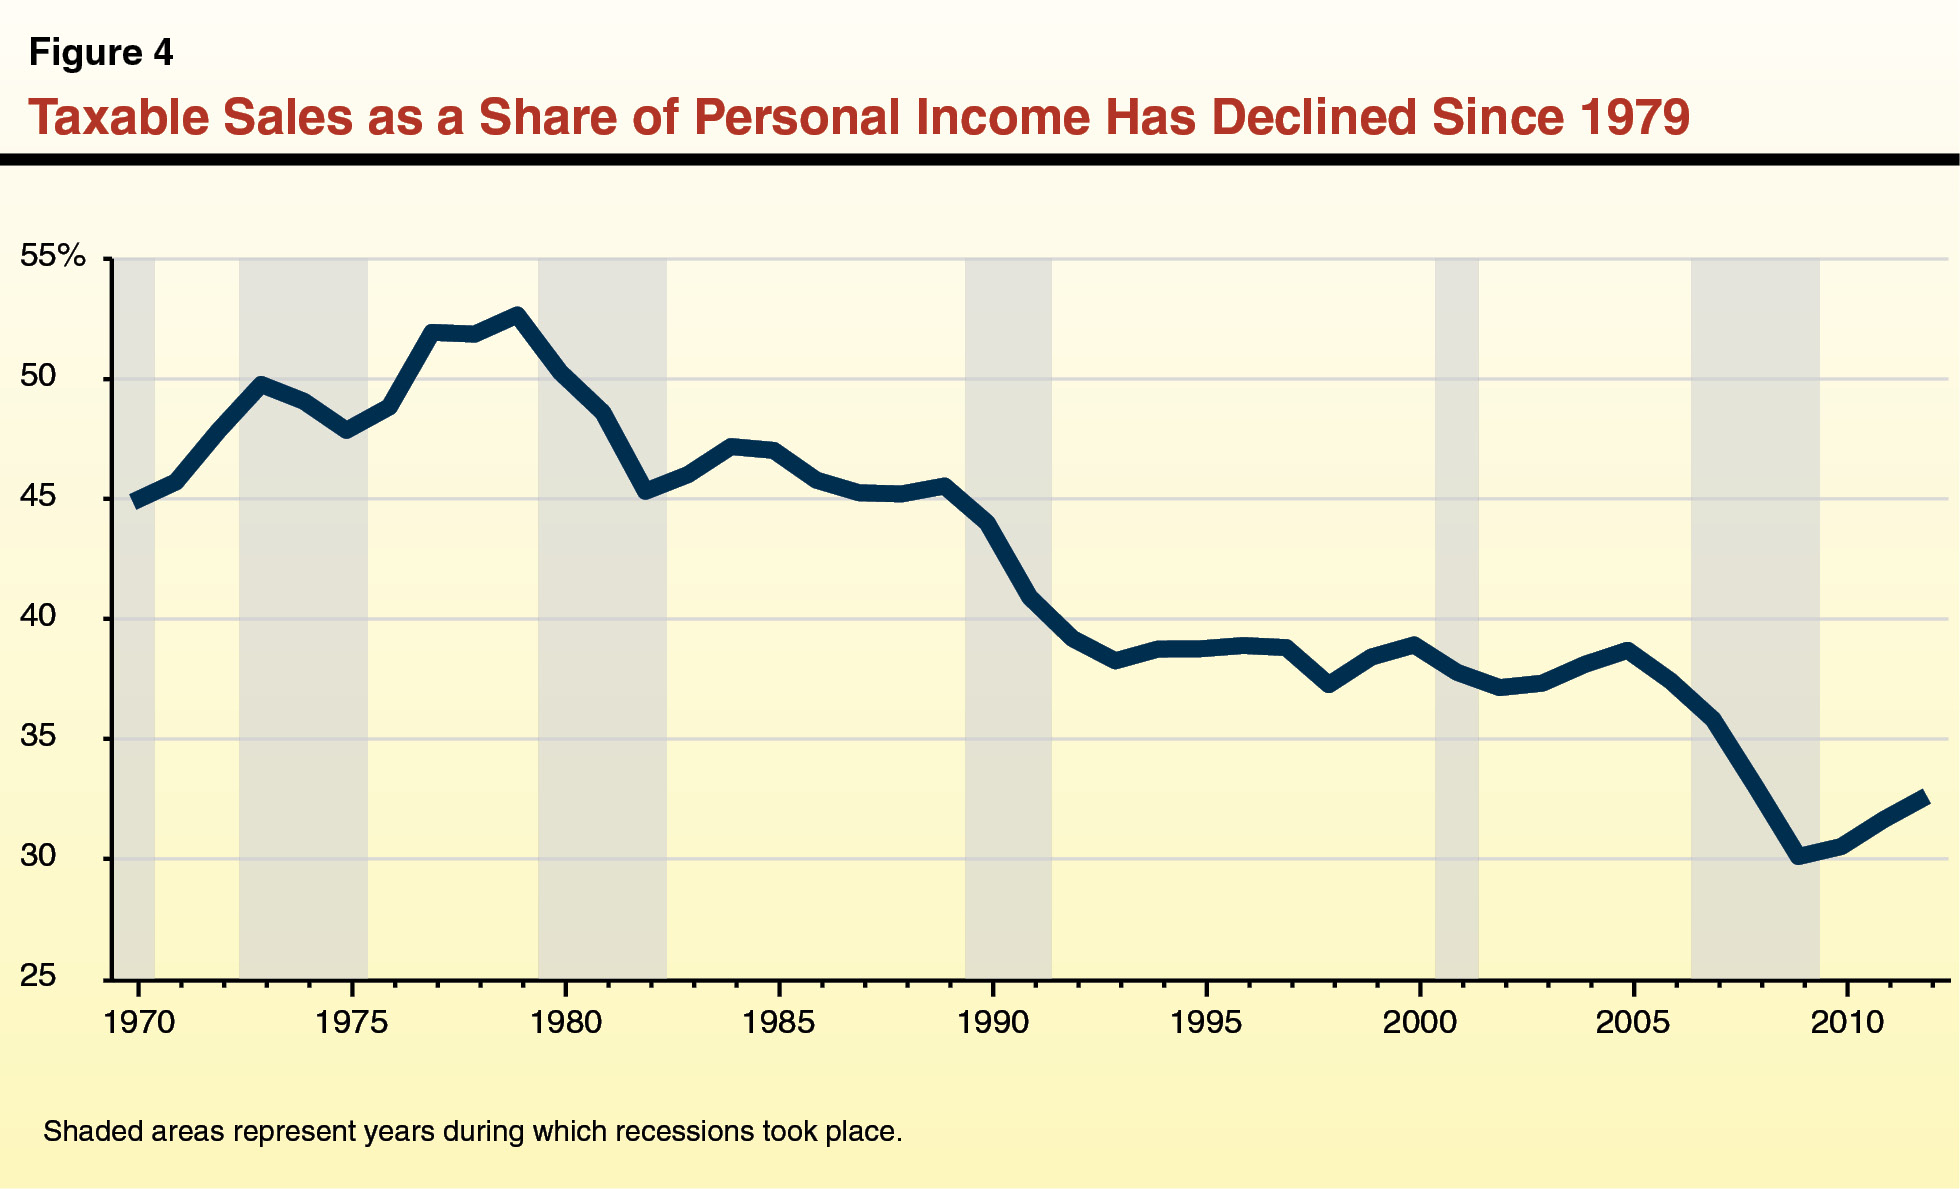
Spending on taxable items has grown slower than the economy in recent years primarily because taxable items have become less expensive relative to nontaxable items. Consumers are therefore able to buy the same amount of taxable goods with a smaller share of their income, resulting in “savings” that can be spent elsewhere. While consumers have used some of these savings to purchase more taxable goods, much of these savings have been used to pay for nontaxable items because these purchases have become relatively more expensive. Consumers therefore spend a larger share of their income on untaxed items and a correspondingly smaller share on taxable items. Overall, the vast majority of the 20 percentage point decline in Figure 4 has occurred because taxable items have become relatively cheaper while nontaxable items have become relatively more expensive. The rest of this decline, less than 5 percentage points, has occurred because Californians are purchasing relatively more untaxed goods and services than they used to.
Prices for different types of goods and services increase (or decrease) at different rates. (The average overall rate of change in prices from one year to the next is the inflation rate.) Since 1980, prices of services, which represent the bulk of nontaxable purchases, have increased much faster than prices for taxable goods. Below, we discuss the forces underlying these trends.
Prices of Taxable Goods Have Increased Slowly
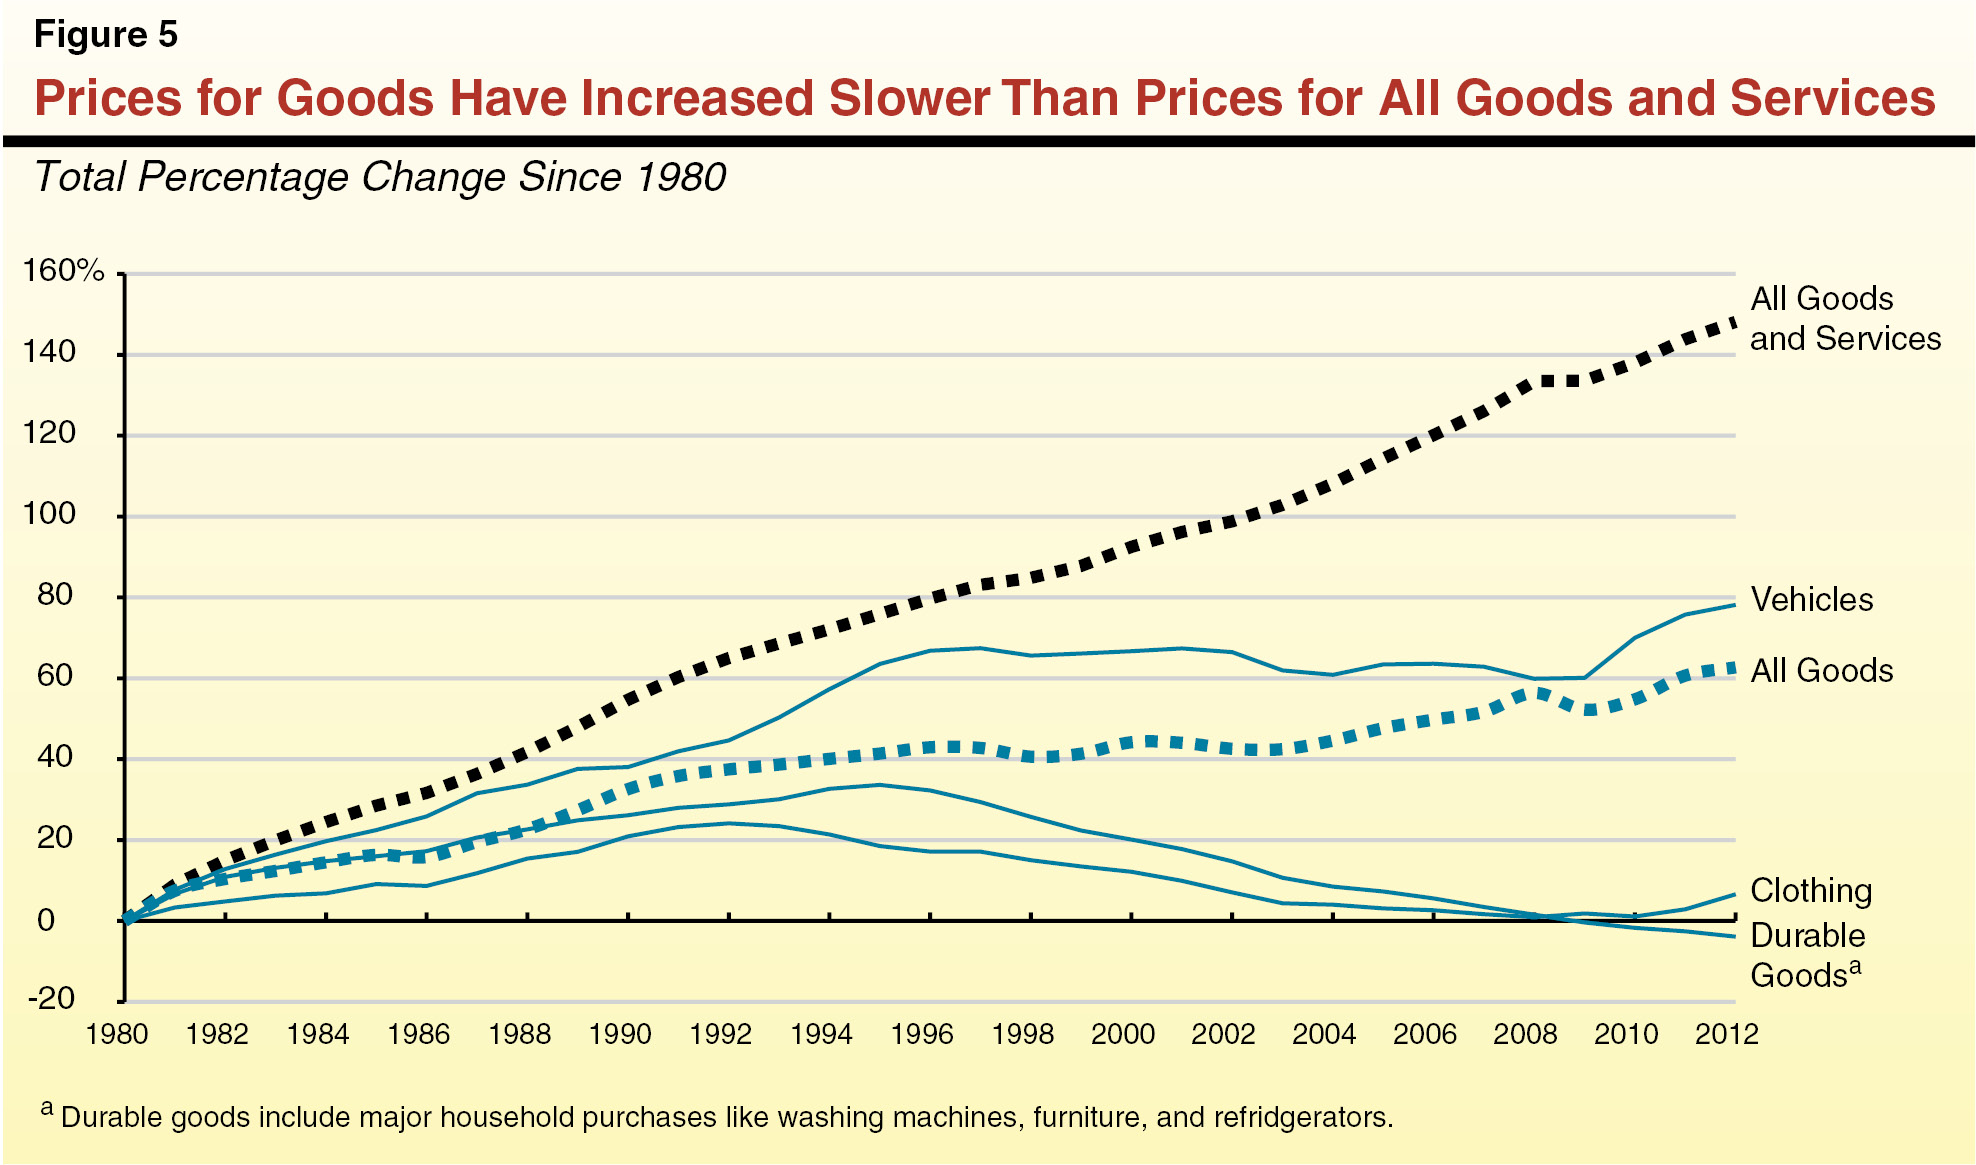
The price of a particular item can increase from one year to the next for many reasons, including higher labor costs, more expensive raw materials, or costlier transportation. Inflation occurs, in part, because higher prices are needed to compensate for higher production costs—whether labor, materials, transportation, or other business inputs. In general, the upward pressure on prices from these factors has been particularly mild for tangible goods, most of which are subject to the state’s sales tax. Though prices for goods have increased over time, they have done so much less rapidly than inflation, the average price change for all goods and services. Figure 5 shows how prices for different types of goods have increased since 1980. As shown in the figure, prices for some goods have grown very little. For example, clothing prices increased just 7 percent since 1980, and the prices of durable goods have actually declined slightly. While overall inflation increased about 150 percent during this time, the increase for all goods was only about 60 percent. The line “all goods” is a federal measurement of price changes for all tangible goods. The list of goods included in this line is almost identical to the list of goods that are taxed in California. Due to this similarity, we use this data to measure how the average prices of taxable goods have changed over time. Below, we describe in detail the two main economic causes of this trend: (1) increases in manufacturing productivity and (2) expanded international trade.
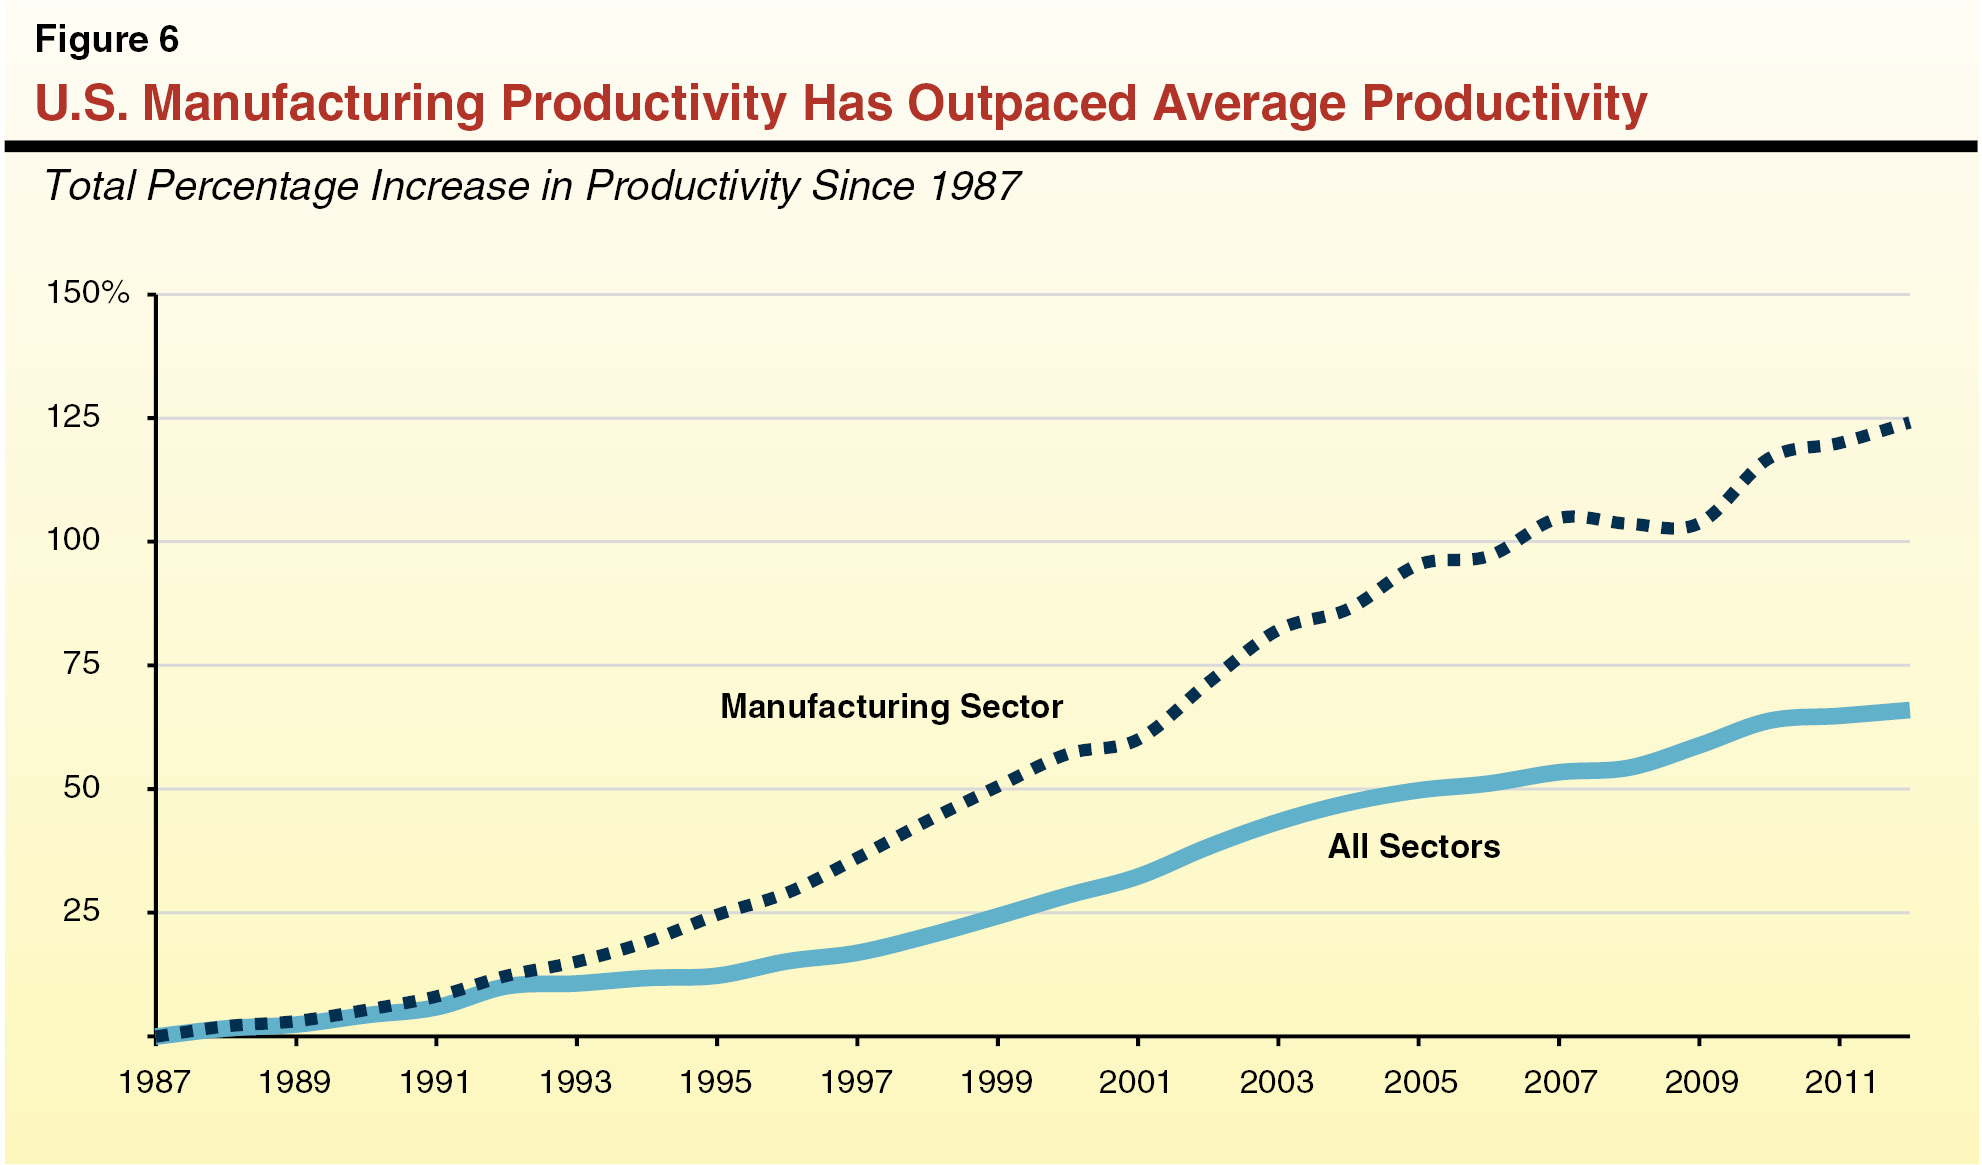
Manufacturing Productivity Has Outpaced Average Productivity. Manufacturing productivity has increased more rapidly in recent years than productivity in other sectors, as shown in Figure 6. Manufacturing improvements, led by technological developments and automation, have reduced the amount of time and number of people it takes to make physical goods. These advances allow businesses to produce goods more cheaply. This has helped keep price pressure on physical goods, most of which are taxable, at a low level.
Increased Imports of Low–Cost Manufactured Goods. International trade expanded significantly during the past half–century, as developing countries established manufacturing sectors, global shipping became more efficient, and U.S. trade restrictions—tariffs, quotas, and embargoes—were reduced. Correspondingly, the majority of goods purchased in California today are manufactured elsewhere. (Imports consist predominately of tangible goods, most of which are subject to the state’s sales tax.)
This trade expansion has been due primarily to lower production costs in developing economies. Relatively inexpensive labor, energy, regulatory, and facilities costs allow firms to produce goods at lower costs. These goods are then imported to the U.S. and sold at relatively lower prices. The influx of low–price goods from developing countries helps to keep prices for these goods from rising quickly. This influx also forces domestic producers to cut production costs, and thereby prices, resulting in further downward pressure on goods prices.
Prices of Nontaxable Items Have Increased Quickly
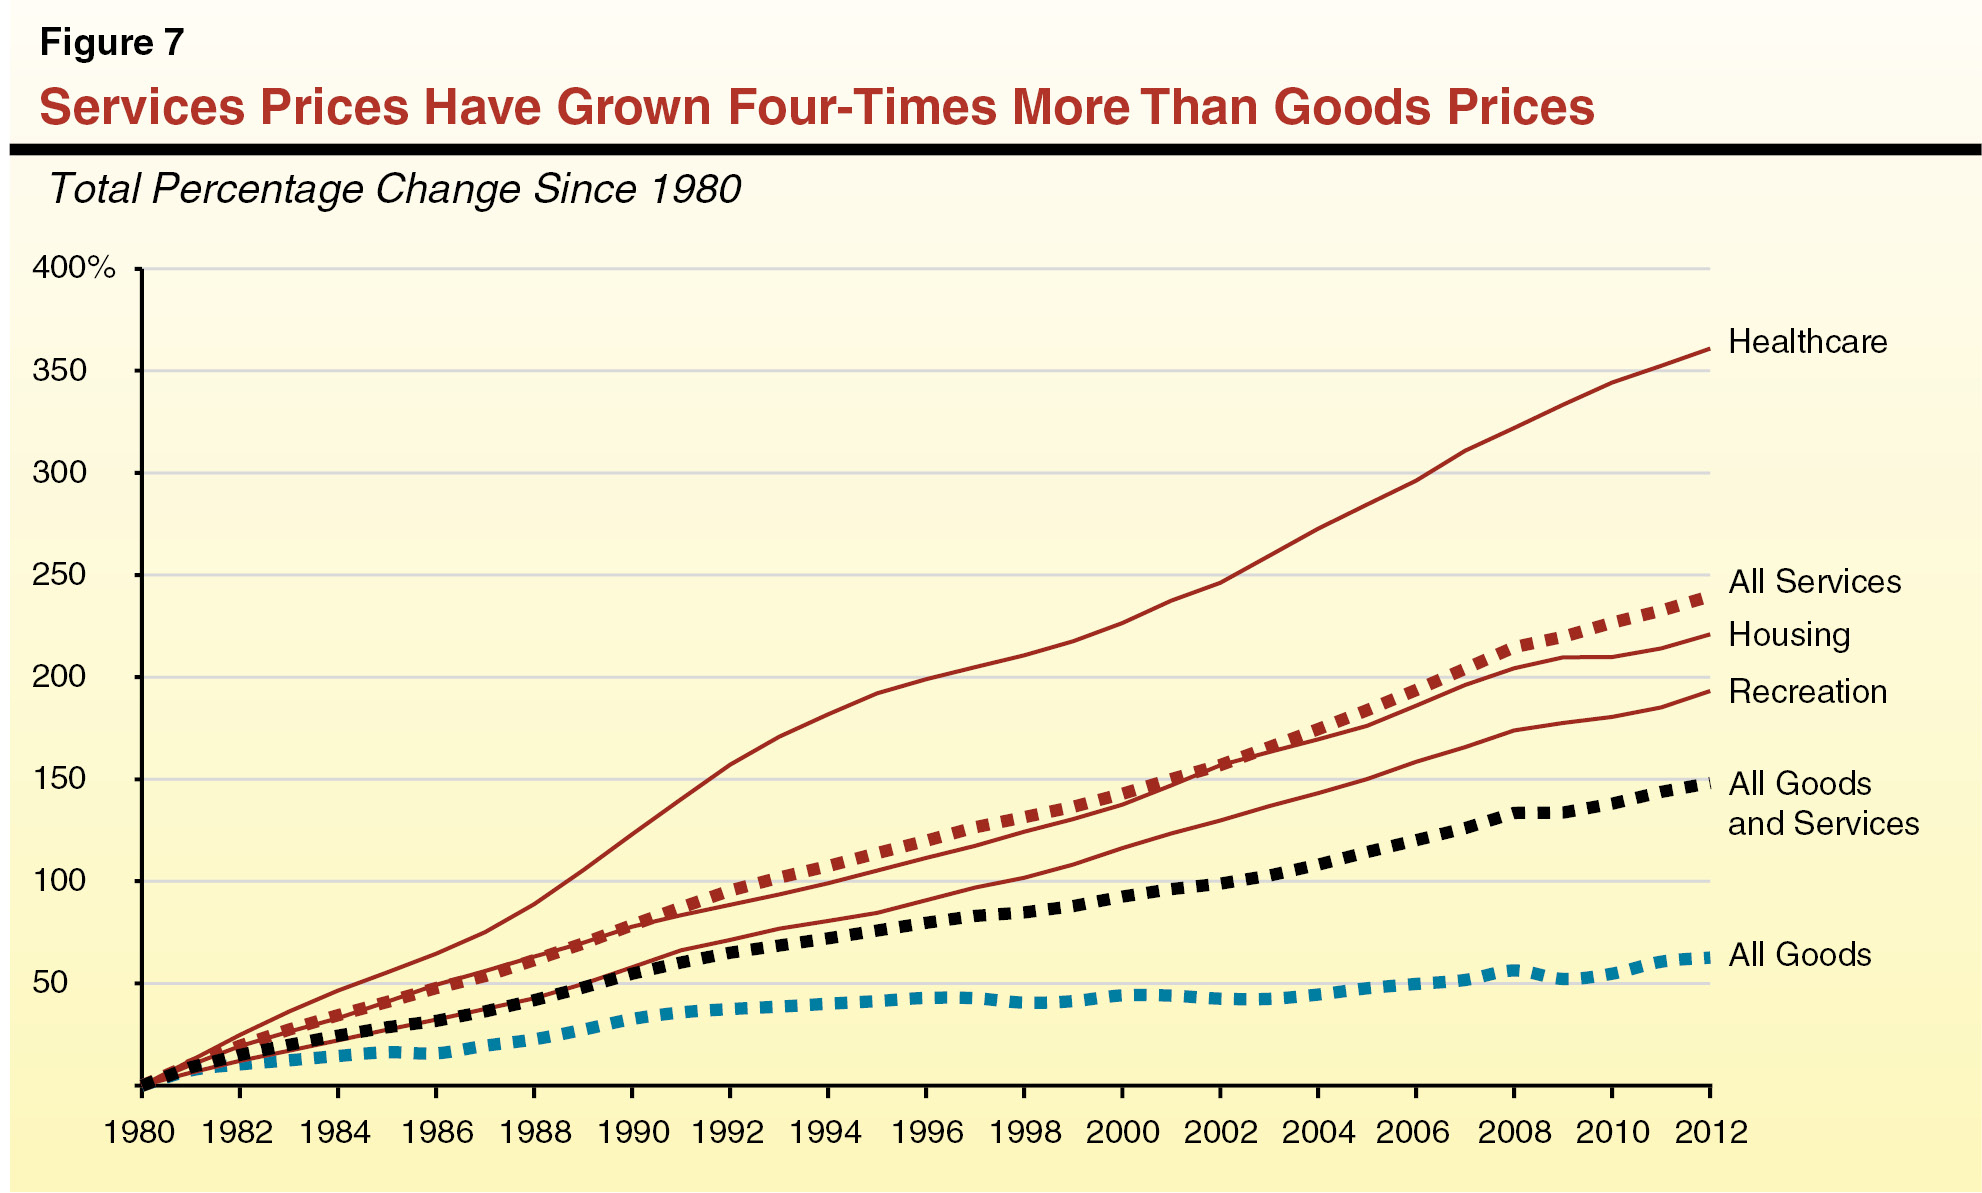
The prices of nontaxable items—especially services such as education, healthcare, legal and financial advising, and auto repairs—have increased faster than prices for all goods and services. In addition, between 1980 and 2012, service prices grew annually about 2.5 times faster than prices for goods. As a result, service prices have increased four–times more than goods prices over this period, as shown in Figure 7. Whereas productivity gains and low–cost imports put downward pressure on goods prices, similar downward pressures on service prices have not materialized. Several unique characteristics have led service prices to increase rapidly over time, including:
- Proximity. Services typically are purchased within close proximity to the buyer. This occurs because most services either improve physical property owned by the buyer (car maintenance, landscaping, or dry cleaning) or rely on frequent in–person communication (financial, legal, and business advising, for example). Californians therefore import relatively few services, meaning low–cost imports have not put downward pressure on service prices.
- Customization. Many services are designed for a particular customer under unique circumstances. Legal or accounting services purchased by a corporation that is acquiring a smaller firm, for example, are unique to the business structure and acquisition strategy of that corporation. These types of services are not easily automated and therefore benefit less from the technological advances that have increased manufacturing productivity.
- Labor Intensive. Unlike goods, the prices of which are determined largely by nonlabor production costs, the costs of most services are based primarily on the labor used to provide the service. For example, a car owner who takes his or her car to a nearby mechanic purchases the experience, training, and time needed to repair the vehicle. Industries that are labor intensive, including most service industries, benefit less from productivity gains because training and expertise are difficult qualities to automate.
Demand for Services Has Increased, Despite Rapid Price Increases. Consumer demand for services has grown steadily over the past several decades. When consumer demand increases—in this case, for nontaxable services—the price of the product in demand typically increases. Under normal circumstances, these price increases temper demand somewhat. With services, however, consumer demand has grown despite consistent price increases. This has occurred because cheaper goods prices have freed up some consumer income, much of which has been spent on services. In addition, various factors have otherwise increased demand for services in recent years even as consumers face higher prices.
- First, a growing share of Californians, those in the “baby boomer” generation, are entering retirement. In general, older consumers use more healthcare services than younger consumers do. As a result, consumption of healthcare services (and therefore its demand) tends to increase as a growing share of the population enters retirement.
- Second, as people’s incomes increase, they tend to spend a larger share of their income on discretionary services—such as leisure, recreation, and entertainment. California real per capita income has increased about 50 percent since 1980—from $25,600 to $39,000—likely increasing demand for untaxed discretionary purchases.
- Finally, numerous state and federal policies lower the cost of certain services, causing consumers to purchase more of those services than they otherwise would. For example, the mortgage interest deduction, by which homeowners reduce their taxable income by the amount paid in mortgage interest, reduces the “price” of homeownership (a form of housing service). In addition, employer–provided health benefits encourage employees to consume more healthcare services than they otherwise would (because employee compensation in the form of health insurance is untaxed, whereas other compensation is subject to income and payroll taxes). Regarding higher education, merit and need–based scholarships, as well as various preferential tax treatments, reduce tuition prices consumers face and the cost of borrowing. Together, these trends and policies have helped boost consumer demand for services, despite rapidly increasing prices.
Since 1980, consumer spending in California has shifted strongly toward nontaxed services and away from taxed goods, primarily because services have become relatively more expensive while goods have become relatively cheaper. As a result, sales tax revenues grew annually about 0.6 percentage points slower than the state’s economy between 1980 and today, despite periodic increases in the state and local sales tax rates during this time. Had spending on taxable items kept pace with the state’s economy since 1980, the sales tax would generate the same amount of revenue for state and local governments as it does today at a much lower rate—5.2 percent instead of the current rate, 8.4 percent. Alternatively, if the current rate remained unchanged, the sales tax would generate 61 percent more revenue than it does today.
The economic forces underlying rapid service price increases and slower goods price increases—namely manufacturing productivity gains, international trade expansion, and the labor–intensive nature of services—appear unlikely to change, at least in the near future. In general, we expect increases in service prices will continue to outpace increases in goods prices, as shown in Figure 8, over the next ten years. Taxable sales are therefore likely to make up a declining portion of the state’s economy over the next decade. Absent further increases in the sales tax rate or expansion of its base, sales tax revenue for the state and local governments are likely to grow slower than the economy for at least the near future.