The primary goal of California’s criminal justice system is to provide public safety by deterring and preventing crime, punishing individuals who commit crime, and reintegrating criminals back into the community. The state’s major criminal justice programs include the court system, the CDCR, and the Department of Justice. The Governor’s budget proposes total expenditures of $14.1 billion for judicial and criminal justice programs. Below, we describe recent trends in state spending on criminal justice and provide an overview of the major changes in the Governor’s proposed budget for criminal justice programs in 2014–15.
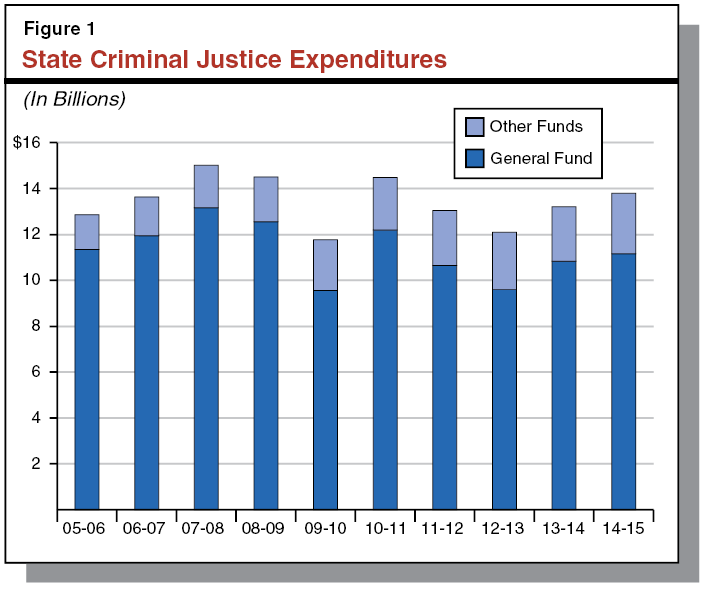
Over the past decade, total state spending on criminal justice programs has varied. In particular, criminal justice spending declined in recent years but increased in 2013–14 and is proposed to further increase in 2014–15 under the Governor’s budget. As shown in Figure 1, state spending on criminal justice peaked in 2007–08 at about $15 billion. In comparison, state spending on criminal justice was about $12 million in 2012–13, reflecting a continued decline since 2010–11. As we discuss below, much of this decline was related to reduced expenditures on the state’s judicial branch and correctional system.
Decline in Corrections Spending. The primary reason for the decline in spending on corrections over this time period is the impact of various policy changes enacted to reduce the state’s prison population. The state took these actions to help reduce state spending and comply with a federal court order to reduce prison overcrowding, as well as to achieve improved criminal justice outcomes. Some of the actions taken include (1) providing counties a fiscal incentive to reduce the number of felony probationers that fail on probation and are sent to state prison, (2) increasing the number of credits inmates can earn to accelerate their release date from prison, (3) making certain parolees who violate a term of their parole ineligible for return to prison, and (4) increasing the dollar threshold for certain property crimes to be considered a felony, thus making fewer offenders eligible for prison. The most significant of these changes, however, happened with the passage of the 2011 realignment which, among other changes, shifted various criminal justice responsibilities from the state to counties. In particular, the 2011 realignment made felons generally ineligible for state prison unless they had a current or prior conviction for a serious, violent, or sex–related offense. By the end of 2012–13, realignment had reduced the prison population by tens of thousands of inmates.
Decline in Judicial Branch Spending. The state’s recent fiscal crisis also resulted in significant General Fund reductions to the judicial branch, particularly the trial courts. The judicial branch has received a series of one–time and ongoing General Fund reductions since 2008–09. By 2012–13, the branch had received ongoing General Fund reductions totaling $778 million. Of this amount, $724 million in reductions were allocated to the trial courts. However, various one–time and ongoing solutions were used to offset most of the reductions to the trial courts. As we discuss later in this report, despite these offsets, the trial courts had to take various actions to absorb some reductions, which impacted court services differently across courts.
Figure 2 summarizes expenditures from all fund sources for criminal justice programs in 2012–13 and as revised and proposed by the Governor for 2013–14 and 2014–15. As shown in the figure, total spending on criminal justice programs is proposed to increase from an estimated $13.6 billion in the current year to $14.1 billion in the budget year. This is an increase of 4 percent. General Fund spending is proposed to increase 3.2 percent over current–year expenditure levels.
Figure 2
Judicial and Criminal Justice Budget Summary
(Dollars in Millions)
|
|
Actual
2012–13
|
Estimated
2013–14
|
Proposed
2014–15
|
Change From 2013–14
|
|
Actual
|
Percent
|
|
CDCR
|
$8,742
|
$9,441
|
$9,833
|
$391
|
4.1%
|
|
General Funda
|
8,551
|
9,281
|
9,513
|
232
|
2.5
|
|
Special and other funds
|
191
|
160
|
320
|
160
|
99.7
|
|
Judicial Branch
|
$2,825
|
$3,117
|
$3,274
|
$157
|
5.0%
|
|
General Fund
|
748
|
1,220
|
1,325
|
105
|
8.6
|
|
Special and other funds
|
2,077
|
1,897
|
1,949
|
52
|
2.7
|
|
Department of Justice
|
$660
|
$769
|
$771
|
$2
|
0.2%
|
|
General Fund
|
154
|
178
|
194
|
17
|
9.3
|
|
Special and other funds
|
507
|
591
|
577
|
–15
|
–2.5
|
|
BSCC
|
$95
|
$129
|
$134
|
$5
|
3.8%
|
|
General Fund
|
40
|
44
|
45
|
1
|
1.2
|
|
Special and other funds
|
55
|
85
|
89
|
4
|
5.2
|
|
Other Departmentsb
|
$138
|
$125
|
$114
|
–$12
|
–9.3%
|
|
General Fund
|
82
|
64
|
58
|
–6
|
–9.8
|
|
Special and other funds
|
56
|
61
|
56
|
–5
|
–8.9
|
|
Totals, All Departments
|
$12,460
|
$13,582
|
$14,125
|
$543
|
4.0%
|
|
General Fund
|
9,574
|
10,787
|
11,135
|
348
|
3.2
|
|
Special and other funds
|
2,886
|
2,795
|
2,990
|
196
|
7.0
|
Major Budget Proposals. Most of the proposed increase in spending is for CDCR and the judicial branch. For example, increased funding of $261 million is provided to CDCR to help meet the population cap ordered by the federal courts. The Governor’s budget also provides increased funding to CDCR for additional costs related to worker’s compensation, and employee salary and training. In addition, the proposed budget includes a $105 million General Fund augmentation for the judicial branch—$100 million to support trial court operations and $5 million to support state level court and Judicial Council operations.
Realignment Funding. As mentioned above, the 2011 realignment shifted several criminal justice programs from state to county responsibility. Along with the shift of these programs, state law shifted a share of the state sales tax, as well as Vehicle License Fee revenue, to local governments. The passage of Proposition 30 by voters in November 2012, among other changes, permanently guaranteed these revenues to local governments. The Governor’s budget includes an estimate of revenues projected to go to local governments over the next few years. These estimates are generally in line with prior estimates. As shown in Figure 3, total funding for the criminal justice programs realigned is expected to increase from $2.1 billion in 2012–13 to $2.3 billion in 2014–15.
Figure 3
Estimated Revenues to Counties for 2011 Realignment of Criminal Justice Programs
(In Millions)
|
|
2012–13
|
2013–14
|
2014–15
|
|
Community corrections
|
$930
|
$1,063
|
$1,094
|
|
Trial court security
|
508
|
517
|
538
|
|
Law enforcement grants
|
490
|
490
|
497
|
|
Juvenile justice grants
|
110
|
119
|
140
|
|
District attorneys and public defenders
|
20
|
21
|
27
|
|
Totals
|
$2,058
|
$2,210
|
$2,296
|
In addition to the funds provided to counties directly through the 2011 realignment legislation, the state has also authorized lease–revenue bonds to fund the construction and modernization of county jails following the realignment. Specifically, Chapter 42, Statutes of 2012 (SB 1022, Committee on Budget and Fiscal Review), authorized $500 million to help counties construct and modify jails to accommodate longer–term inmates who have been shifted to county responsibility. The Governor’s budget for 2014–15 proposes that an additional $500 million in lease–revenue bonds be authorized to support the construction of county facilities.
The judicial branch is responsible for the interpretation of law, the protection of an individual’s rights, the orderly settlement of all legal disputes, and the adjudication of accusations of legal violations. The branch consists of statewide courts (the Supreme Court and Courts of Appeal), trial courts in each of the state’s 58 counties, and statewide entities of the branch (the Judicial Council, Judicial Branch Facility Program, and the Habeas Corpus Resource Center). The branch receives revenues from several funding sources including the state General Fund, civil filing fees, criminal penalties and fines, county maintenance–of–effort payments, and federal grants.
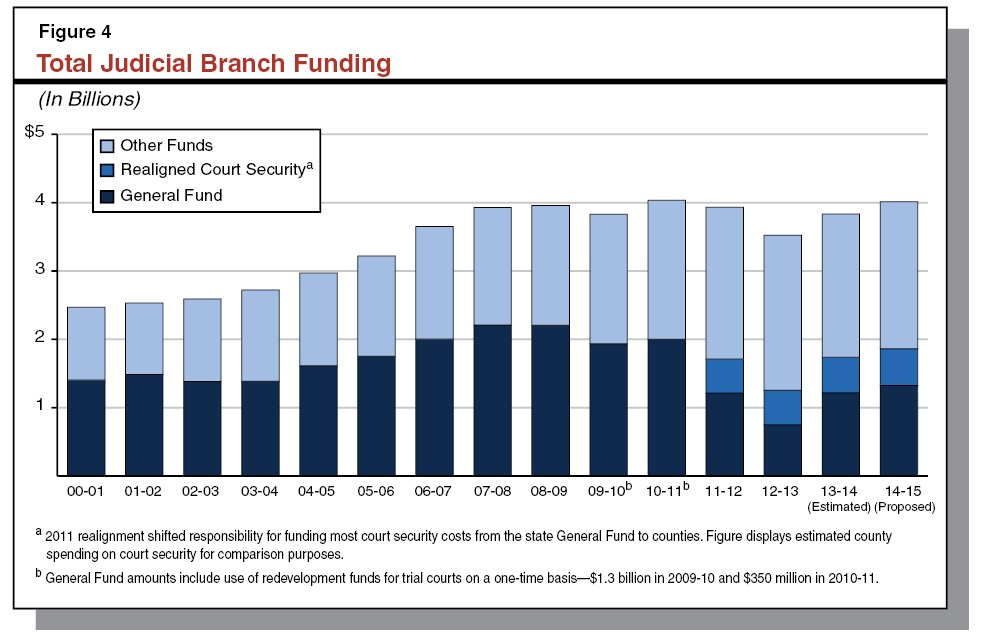
Figure 4 shows total funding for the judicial branch from 2000–01 through 2014–15. As shown in the figure, funding for the branch peaked in 2010–11 at roughly $4 billion and then subsequently declined through 2012–13. This decline is primarily due to significant reductions in the level of General Fund support provided to the branch during this time period. We note, however, that total funding for the judicial branch increased in 2013–14 and is proposed to increase in 2014–15 under the Governor’s budget. Specifically, the 2013–14 Budget Act included a $63 million General Fund augmentation for the judicial branch and the Governor’s budget for 2014–15 proposes an additional $105 million General Fund augmentation. Under the Governor’s budget, the General Fund share of the total judicial branch budget will be 33 percent in 2014–15.
As shown in Figure 5, the Governor’s budget proposes $3.3 billion from all state funds to support the judicial branch in 2014–15, an increase of $157 million, or 5 percent, above the revised amount for 2013–14. (These totals do not include expenditures from local revenues or trial court reserves.) Of the total budget proposed for the judicial branch in 2014–15, roughly $1.3 billion is from the General Fund. This is a net increase of about $105 million, or 8.6 percent, from the 2013–14 level.
Figure 5
Judicial Branch Budget Summary—All State Funds
(Dollars in Millions)
|
|
2012–13
Actual
|
2013–14
Estimated
|
2014–15
Proposed
|
Change From 2013–14
|
|
Amount
|
Percent
|
|
State Trial Courts
|
$2,237
|
$2,443
|
$2,531
|
$88
|
3.6%
|
|
Supreme Court
|
43
|
44
|
45
|
1
|
1.5
|
|
Courts of Appeal
|
202
|
208
|
211
|
3
|
1.6
|
|
Judicial Council
|
135
|
142
|
141
|
–1
|
–0.4
|
|
Judicial Branch Facility Program
|
195
|
267
|
332
|
65
|
24.3
|
|
Habeas Corpus Resource Center
|
13
|
14
|
14
|
—
|
1.4
|
|
Totals
|
$2,825
|
$3,117
|
$3,274
|
$157
|
5.0%
|
Prior–Year Budget Reductions and Offsets. The judicial branch received a series of one–time and ongoing General Fund reductions from 2008–09 through 2012–13. By 2012–13, the branch had received ongoing General Fund reductions totaling $778 million. Of this amount, $724 million in ongoing General Fund reductions were allocated to the trial courts. However, the 2013–14 budget provided a $60 million General Fund augmentation to the trial courts to help offset these reductions. Specifically, the augmentation reduced the total ongoing General Fund reductions to the trial courts to $664 million in 2013–14.
Additionally, since 2008–09, the Legislature and Judicial Council (the policymaking and governing body of the judicial branch) used various one–time and ongoing solutions to offset most of the reductions to the trial courts. Such solutions included using revenues from increased fines and fees, transfers from judicial branch special funds, and trial court reserves. (Reserves are the accumulation of unspent funds from prior years that are carried over and kept by each trial court.)
Despite most of the reductions being offset, the trial courts still had to absorb $215 million in General Fund reductions in 2013–14. (We would note that some courts may have used one–time resources to absorb their share of this reduction in 2013–14. Such courts will have to absorb these reductions again in 2014–15. In contrast, other courts may have absorbed more than their share of the reduction in 2013–14 in order to plan ahead for additional ongoing reductions the following year.) Trial courts have taken various actions to accommodate these reductions. These actions include leaving staff vacancies unfilled, renegotiating contracts with employees and vendors, delaying purchases, closing courtrooms or courthouses, reducing clerk office hours, and reducing self–help and family law services. While the impacts of these actions vary across courts and depend on the specific operational choices made by each court, some of these actions have resulted in reduced access to court services, longer wait times for court services and hearings, and courts being unable to complete workload in a timely manner.
In order to help minimize the extent to which these operational actions affected court users, a number of courts also made various changes to their operations. These changes include installing dropboxes for individuals to submit court paperwork when clerks’ offices are closed and purchasing kiosks where individuals can pay for traffic tickets. In addition, some courts have made multiyear investments to operate more efficiently. For example, some courts have shifted to electronic filing of documents in certain case types and developed online systems where individuals can automatically schedule hearings for select case types.
New Funding Allocation Methodology. In April 2013, the Judicial Council approved a new method for allocating funds appropriated for trial court operations in the annual state budget to individual trial courts. This new methodology, also known as the Workload Allocation Funding Methodology (WAFM), is intended to distribute funding among the trial courts based on workload. (Previously, such funding was allocated on a “pro rata” basis, generally based on the historic share of statewide allocations received by each trial court.) Specifically, the new formula starts with a Resource Assessment Study (RAS), which estimates the number of personnel needed for each court primarily based on the number of filings for various case types and the amount of time it takes staff to process each filing. Each court’s estimated staffing need is then converted to a cost estimate for personnel and combined with various other cost factors not captured in the RAS model (such as workload costs and other factors considered unique to a specific trial court) to determine the total estimated workload–driven costs for each trial court. The total cost for each court is then used to determine that court’s percentage of total trial court operations costs. These percentages are then applied to the funding appropriated to the trial courts in the state budget to determine how much funding each individual trial court will receive that year.
Beginning in 2013–14, the judicial branch implemented a five–year plan to phase in the implementation of its new allocation methodology. Under the plan, a greater percentage of funds appropriated for trial court operations will be allocated using WAFM each year with a lesser amount being allocated under the old methodology. Upon full implementation, 50 percent of trial court operations funding will be allocated using WAFM, and 50 percent will be allocated using the old pro rata percentages. However, the branch intends to allocate any augmentations provided to trial court operations (such as the $60 million General Fund augmentation provided in the 2013–14 budget) based on the WAFM model, unless the funding is provided for a specified purpose (such as for court interpreters for example). To the extent such additional funding is provided, the branch will shift an equivalent amount of funding from the amount allocated based on the old methodology to the amount allocated based on WAFM (referred to as the “dollar–for–dollar match”), thereby reducing the amount allocated using the old method and increasing the amount allocated by WAFM. Therefore, under the branch’s plan, additional funding will result in a greater share of trial court funding allocated using WAFM. The judicial branch reports that it would take a cumulative $700 million augmentation for all trial court operations funding to be allocated under WAFM.
The Governor’s budget for 2014–15 proposes an ongoing General Fund augmentation of $100 million to support trial court operations. (The budget also provides a $5 million augmentation to support state level courts and Judicial Council operations.) The budget requires that the additional funding be allocated based on WAFM. However, the trial courts would have flexibility in spending these funds.
Augmentation Reduces Ongoing Reductions. As discussed previously, the total ongoing General Fund reductions to the trial courts totaled $664 million 2013–14. The Governor’s augmentation would reduce these ongoing reductions to $564 million for 2014–15. As shown in Figure 6, the budget assumes that $249 million in resources will be available to help offset a portion of this reduction. This leaves $315 million in reductions that will have to be absorbed by trial courts in 2014–15, a net increase of $100 million over the amount already assumed to be absorbed by the trial courts in 2013–14. This net increase in reductions results from the lack of trial court reserves available to offset ongoing reductions.
Figure 6
Trial Courts Budget Reductions Through 2014–15
(In Millions)
|
|
2008–09
|
2009–10
|
2010–11
|
2011–12
|
2012–13
|
2013–14 (Estimated)
|
2014–15 (Budgeted)
|
|
General Fund Reduction
|
|
|
|
|
|
|
|
|
One–time reduction
|
–$92
|
–$100
|
–$30
|
—
|
–$418
|
—
|
—
|
|
Ongoing reductions (cumulative)
|
—
|
–261
|
–286
|
–$606
|
–724
|
–$664
|
–$564
|
|
Total Reductions
|
–$92
|
–$361
|
–$316
|
–$606
|
–$1142
|
–$664
|
–$564
|
|
Solutions to Address Reduction
|
|
|
|
|
|
|
|
|
Construction fund transfers
|
—
|
$25
|
$98
|
$213
|
$299
|
$55
|
$55
|
|
Other special fund transfers
|
—
|
110
|
62
|
89
|
102
|
52
|
52
|
|
Trial court reserves
|
—
|
—
|
—
|
—
|
385
|
200
|
—
|
|
Increased fines and fees
|
—
|
18
|
66
|
71
|
121
|
121
|
121
|
|
Statewide programmatic changes
|
—
|
18
|
14
|
19
|
21
|
21
|
21
|
|
Total Solutions
|
—
|
$171
|
$240
|
$392
|
$928
|
$449
|
$249
|
|
Reductions Allocated to the Trial Courtsa
|
–$92
|
–$190
|
–$76
|
–$214
|
–$214
|
–$215
|
–$315
|
Increased Employee Benefit Costs. The trial courts indicate that they will face increased cost pressures in 2014–15 related to growing retirement and benefit costs. Currently, individual trial courts (primarily presiding judges and/or court executive officers) conduct separate and independent negotiations with local labor organizations representing most trial court employees. This differs from the collective bargaining process for most state employees, where the California Department of Human Resources oversees statewide labor negotiations on behalf of the Governor. In addition, unlike memoranda of understanding (MOU) negotiated with state employees, agreements negotiated with trial court employees are not subject to ratification by the Legislature and cost increases are not automatically included in the budget. Moreover, some trial court employees continue to participate in county retirement and health benefit programs. As a result, both the state and individual trial courts lack control over the level of these benefits set by the counties and provided to these trial court employees, and more importantly, the costs that must be paid to provide those benefits.
In recent years, concerns have been raised regarding whether trial courts have been effectively containing costs in their negotiations with trial court employees. For example, the Governor’s Budget Summary raises the concern that trial court employees in a number of courts are not (1) making retirement contributions or (2) making contributions in a manner similar to executive branch employees, who are generally required to contribute 8 percent to 10 percent of their salary towards these costs. In view of such concerns, the administration has not proposed additional funding specifically for increased trial court retirement and benefit costs since 2010–11. According to the judicial branch, these unfunded cost increases will reach an estimated $64.1 million by the end of 2013–14. Without additional resources to support these costs, trial courts will use more of their operational funds to meet these obligations, which could result in reduced levels of service to the public.
Few Statutory Changes to Increase Efficiency Adopted to Date. In 2012–13, the Legislature requested that the judicial branch submit a report on potential operational efficiencies, including those requiring statutory amendments. The Legislature’s intent was to identify efficiencies that, if adopted, would help the trial courts address their ongoing budget reductions. In May 2012, the judicial branch submitted to the Legislature a list of 17 measures that would result in greater operational efficiencies or additional court revenues. (Our publication,
The 2013–14 Budget: Governor’s Criminal Justice Proposals, describes in detail many of these measures.) However, only four administrative efficiencies and user fee increases have subsequently been implemented to date. In order to effectively absorb ongoing budget reductions, additional changes to make the courts operate more efficiently will likely need to be adopted.
Less Resources Available to Offset Reductions. Over the last five years, the state has transferred funds from various judicial branch special funds (such as those related to court construction) to help offset budget reductions to the trial courts. However, the availability of resources from these funds to offset reductions in the budget year will be limited. For example, most of the transfers to the trial courts have come from three special funds: the State Court Facilities Construction Fund (SCFCF), the Immediate and Critical Needs Account (ICNA), and the State Trial Court Improvement and Modernization Fund (IMF). However, the repeated transfer of dollars from these three funds has greatly reduced their fund balances. As a result, additional transfers would likely delay planned projects or reduce certain services typically supported by the fund (such as judicial education programs and self–help centers). Additionally, as we discuss in the next section, the fund balances for the SCFCF and ICNA have been identified as potential sources for temporary cash flow loans, which places further constraints on the availability of these funds to offset reductions.
Similarly, trial courts used their reserves to minimize the impact of ongoing funding reductions upon court users. However, the repeated use of reserve funds over the past five years and the full implementation of the new trial court reserves policy mean minimal reserve funds will be available to help offset budget reductions in 2014–15. (We discuss the reserves policy in more detail later in this report.)
Limited Ability to Increase Revenues to Offset Reductions. The Legislature has approved increases in criminal and civil fines and fees in recent years to fund court facility construction projects and to offset reductions to trial court funding. As can be seen in Figure 7, revenues from the recent fee increases are projected to decline in 2013–14 but will generally meet the original revenue estimates of the courts. Moreover, revenues for most of the individual fee increases are lower than what was projected. This could be an indication that, at least for some fines and fees, additional increases may not result in as much revenue as previously achieved. This could also be a signal of reduced access to justice as fewer people are accessing the civil court process because of the increased costs.
Figure 7
Total Revenues From Recent Fee Increases
(Revenues in Millions)
|
Fee or Penalty
|
Fee
Increase
|
Initial Revenue Projections
|
2012–13
Revenues (Actual)
|
Current Revenue Projections for 2013–14a
|
|
Increased in 2010–11
|
|
|
|
|
|
Summary Judgment Fee
|
$300
|
$6.2
|
$5.3
|
$4.7
|
|
Telephonic Hearing Fee
|
20
|
6.0
|
7.1
|
3.9
|
|
First Paper Filing Fee
|
20 or 40
|
40.1
|
31.8
|
30.6
|
|
Pro Hac Vice Fee
|
250
|
0.8
|
0.5
|
0.5
|
|
Parking Citation Penalty
|
3
|
10.5
|
25.5
|
21.3
|
|
Total New Revenues
|
|
$63.6
|
$70.3
|
$61.0
|
|
Increased in 2012–13
|
|
|
|
|
|
Jury Deposit Fee
|
$150
|
$11.7
|
$17.9
|
$11.5
|
|
Motion Fee
|
20
|
8.3
|
7.6
|
7.4
|
|
First Paper Filing Fee
|
40
|
21.1
|
20.4
|
20.5
|
|
Will Deposit Fee
|
50
|
2.2
|
1.0
|
1.0
|
|
Complex Case Fee
|
450
|
7.1
|
11.3
|
13.3
|
|
Total New Revenues
|
|
$50.4
|
$58.2
|
$53.8
|
|
a Estimated using partial–year revenues received through November 30, 2013.
|
Access to Court Services May Not Substantially Increase. While the Governor’s budget provides an additional $100 million in ongoing General Fund support for trial court operations, these funds may not result in a substantial restoration of access to court services. First, the Governor’s budget does not include a list of priorities or requirements for the use of these additional funds, such as requiring that they be used to increase public access to court services. We note that the 2013–14 budget requires that the trial courts use the $60 million augmentation provided to specifically increase access to court services, as well as report on both the expected and actual use of the funds. Second, as discussed above, trial courts (1) face increased cost pressures in 2014–15 and (2) will need to take actions to absorb around $100 million in additional ongoing prior–year reductions as one–time solutions previously used to offset these reductions will no longer be available in 2014–15. Thus, trial courts will need to take actions to absorb these cost increases and reductions on an ongoing basis, which could include further operational reductions. In view of the above, it is possible that the increased funding proposed in the Governor’s budget will only minimize further reductions in court services.
Impact of Funding Increase Will Vary by Court. We would also note that the impact of the proposed funding increase will vary across courts. This is because there are differences in:
- Cost Pressures Faced by Courts. Individual trial courts face different cost pressures. For example, some trial courts may have better controlled retirement and health costs through negotiations with employees, and therefore may be free to use more of the proposed augmentation for other purposes, such as increasing services to the public.
- Operational Actions Taken to Address Reductions. Trial courts also differ in the operational choices they made over the past few years to address their ongoing reductions. For example, some courts may have addressed most or all of their share of ongoing reductions through actions that resulted in ongoing savings. Thus, these particular courts may be able to use their share of the augmentation to restore services to the public. Other courts may have used limited–term solutions. To the extent that such limited–term solutions are no longer available, these courts will need to use more of the augmentation as a backfill to help minimize further service reductions.
- WAFM Funding. The implementation of WAFM impacts individual trial courts differently. The old prorata allocation methodology preserved existing funding inequities among the trial courts, as it was based on the historic share of funding received by courts rather than workload faced by the court. The WAFM corrects these inequities by redistributing funds among the courts based on workload. Thus, courts that historically have had more funding relative to their workload will benefit very little from the augmentation proposed by the Governor. In contrast, courts with less funding relative to their workload will benefit comparatively more from the augmentation.
Define Legislative Funding Priorities for Proposed Augmentation. Given the cost increases in employee benefits and the limited availability of resources to help trial courts absorb an increasing amount of ongoing reductions in 2014–15, as well as legislative concerns regarding the likely negative impacts of such challenges on court users, we find that the Governor’s proposed $100 million augmentation merits consideration. However, if the Legislature determines that (1) further minimizing the amount of additional impacts on court users is a statewide priority and (2) efficiencies or other options do not allow the courts to provide the level of service it desires, the Legislature could chose to provide additional General Fund support on either a one–time or an ongoing basis.
Regardless of the amount of additional funding provided to the trial courts in 2014–15, we recommend that the Legislature establish priorities for how the increased funding should be spent—for example, increasing access to court services. We also recommend that the Legislature require the courts to report on the expected use of such funds prior to allocation and on the actual use of the funds near the end of the fiscal year. Such information would allow the Legislature to conduct oversight to ensure that the additional funds provided are used to meet legislative priorities.
Consider Implementing More Efficiencies. We recommend that the Legislature consider further actions to help the trial courts operate more efficiently. For example, the Legislature could reevaluate the proposed statutory changes that were not enacted last year. These changes would allow the courts to do more with existing dollars, thereby minimizing the impact of their budget reductions. Additionally, in conversations with courts and other judicial branch stakeholders, a number of other such statutory changes exist that would increase efficiency. For example, courts have informed us that under current law, they may only discard death penalty files and exhibits upon the execution of the defendant. Since most individuals on death row are not executed but die due to natural causes, courts cannot destroy their case records and bear the costs of storing these files and exhibits indefinitely. The Legislature could modify current law to allow death penalty files and exhibits to be discarded on the death of the defendant, regardless of how the defendant died, which would reduce storage costs. Such changes could help provide the judicial branch with additional ongoing savings or revenues that could help further offset ongoing reductions. If the Legislature is interested in implementing a broader range of efficiencies beyond those already proposed, it could consider convening a task force to identify and recommend efficiencies, as we discuss in greater detail in the nearby box.
The Legislature could consider convening an independent task force—consisting of a broad range of judicial branch stakeholders—to comprehensively evaluate court processes and identify operational efficiencies that would reduce costs to the courts, improve delivery of court services, and increase access to court services. Although similar task forces have been convened in the past, these groups have only provided the Legislature with recommendations for which there is unanimous consensus. Consequently, the recommendations of these task forces have been limited in scope.
To maximize the menu of efficiencies available for legislative consideration, the Legislature could direct the task force to identify all efficiencies proposed by stakeholders, along with an assessment of each efficiency’s impact (fiscal or otherwise). Dissenting members would then be allowed to provide their concerns and rationale for opposition. This would then enable the Legislature to consider a broad range of efficiencies as well as the fiscal and policy implications of each option.
Establish Comprehensive Trial Court Assessment Program. Currently, there is insufficient information to assess whether trial courts are using the funding provided in the annual budget effectively. This makes it difficult for the Legislature to ensure that (1) certain levels of access to courts services are provided, (2) trial courts use existing and increased funding in an effective manner, and (3) funding is allocated and used consistent with legislative priorities. For example, it is unclear exactly how each trial court has absorbed past reductions and how such actions have impacted court outcomes. Thus, we recommend that the Legislature take steps towards establishing a comprehensive performance assessment program for the trial courts. (We initially made such a recommendation in our 2011 report, Completing the Goals of Trial Court Realignment.) While the judicial branch collects some statewide information related to certain measures of trial court performance (such as the time it takes a court to process its caseload), it currently lacks a comprehensive set of measurements for which data is collected consistently on a statewide basis.
In developing a comprehensive performance assessment program, we first recommend that the Legislature specify in statute the specific performance measurements it believes are most important and require the Judicial Council to collect data on each measurement from individual trial courts on an annual basis. In determining the specific performance measurements, we believe that it will first be important for the Legislature to solicit input from the Judicial Council. Thus, we recommend the Judicial Council report to the Legislature by a specified date on its recommendations regarding appropriate measurements. In preparing this report, the Judicial Council should examine the measurements currently used by federal courts and other state courts.
After the Legislature adopts specific performance measurements for the trial courts in statute, and once data on these measurements have been reported by the Judicial Council for at least two years, we recommend that the Legislature establish a system for holding individual courts accountable for their performance relative to those standards. Such an accountability system would involve the establishment of (1) a specific benchmark that the courts would be expected to meet for each measurement and (2) steps that would be taken should the court fail to meet the benchmark over time (such as by requiring a court that fails to meet a benchmark to adopt the practices of those courts that were successful in meeting the same performance benchmark).
Use of Trial Court Reserves. Chapter 850, Statutes of 1997 (AB 233, Escutia and Pringle), allowed the Judicial Council to authorize trial courts to establish reserves to hold any unspent funds from prior years. Chapter 850 did not place restrictions on the amount of reserves each court could maintain or how they could be used. These reserves consist of funding designated by the court as either restricted or unrestricted. Restricted reserves include (1) funds set aside to fulfill contractual obligations or statutory requirements and (2) funds usable only for specific purposes. Examples of restricted reserves includes funds set aside to cover short–term facility lease costs, service contracts, license agreements, and children’s waiting room costs. Unrestricted funds are generally used to avoid cash shortfalls caused by normal revenue or expenditure fluctuations, to make one–time investments in technology or equipment, and to cover unanticipated costs.
New Reserves Policy Enacted in 2012–13. As part of the 2012–13 budget package, the Legislature approved legislation to change the above reserve policy that allows trial courts to retain unlimited reserves. Specifically, beginning in 2014–15, each trial court will only be allowed to retain reserves of up to 1 percent of its prior–year operating budget. Additionally, legislation was approved to establish a statewide trial court reserve, managed by the Judicial Council, beginning in 2012–13. This statewide reserve consists of a withholding of 2 percent of the total funds appropriated for trial court operations in a given year—approximately $37.2 million in 2014–15. Trial courts can petition the Judicial Council for an allocation from this statewide reserve to address unforeseen emergencies, unanticipated expenses for existing programs, or unavoidable funding shortfalls. Any unexpended funds in the statewide reserve would be distributed to the trial courts on a prorated basis at the end of each fiscal year.
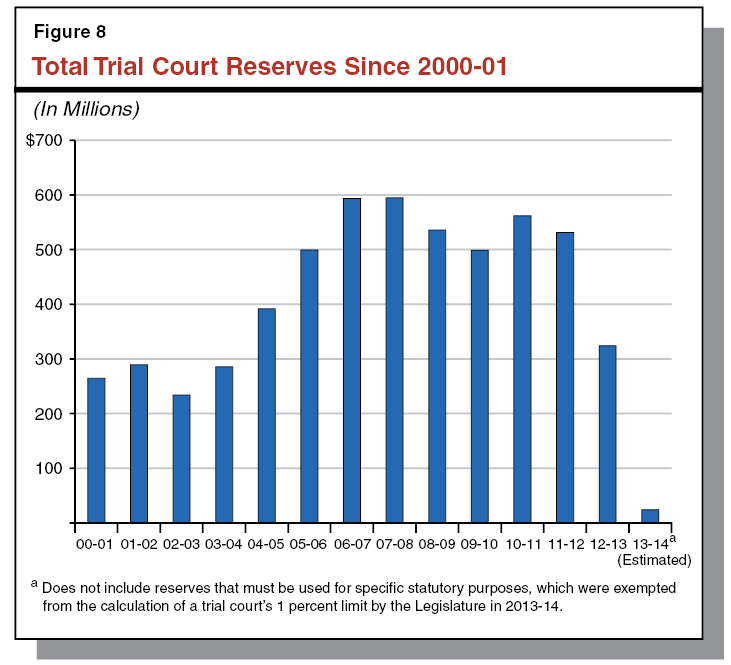
New Reserves Policy Amended in 2013–14. As part of the 2013–14 budget package, the Legislature approved legislation modifying the reserves policy to address some concerns that had been raised about the policy. For example, amendments were approved to authorize intra–branch loans to trial courts from three judicial branch special funds—SCFCF, ICNA, and the Judicial Branch Workers’ Compensation Fund—totaling up to $150 million for cash management purposes. The judicial branch is required to report each year on the amount of such loans made and courts are required to repay each loan within two years. Moreover, in order to increase the amount of reserves available for discretionary use, changes were also made to exempt reserves that must be used for specific statutory purposes (such as funds set aside to establish and maintain a children’s waiting room) from the calculation of a trial court’s 1 percent limit—which totaled about $38 million at the end of 2012–13 and represented about 33 percent of restricted reserve funds. In addition to exempting any such reserves from the calculation of the 1 percent limit, the judicial branch estimates that trial courts will be able to retain up to $24.1 million at the start of 2014–15. As shown in Figure 8, this is a substantial decrease from the $324 million in reserves held at the end of 2012–13.
The Governor’s budget maintains the reserves policy initially enacted as part of the 2012–13 budget package and amended in 2013–14. The administration states that the new reserves policy is more consistent with a state–funded judicial system as it enables the Judicial Council to set statewide priorities for the use of such funds and ensure that their use benefits the entire trial court system.
Cash Flow Concerns Persist Despite Special Fund Loans. Courts currently use their reserves to avoid cash shortfalls when their monthly operating expenses exceed their monthly allocation from the state. This ensures that courts pay all of their bills on time and that certain court programs can continue to operate even when there are delays in federal or other reimbursements. Accordingly, reducing the reserve courts are allowed to retain can create cash flow difficulties for courts. Moreover, the potential for cash shortfalls is exacerbated by the requirement that the judicial branch maintain a statewide reserve of 2 percent, as this means that each court’s total allocation is 2 percent smaller than it would otherwise be. The recent amendments to the reserves policy to permit temporary loans of up to $150 million from the SCFCF, ICNA, and the Judicial Branch Workers’ Compensation Fund should address most of the cash–flow issues in the short run. However, cash–flow loans from these three funds could force the judicial branch to delay payments or planned projects. To prevent this, the Legislature could expand the number of special funds that courts could borrow from for cash–flow purposes. For example, the Legislature could allow loans to be made from the IMF and the Court Facilities Trust Fund as well.
We note, however, that even with expanded authority to borrow from additional judicial branch special funds, it is likely that funds will be unavailable for loans in the long run without delaying projects or reducing support for programs currently funded by these special funds. For example, both the SCFCF and ICNA are currently used to make debt–service payments for completed courthouse construction projects. Over time, more projects will be completed requiring greater expenditures from both of these funds, which would further reduce the availability of such funds for cash shortfall loans. Thus, if priority was placed on ensuring $150 million in loans were available in these funds for cash–flow purposes, the judicial branch would potentially need to delay certain projects.
Courts May Need to Suspend Some Existing Contracts. While the amended reserves policy exempts funds set aside for specific statutory purposes, it does not take into account reserve funding that courts set aside to fulfill contractual obligations. This can create some challenges for the courts. First, some courts have ongoing contractual obligations. For example, some courts may utilize a third–party vendor to process their employee payroll, such as the county personnel agency or a private company. These third–party vendors often require the courts to maintain a certain amount of funding in reserve prior to issuing payroll—an amount generally greater than the 1 percent cap that they are allowed to keep in reserve under the new reserves policy. Without sufficient funds in reserve to meet such obligations, courts may have difficulty making employee payroll or may no longer be able to use their third–party vendor. Second, some courts have entered into one–time or multiyear contracts or agreements to fund various projects, such as replacing aging case management systems. In such circumstances, courts often set aside the entire cost of the project but only make incremental payments once vendors meet performance benchmarks. For example, one trial court has entered into a $2.4 million contract to replace its case management system with $1.1 million due in 2013–14 and $1.3 million due in 2014–15. However, the court will only be able to retain an estimated $305,000 in reserves to comply with the 1 percent cap—an amount significantly less than the $1.3 million due in 2014–15.
Since the above funds are not exempted from the calculation of the 1 percent limit, some courts may be forced to break existing contracts, particularly if an alternative funding source is not identified by the judicial branch. To the extent that courts are able to fulfill these expenditures within the 1 percent cap, they will likely have fewer unrestricted funds available for other purposes. This could potentially result in these courts requiring more loans to cover cash shortfalls, as well as the delayed implementation of additional projects or elimination of programs or services that would otherwise be supported through discretionary funds.
Limits Ability for Courts to Plan for Future Projects. Historically, trial courts built up their reserves to fund projects or programs to help them operate more efficiently, support additional workload, or provide the public with greater access to court services (such as document management, collections, electronic filing, and electronic access technologies). To the extent that the funds currently supporting such projects or programs exceed the 1 percent reserves cap, they could be halted or scaled back. Additionally, because the statewide reserve can only be used to address unforeseen emergencies, unanticipated expenses for existing programs, or unavoidable funding shortfalls, these funds are not available to support projects historically funded from reserves. Thus, the new reserves policy limits the ability of courts to save and plan over time for such investments.
Limits Incentive and Ability of Individual Trial Courts to Implement Efficiencies. Under the amended reserves policy, individual trial courts have less incentive to operate efficiently. The historical ability for courts to set aside unlimited funds encouraged them to operate more efficiently because any savings created could then be used by the court to fund future programs or projects that benefited it directly. Under the new reserves policy, however, reserve funds beyond the 1 percent cap created by efficiencies implemented by individual trial courts cannot be retained by the court. Accordingly, trial courts have less incentive to implement such efficiencies as they will be unable to benefit directly from the savings created. In addition, the reserves policy limits the ability of trial courts to create such efficiencies.
While the Governor’s budget proposes no new changes to the reserves policy in 2014–15, we recommend the Legislature amend existing policy to address some or all of the unintended challenges related to cash flow, meeting existing contracts, planning for future projects, and incentives for implementing operational efficiencies. We find that there are different ways that the Legislature could address each of these challenges.
- Cash–Flow Concerns. In order to address potential cash–flow concerns, the Legislature could make statutory changes to increase the availability of cash, such as by (1) expanding the number of judicial branch special funds eligible for making loans, (2) authorizing the State Controller’s Office to change the frequency of the distribution of funds to the judicial branch, and/or (3) permitting the state to make loans from its borrowable funds to the judicial branch. The Legislature could also exclude funds needed for cash–flow purposes from the calculation of the 1 percent reserve cap.
- Contract Concerns. In order to address concerns regarding the ability of trial courts to meet multiyear contracts, the Legislature could also exempt funds from the 1 percent cap that are (1) set aside as required by some trial court payroll vendors and (2) held to fulfill existing contracts.
- Future Projects. In order to enable courts to fund future projects and programs to improve court operations, the Legislature and judicial branch could establish new processes for prioritizing and funding those projects determined to be of greatest value to the state. For example, the Legislature could require the judicial branch to follow the same processes that currently exist for other state entities for the approval and funding of information technolody projects.
Alternatively, the Legislature could decide to increase the trial court reserves cap from the current 1 percent limit. The new limit could vary depending on the extent that the Legislature takes other actions (such as those described above) to address the challenges currently resulting from the 1 percent cap. For example, according to the judicial branch, trial courts would need to keep approximately 12 percent of their prior–year operating budget in order to avoid cash–flow issues, assuming no other changes are adopted to alleviate concerns regarding cash flow. We note that increasing the cap could also help provide an incentive and ability to invest in future projects that could create operational efficiencies.
The CDCR is responsible for the incarceration of adult felons, including the provision of training, education, and health care services. As of January 15, 2014, CDCR housed about 134,000 adult inmates in the state’s prison system. Most of these inmates are housed in the state’s 34 prisons and 42 conservation camps. Approximately 11,700 inmates are housed in either in–state or out–of–state contracted prisons. The department also supervises and treats about 47,000 adult parolees and is responsible for the apprehension of those parolees who commit new offenses or parole violations. In addition, about 700 juvenile offenders are housed in facilities operated by CDCR’s Division of Juvenile Justice (DJJ), which includes three facilities and one conservation camp.
The Governor’s budget proposes total expenditures of $9.8 billion ($9.5 billion General Fund) for CDCR operations in 2014–15. Figure 9 shows the total operating expenditures estimated in the Governor’s budget for the current year and proposed for the budget year. As the figure indicates, the proposed spending level is an increase of $391 million, or about 4 percent, from the 2013–14 spending level. The department’s budget includes increased spending related to (1) a projected increase in the prison population, (2) the expansion of the correctional officer training academy, (3) increased workers’ compensation expenses, (4) the expansion of rehabilitation programs, and (5) increased use of in–state contract beds for inmates. This additional spending is partially offset by a projected decrease in the adult parole population resulting from the 2011 realignment of adult offenders to counties.
Figure 9
Total Expenditures for CDCR
(Dollars in Millions)
|
|
2012–13 Actual
|
2013–14 Estimated
|
2014–15 Proposed
|
Change From 2013–14
|
|
Amount
|
Percent
|
|
Prisons
|
$7,481
|
$8,214
|
$8,496
|
$282
|
3.3%
|
|
Adult parole
|
621
|
569
|
566
|
–3
|
–0.6
|
|
Administration
|
409
|
430
|
546
|
116
|
21.3
|
|
Juvenile institutions
|
175
|
187
|
179
|
–8
|
–4.7
|
|
Board of Parole Hearings
|
57
|
41
|
46
|
5
|
10.1
|
|
Totals
|
$8,742
|
$9,441
|
$9,833
|
$391
|
4.2%
|
The average daily prison population is projected to be about 138,000 inmates in 2014–15, an increase of roughly 2,800 inmates (2 percent) from the estimated current–year level. This increase is largely due to an increase in admissions to state prison. In particular, the department reports an increase in the number of offenders convicted as “second strikers.” (Under the state’s Three Strikes law, an offender with one previous serious or violent felony conviction who is convicted for any new felony can be sentenced to twice the term otherwise required under law for the new conviction and must serve the sentence in state prison. These particular offenders are commonly referred to as second strikers.) In 2012–13, 5,500 second strikers were admitted to state prison, which is an increase of 33 percent from the prior year. The CDCR’s projections also show that the prison population is expected to continue increasing over the next few years. By June 30, 2019, the department estimates that the prison population will be 143,000.
The average daily parole population is projected to be about 37,000 parolees in the budget year, a decline of about 9,000 parolees (20 percent) from the estimated current–year level. This decline is largely a result of the 2011 realignment, which shifted from the state to the counties the responsibility for supervising certain offenders following their release from prison. The CDCR’s projections also show that the parole population is expected to continue to decline—although at a slower pace—over the next few years. By June 30, 2019, the department estimates that the parole population will be 33,000.
As part of the Governor’s January budget proposal each year, the administration requests modifications to CDCR’s budget based on projected changes in the prison and parole populations in the current and budget years. The administration then adjusts these requests each spring as part of the May Revision based on updated projections of these populations. The adjustments are made both on the overall population of offenders and various subpopulations (such as mentally ill inmates and sex offenders on parole). As can be seen in Figure 10, the administration proposes a net increase of $2.9 million in the current year and a net reduction of $23.4 million in the budget year.
Figure 10
Governor’s Population–Related Proposals
(Dollars in Millions)
|
|
2013–14
|
2014–15
|
|
Prison Population Assumptions
|
|
|
|
2013–14 Budget Act
|
128,885
|
128,885
|
|
Governor’s 2014–15 budget
|
135,006
|
137,788
|
|
Prison Population Adjustments
|
6,121
|
8,903
|
|
Parole Population Assumptions
|
|
|
|
2013–14 Budget Act
|
42,498
|
42,498
|
|
Governor’s 2014–15 budget
|
45,944
|
36,660
|
|
Parole Population Adjustments
|
3,446
|
–5,838
|
|
Budget Adjustments
|
|
|
|
Inmate–related adjustments
|
$5.0
|
$2.2
|
|
Contract bed adjustments
|
–7.7
|
—
|
|
Jail contract reimbursements
|
—
|
13.2
|
|
Health care facility activations
|
–0.2
|
–4.9
|
|
Parolee–related adjustments
|
5.9
|
–28.7
|
|
Other adjustments
|
–0.1
|
–5.1
|
|
Proposed Budget Adjustments
|
$2.9
|
–$23.4
|
The current–year net increase in costs is primarily due to costs from the higher–than–expected 2013–14 parole population, as well as additional unanticipated costs for the recently activated California Health Care Facility (CHCF) in Stockton. These costs are partially offset by savings related to in–state contract beds due to delays in moving inmates into such beds, as well as reduced costs associated with the deactivation of temporary mental health crisis beds at the California Men’s Colony in San Luis Obispo. (The increased cost for the administration’s proposed expansion of in–state contracts in the current year is accounted for elsewhere in the Governor’s budget for CDCR.)
The budget–year net reduction in costs is largely related to the lower–than–expected 2014–15 parole population and reduced costs associated with deactivating temporary mental health crisis beds at the California Institution for Men in Chino and California State Prison, Sacramento. These reductions are partially offset by increased costs to reimburse counties for various services provided to CDCR (such as housing CDCR inmates when they must appear in court), as well as costs from an increase in certain populations of inmates needing mental health care.
In general, the administration’s projections of the prison and parole population are reasonable based on recent trends, and the associated budget adjustments are generally reasonable. We find, however, that potential savings could be realized by adjusting for the delayed activation of CHCF, as well as from reducing reliance on registry for mental health position vacancies.
Delayed Activation of CHCF. The department activated CHCF in July 2013 and began transferring inmates to the prison in phases throughout the fall of 2013. The department’s original activation schedule called for CHCF to have all of its 1,722 beds filled by December 31, 2013. However, the activation of certain housing units were delayed. For example, CDCR delayed the activation of seven 30–bed housing units for mentally ill inmates operated by the Department of State Hospitals (DSH). The CDCR activated two of these units several months behind schedule, and the other five units were inactive at the time of this analysis. It is unclear when the units will be activated. According to CDCR, the delays have resulted from DSH’s inability to hire sufficient mental health professionals to staff the housing units. Moreover, we note that the state recently suspended the transfer of inmates to CHCF due to activation problems (such as inadequate medical supplies). The delayed activation of the housing units should reduce workload for CDCR in 2013–14 and 2014–15. This is because the department does not need to allocate budgeted correctional officer time to provide security for empty housing units. In addition, there are fewer inmates to escort throughout the prison (such as to medical appointments). However, the administration’s request for additional resources for the operation of CHCF does not reflect any savings to CDCR from such workload reductions.
Use of Registry for Mental Health Services. Mental health staffing levels are determined using a ratio staffing model, which is based on patient population, clinical staff recommendations, direction from the Coleman court special master, and other factors. Adjustments are made twice annually based on changes in the patient population. We note, however, that mental health staff positions have consistently been very difficult to fill. Currently, the department has a vacancy rate of 23 percent, excluding registry, blanket, and long–term sick leave. According to CDCR, none of the additional 75 mental health positions authorized by the Legislature for 2013–14 (including psychiatrists, psychologists, and administrative support staff) have been filled. In 2013–14, CDCR estimates that it will realize $36 million in salary savings from those vacancies and is projected to spend $25 million on registry staff (temporary staff paid an hourly wage) to cover the vacant positions.
The CDCR utilizes registry staff because of the difficulties in filling mental health positions and the need to maintain a certain basic level of services. As such, some level of registry is expected and unavoidable. However, registry may be more expensive than hiring civil service staff. Highly trained classifications such as psychiatrists and psychologists are particularly more expensive to hire as registry staff.
One way to reduce the need to use expensive registry staff is to encourage individuals providing registry services to transition to civil service positions. However, there is little reason for registry employees to do so, because CDCR currently has no cap on the number of hours a mental health registry employee can work. As a result, individuals can earn more as registry staff. We note that CDCR has put in place such caps on registry nurses in medical classifications because of similar concerns about unnecessary costs.
We withhold recommendation on the administration’s adult population funding request until the May Revision. We will continue to monitor CDCR’s populations, and make recommendations based on the administration’s revised population projections and budget adjustments included in the May Revision. However, we recommend that the Legislature direct the department to make adjustments as part of the May Revision to reflect the savings from the delayed activation of housing units at CHCF.
We also recommend that the Legislature direct the department to report during budget subcommittee hearings this spring on (1) the feasibility of instituting a cap for individual registry employees in cases where such employees are more costly than civil servants and (2) what would be an appropriate cap. The cap would need to be low enough to provide an incentive for these employees to transition to civil service, but not too low that it inhibited the department’s ability to provide mental health services. Such information would assist the Legislature in determining whether and what type of cap should be adopted. To the extent a cap encourages registry employees to transition to civil service, it could reduce the overall cost of mental health services in CDCR. We further recommend the Legislature require the department to report on how all of the savings realized from mental health staff vacancies has been used by the department, in order to determine whether the activities that were funded are consistent with legislative priorities and whether CDCR’s budget should be adjusted accordingly.
Each year the state spends billions of dollars annually both in base staffing costs and overtime costs to ensure each of its prisons is adequately staffed and is able to handle its various workload demands. Below, we describe and identify inefficiencies with how CDCR currently addresses these staffing needs. In addition, we review the Governor’s budget proposals related to CDCR’s staffing and overtime and recommend steps the department could take to address its correctional staffing needs in a more cost–effective manner.
Staffing the 34 adult prisons operated by CDCR represents a unique challenge. This is because many duty assignments (referred to as “posts”) must be filled 24 hours per day, 365 days per year. In particular, many assignments filled by correctional officers, sergeants, and lieutenants are posted positions. If a staff member is unavailable to fill a post, the prison generally cannot leave the post unfilled. Staff in these posts typically work one of three eight hour shifts (referred to as “watches”) each day, five days per week and have two regular days off (RDOs). Thus, a single post is typically filled by three different employees over the course of a day. Staff members assigned to the prison’s “watch office” are employed to ensure that all the posts are filled and are responsible for finding an employee capable of filling posts that are left empty when another employee is unavailable.
Steps Taken to Fill Posts Left Empty When Staff Are Unavailable. There are different reasons why an employee is unavailable to fill an assigned post, with employee leave use being the most common. Each correctional employee used, on average, 365 hours of leave in 2011–12. The most common type of leave used by correctional employees is sick leave. Other types of leave include vacation leave, annual leave (a type of leave employees may choose to earn in lieu of vacation and sick leave), and leave taken by staff to complete professional training and development or to fulfill military duty. In addition, posts can be empty if a position is vacant, such as when CDCR fails to hire enough staff. When a post becomes empty due to vacancies or staff absences, the watch office at the prison takes a series of sequential steps to identify certain employees to fill the absent post as follows.
- Relief Officers. When posts become empty because staff are unavailable, the watch office attempts to first fill the empty posts with relief officers. Relief officers are full–time correctional employees who are assigned to a specific prison. These officers arrive at the prison for a predetermined shift, but may not know which post they will be assigned to on a given day until they arrive at the prison. If there are not enough empty posts on a given watch, relief officers can be assigned other duties, such as searching the prison for contraband. Relief officers receive the same pay and benefits as other correctional officers assigned to regular posts.
- Officers Redirected From Other Posts. If relief officers are not available to fill empty posts, the watch office may then determine whether any correctional employees can be redirected from other posts that do not need continual staffing during the watch in question. Examples of posts that do not require continual staffing include posts in prison investigation units.
- PICOs. If the empty posts are correctional officer assignments (and not for correctional sergeants or lieutenants), the watch office will then attempt to use PICOs to fill the empty posts. Like relief officers, PICOs generally are assigned to a specific prison. However, unlike relief officers, PICOs only work if they are called in by the watch office to fill an empty post—similar to how a substitute teacher fills in for a sick school teacher. The pay and benefits of PICOs are contingent on the number of hours they work.
Overtime. If the posts are still empty after the above steps are taken, a watch office will then offer correctional employees the opportunity to earn overtime on a voluntary basis, with more senior officers being offered the opportunity first. If no employees volunteer to work overtime, a watch office will then use involuntary overtime to fill empty posts. Under these circumstances, overtime is assigned in reverse seniority order, with the most junior correctional employee on the previous watch being required to stay and fill the empty post on the next watch.
In addition to the need to fill posts, workload that falls outside each watch can also drive the need for correctional employee staffing and overtime. The most significant workload that results in the need for staffing and overtime is the workload associated with medical guarding and transportation. Such workload occurs when inmates require certain types of medical care that cannot be provided on–site and correctional staff must transport them to their appointments and guard them while they are there. This often results in overtime because the total time to transport and guard inmates can extend beyond the end of an officer’s shift. Other workload also contributes to the need for correctional staffing and overtime. Examples include the need to conduct investigations, transport inmates to and from their court dates, and various emergencies such as prison riots.
CDCR Budget for Relief Officers and PICOs. In order to estimate the number of relief officers that should be budgeted for in a given year, CDCR has historically used a formula that incorporates both the amount of leave time (such as vacation, sick leave, and training days) accrued by correctional officers as well as how much of that leave time they use. Currently, CDCR estimates that for every ten correctional officer positions, three relief officers must be budgeted for to account for the leave time that will likely be used by regular correctional officers. This ratio of relief officers to correctional officers is known as the “relief factor.” The department also uses a similar process for budgeting relief officers to fill posts left empty by correctional sergeants and lieutenants. The CDCR is budgeted in the current year for a total of about 4,500 correctional relief positions, which consists of 3,800 correctional officers, 530 correctional sergeants, and about 190 correctional lieutenants. In total, this represents about $500 million in costs.
In addition, CDCR has recently employed several hundred PICOs, accounting for 3.5 percent of the department’s total number of correctional officers. Because the department is currently facing high correctional officer vacancy rates, it plans to suspend placing newly hired correctional officers into the PICO program for two years. During this time the department plans to only offer new hires permanent full–time positions while it assesses whether its historical policy of assigning 3.5 percent of its total correctional officers as PICOs should be permanently adjusted. The CDCR does not have a budget specifically for PICOs. Instead, resources for these positions are derived from funding budgeted for overtime and positions that are vacant, as the use of PICOs reduces the need for these funds.
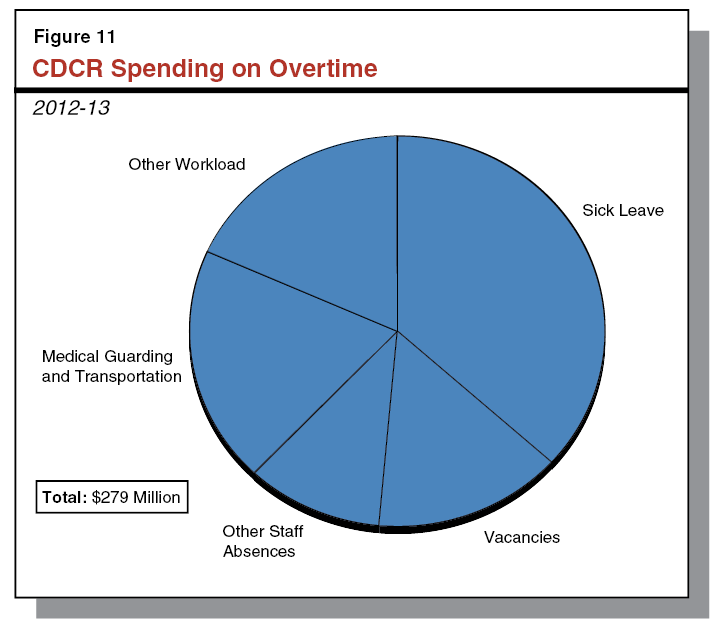
CDCR Spending on Overtime. In 2012–13, CDCR spent $279 million on correctional officer, sergeant, and lieutenant overtime costs. As shown in Figure 11, most of this spending is related to overtime to fill posts left empty due to staff being unavailable. Specifically, almost two–thirds of CDCR’s expenditures on overtime in 2012–13 were related to sick leave, vacant positions, or other staff absences. The remainder was spent on other workload–related overtime (such as medical guarding and transportation).
The Governor’s 2014–15 budget proposes $207.2 million in General Fund support for overtime costs. This represents a slight increase from the $201.3 million included in the 2013–14 budget for overtime costs. In addition, the budget proposes to change the methodology CDCR uses to calculate the relief factor. Under the proposal, the relief factor would be calculated based solely on statewide actual leave usage rather than a combination of actual leave usage and accrual rates. In addition, the proposed methodology would incorporate types of leave (such as furlough days) that are not accounted for in the current relief factor. These changes result in the need for an additional $9 million in General Fund support and 84 positions in 2014–15. Under the Governor’s proposal, the relief factor would be adjusted annually based on updated data on actual usage of staff leave in the prior year. In addition, we note that CDCR indicates that while the proposed relief factor change is based on statewide data, it is currently in the process of calculating specific relief factors for individual prisons that could be used to make annual adjustments at each prison in the future.
Our analysis of the way CDCR staffs its prisons and manages overtime indicates that CDCR’s overtime budget is unnecessarily large. While budgeting for overtime related to workload and some absences is necessary, the department does not need to set aside funding specifically for overtime required to cover vacancies and most of the types of leave that result in posts being empty. This is because funding for these types of overtime can be redirected from savings resulting from vacant positions. For example, when overtime is needed to fill a post that is empty due to a vacancy, the department can redirect funding tied to the vacant position to pay for the overtime, as that funding is not being used to pay correctional employees. Similarly, because the department budgets for enough relief officers to cover nearly all of the leave taken by correctional employees, overtime is only necessary to cover for such leave if there are vacant relief officer positions.
We also note that the amount of funding derived from vacant positions is sufficient to fully cover overtime costs. This is because the amount budgeted for each correctional position on a per hour basis, including benefits and other non–salary costs, exceeds the cost of the overtime necessary to cover the number of hours typically worked by correctional employees, as is illustrated in Figure 12. While staff are generally paid one and a half times their usual pay for overtime hours, the increased costs for the higher hourly wage is more than offset by other factors. For example, when the state hires additional correctional staff it must pay for their retirement and benefits whereas there are no such costs incurred for each additional hour of overtime worked.
Figure 12
Amount Budgeted Per Vacant Position Exceeds Average Cost of Overtime
|
|
Officer
|
Sergeant
|
Lieutenant
|
|
Salary
|
$70,128
|
$85,429
|
$96,108
|
|
Benefits and other costs
|
41,691
|
48,902
|
52,900
|
|
Total Amount Budgeted Per Position
|
$111,819
|
$134,331
|
$149,008
|
|
Average number of hours worked
|
1,712
|
1,688
|
1,728
|
|
Hourly Amount Budgeted Per Vacancy
|
$65.31
|
$79.58
|
$86.23
|
|
Average Overtime Hourly Cost
|
$47.92
|
$59.18
|
$68.61
|
However, when CDCR incurs costs for overtime related to workload (such as medical guarding and transportation) and leave not covered by relief officers (such as leave earned when correctional employees work through furlough days), there is no source of funding available to be redirected to cover such costs. Thus, CDCR only needs to set aside overtime funds in its budget exclusively for these purposes.
However, as shown in Figure 13, CDCR’s overtime budget in recent years is far larger than what has been required to fund overtime related to workload and absences not covered by relief officers. We note that Figure 13 does not depict CDCR’s actual spending on overtime, but rather compares the amount budgeted for overtime to our estimate of the department’s actual need for overtime funding. While CDCR’s actual spending on overtime has exceeded its budget in recent years, as we explain above, savings from vacancies is available to cover most of these costs. As such, the department’s actual spending on overtime does not reflect its need for overtime funding.
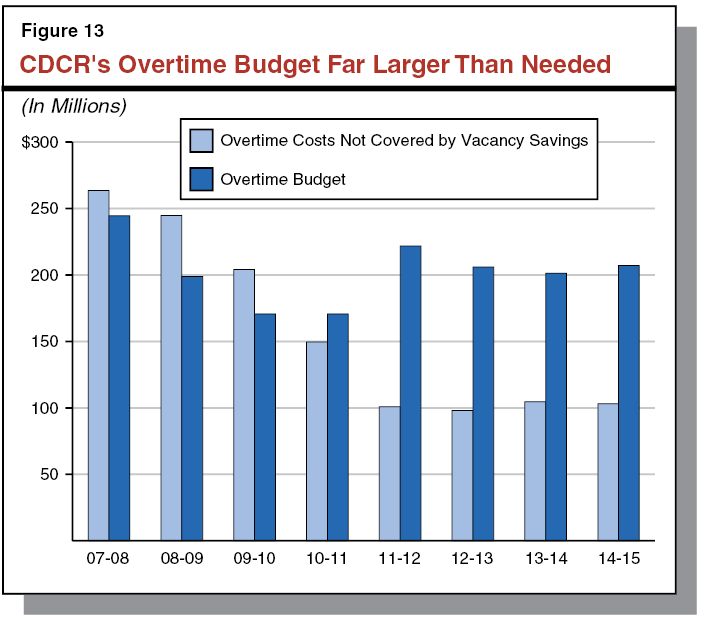
In 2011–12 and 2012–13, CDCR’s overtime budget was more than $100 million above, or about double, the amount required to fund overtime related to workload and absences not covered by relief officers. The discrepancy between CDCR’s overtime budget and its actual need for overtime funding increased significantly in 2011–12, when the department received additional funding because it had typically spent more on overtime than it had previously been budgeted for. At the same time, the implementation of the 2011 realignment reduced the inmate population and the number of correctional employees, which in turn significantly reduced the department’s need for overtime funding. Although CDCR’s overtime budget was reduced slightly in 2012–13, the budget was still more than $100 million beyond its actual need. Similarly, we estimate that the administration’s proposed overtime budget for 2014–15 is over budgeted by more than $100 million.
In view of the above, it appears that the funding tied to vacant positions has been used by CDCR for other purposes rather than to support the costs of overtime resulting from the vacancies. Our analysis finds that such funding has typically been used to address unfunded costs that the department has experienced in recent years. For example, in 2012–13, the department incurred $290 million in workers’ compensation costs, despite having only $210 million in its budget for such costs. In order to cover the $80 million shortfall, CDCR redirected unused funds from various places within its budget including funds tied to vacant positions.
As described above, CDCR establishes the relief factor by taking into account the amount of leave time accrued and used by correctional employees in prior years, which is then used to estimate the number of relief officer positions to budget for. Currently, this amounts to three relief officer positions for every ten correctional officer positions and slightly more for correctional sergeants and lieutenants. (The administration’s proposed changes to the relief factor would marginally increase these ratios for correctional officers, and slightly reduce them for sergeants and lieutenants.) However, this represents the amount of relief officers CDCR needs on average over the course of a year. While, in actuality, the amount of leave taken—and by extension the number of relief officers needed—is subject to seasonal variation. For example, officers tend to take more leave in the summer months and during December, with less leave in the remaining months. By basing the number of relief officers needed on an annual average, CDCR ends up budgeting for too many relief officers in most months of the year, and not enough in the summer and December. This means that, if there were no vacancies in relief officer positions, more correctional employees would likely report to work than necessary eight months of the year. Although vacancies can prevent this from occurring, it still demonstrates that CDCR’s budget includes more funding for relief officers than necessary in most months of the year. This mismatch is illustrated in Figure 14, which compares the number of hours of leave correctional employees are currently likely to use in each month with the number of hours of staffing that relief officers are likely to provide under CDCR’s current approach to staffing, assuming there are no vacancies in relief officer positions.
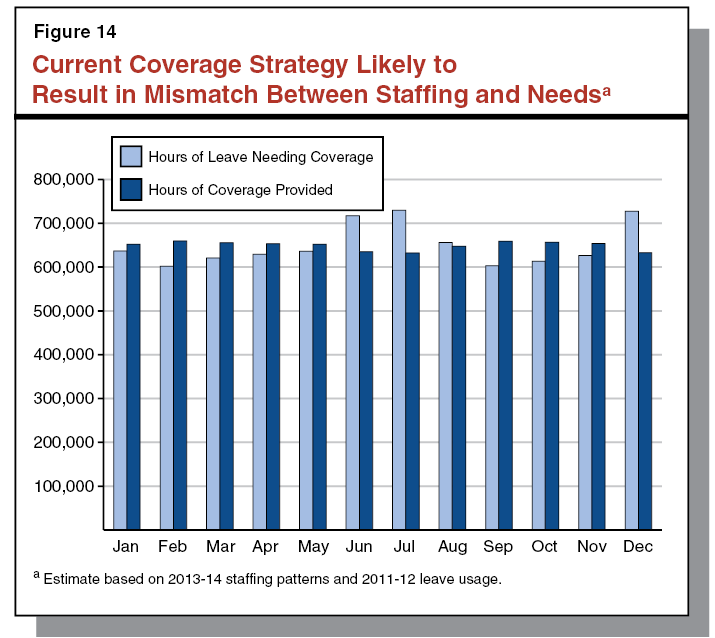
CDCR Does Not Allocate Relief Officers Based on Needs of Specific Institutions. The mismatch between an institution’s need for coverage and the number of relief positions it is budgeted for is further compounded by a flaw in CDCR’s method for allocating relief officers among prisons. Currently, CDCR allocates relief positions among institutions based solely on the number of non–relief positions it has despite the fact that staff leave usage—and thus the need for relief officers—varies significantly among institutions. Such variation in leave usage occurs primarily because each institution has a different mix of more and less senior officers and more senior officers tend to accrue and use leave at higher rates. For example, as shown in Figure 15, staff at Pelican Bay State Prison in Crescent City, which has relatively fewer senior officers, used about 29 percent less leave per employee than those at Valley State Prison for Women in Chowchilla in 2011–12. However, under the current allocation procedure, each of these institutions would be allocated relief positions at the same rate.
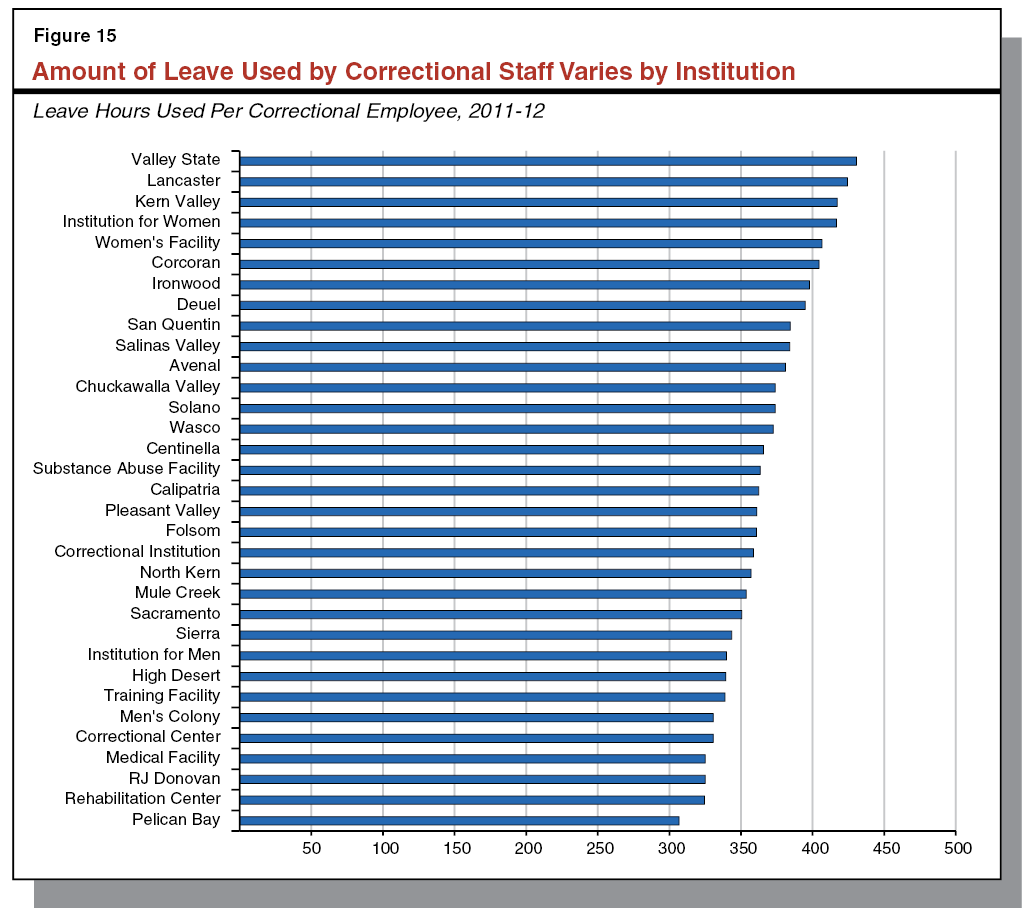
CDCR Does Not Take Full Advantage of the Benefits of Utilizing PICOs. In contrast to relief officers, who are scheduled for work irrespective of the amount of need on the day they are scheduled, institutions can use PICOs only when needed. This flexibility makes PICOs uniquely suited to address the seasonal and institutional variability in the need to cover for officers using leave. In addition, PICOs generally cost less on an hourly basis—after adjusting for the number of hours a relief officer is likely to work—than relief officers. Moreover, PICOs earn their benefits based on the number of hours they work, in contrast to relief officers whose benefits are generally independent of the amount of time they work. Figure 16 compares the hourly cost of a budgeted relief officer who works 1,712 hours (about the average amount worked by correctional officers in 2011–12) with the hourly cost of a PICO that is in a similar pay range.
Figure 16
PICOs Less Costly Per Hour Than Relief Officers
|
|
Cost of a Relief Officer Position
|
Cost of a PICO
|
|
Salary
|
$70,128
|
$58,206
|
|
Retirement
|
21,964
|
18,160
|
|
Health, vision, dentala
|
12,600
|
12,600
|
|
Worker’s compensation
|
3,147
|
3,147
|
|
Medicare
|
1,017
|
844
|
|
Cost of leaveb
|
—
|
6,460
|
|
Equipment and other costs
|
2,963
|
2,963
|
|
Totals
|
$111,819
|
$102,381
|
|
Hours workedc
|
1,712
|
1,712
|
|
Cost Per Hour
|
$65.31
|
$59.80
|
In order to address the issues we identified above, we recommend that the Legislature (1) require CDCR to revise its budgeting methodology for relief officers and PICOs and (2) adjust CDCR’s overtime budget to more closely reflect its need for overtime spending. As we describe in more detail below, we estimate these changes would free up a total of $129 million relative to the Governor’s proposed budget for 2014–15.
Revise Budgeting Methodology for Relief Positions and PICOs. As discussed above, CDCR currently budgets relief positions based on average annual data, which results in too many relief officers being budgeted in many months in which a less than average amount of leave is being used. In addition, CDCR allocates relief positions to institutions uniformly, despite variance in the amount of leave taken at each institution. Finally, CDCR attempts to budget enough relief positions to, on average, cover all the leave taken in a given year, even though PICO officers are more flexible and less costly. Although the Governor’s proposal to update the relief factor annually based on actual leave usage in the prior year and to adopt institution specific relief factors is a step in the right direction, it does not go far enough in addressing the concerns discussed above. Specifically, the proposal does not address variance in the need for relief officers throughout the year and does not take full advantage of the benefits offered by utilizing more PICOs.
In order to address these concerns, we recommend that the Legislature direct CDCR to revise its relief officer and PICO budgeting methodology. Specifically, we recommend that CDCR budget only enough relief officers to each institution to cover the minimum amount of leave taken at each institution in a given year, and use PICO officers to cover any leave taken above that amount. For example, under this approach, each institution’s allocation of relief officers that cover for correctional officers could be tied to the amount of leave taken during the week or month in the prior year during which the least amount of leave was used by correctional officers. To cover leave taken above that amount, each institution would receive a specific budget to employ PICOs. This would ensure that each institution has an allocation of relief officers and PICOs that can flexibly respond to seasonal variation in the need for coverage, is tailored to the institution’s unique need for coverage, and maximizes the use of less costly PICOs to provide that coverage. Similarly, we recommend that CDCR revise the way it allocates relief positions that cover for correctional sergeant and lieutenant positions. We recommend that these relief officers be allocated to each institution based on data on leave taken at the institution in the prior year, rather than on historical statewide averages. This would ensure that each institution’s allocation of relief sergeants and lieutenants is tailored to its specific needs. We estimate that the above changes could result in the elimination of around 700 relief officer positions and the need for around 600 PICO positions resulting in net savings of about $25 million annually. We note that this adjustment could be revised at the May Revision based on more up–to–date data.
Adjust CDCR’s Overtime Budget. Our best estimate is that the department only needs $103.2 million to cover its workload–related overtime costs in 2014–15. As discussed above, CDCR’s remaining overtime costs can be covered with savings from vacant positions. Accordingly, we recommend that the Legislature reduce the $207.2 million proposed by the administration for overtime expenditures by $104 million. We note that this adjustment could be revised at the May Revision based on more up–to–date data.
Vacancies occur when CDCR does not have enough employees to fill all of the positions that it is funded for in the annual state budget. Historically, the department has had a vacancy rate of about 5 percent. However, as of December 2013, CDCR had about 2,200 vacancies in its correctional officer positions—a vacancy rate of about 10 percent. According to the department, the recent increase in its vacancy rate is due to several factors, including (1) the suspension of recruiting correctional officers from March 2011 through March 2013, (2) the activation of new prisons in Stockton and California City, and (3) an increased correctional officer attrition rate. As discussed earlier in this report, vacancies drive the need to cover posts through the use of overtime. According to the department, the high vacancy rate and the resulting overtime utilization is contributing to increased sick leave and workers’ compensation claims due to fatigue and stress.
In order to permanently address vacancies, CDCR must hire new officers. However, the process to recruit, qualify, train, and place individuals into correctional officer positions is extensive. For example, applicants must pass numerous written, physical, and psychological examinations and undergo a background check. After this process, cadets are trained for 16 weeks at the academy at the Richard A. McGee Correctional Training Center in Galt. As of April 2014, however, the department plans to shorten the duration of the academy to 12 weeks. After completing the 12–week training, new correctional officers will receive one week of orientation and three weeks of field training at correctional facilities.
According to CDCR, once an institution identifies a need for correctional officers, it can take 12 to 18 months before individuals are placed into the institution. The shortened academy may slightly reduce the amount of time necessary. While most academy graduates are assigned to permanent full–time duty, historically the department has assigned some graduates to become PICOs in order to achieve its target of having 3.5 percent of total authorized correctional officers assigned as such. However, as we discussed earlier in this report, CDCR plans to suspend assigning academy graduates to PICO positions for two years while it considers whether to adjust its 3.5 percent target.
The Governor’s 2014–15 budget proposes a $61.7 million General Fund augmentation and 147 new positions to expand CDCR’s recruitment and training of correctional officer candidates. This would more than double the department’s budget of $49.1 million for such purposes in the current–year. According to the administration, these resources are needed to increase hiring to fill correctional officer positions that are currently or expected to be vacant. The proposal includes increased staff to recruit and evaluate correctional officer applicants and additional resources for the academy to train cadets. Together with the recent reduction to the length of the academy training period, these changes would allow CDCR to increase the number of academy graduates from 720 in 2013–14 to 3,400 in 2014–15.
The growing number of correctional officer vacancies presents significant operational challenges for the department. While the Governor’s proposal is a reasonable approach to addressing the problem, we are concerned that the problem could have been mitigated—or even avoided altogether—if CDCR had been conducting regular forecasts of its correctional officer need as part of the annual budget process.
As discussed above, the process to recruit, qualify, train, and place individuals into correctional officer positions is extensive. As such, CDCR must forecast its need for new correctional officers 12 to 18 months in advance in order to ensure that the amount of resources it has devoted to recruiting and training officers at any point in time is sufficient to produce the number of new officers it will need in the future. Currently, the administration adjusts its proposed funding levels for CDCR for both the current and budget years biannually—first in January and then again in May—to incorporate forecasts of key workload drivers (such as the total inmate population). Even though the department currently tracks data (such as correctional officer vacancies and attrition rate) that could be used to project the need for future academy graduates, this data and adjustments to its recruitment and training capacity are not part of the department’s biannual budget adjustments or any other regularly scheduled budget process.
This lack of planning can result in the department not recruiting and training the appropriate number of cadets to meet its needs. For example, during the personnel reductions related to the 2011 realignment, the department assumed that it would be eliminating more positions than it would be required to fill. Accordingly, the department did not run a basic academy between March 2011 and May 2013. (We note the department did operate transitional academies which allowed employees in one classification—like parole agents—to transfer into new classifications—like correctional officers.) However, correctional staff left the department at higher rates than expected. As a result, CDCR will likely be facing a staffing shortfall for the next couple of years as it tries to recruit and train enough officers to fill these vacancies. If the administration had routinely took into account CDCR’s training and recruiting needs as part of the biannual budget process, the department would have likely recruited and trained enough officers to prevent the significant shortfall it currently faces.
Direct CDCR to Regularly Adjust Recruitment and Training Capacity. We recommend that the Legislature direct the department to incorporate adjustments to its correctional officer recruitment and training capacity into its biannual budget adjustment process. Such adjustments should be based on projections of its need for additional correctional officers at least 18 months into the future to account for the time required to recruit and train new officers. This would allow the department to better prepare for its future need for correctional officers and to avoid mismatches between the number of vacancies and the number of new academy graduates.
Direct CDCR to Continue to Fill PICO Positions. As discussed above, CDCR intends to temporarily suspend assigning new correctional officers to PICO positions in order to prioritize filling permanent full–time and relief officer positions. It is understandable that hiring PICOs may not be the highest priority, particularly for prisons with high vacancy rates for permanent correctional officer positions. However, as we discussed in an earlier section regarding prison staffing and overtime, there are benefits to using PICOs that the department is not currently taking full advantage of. Accordingly, we recommend that the Legislature direct the department to continue offering newly trained correctional officers the option of accepting PICO positions.
Data provided by CDCR indicate that drug use is prevalent in prison. For example, in June 2013, 23 percent of randomly selected inmates tested positive for drug use. In addition, another 30 percent refused to submit to testing, which suggests that the actual percentage of inmates using drugs is likely considerable.
Drug use in prison is problematic for several reasons. For example, according to the department, the prison drug trade strengthens prison gangs and leads to disputes among inmates that can escalate into violence. Such violence often leads to security lock–downs which interfere with rehabilitation by restricting inmate access to programming. In addition, the presence of drugs in prison allows inmates to continue using them, thereby reducing the effectiveness of drug treatment programs.
The Governor’s budget for 2014–15 proposes to expand existing efforts related to drug and contraband interdiction. In recent years, the department has supplemented its base funding of $3 million for drug and contraband (such as cell phones) interdiction with one–time funds from asset forfeitures. According to CDCR, its current interdiction efforts have been hampered by a lack of sufficient permanent funding. In recognition of this, the Governor’s budget for 2014–15 proposes an augmentation of $14 million in General Fund support and 81 positions to expand CDCR’s interdiction program. Under the proposal, these levels would increase to $18.5 million and 148 positions in 2015–16. The proposal consists of four separate initiatives aimed at deterring the smuggling of drugs and contraband into prison and deterring inmates from using drugs. These initiatives involve: (1) increasing from 29 to 100 the number of trained canines to detect contraband possessed by inmates; (2) increasing from 7 to 35 the number of ion scanners available to detect drugs possessed by inmates, visitors, or staff; (3) purchasing an additional 240,000 urinalysis kits to randomly drug test inmates; and (4) equipping inmate visiting rooms with video surveillance technology and requiring inmates in visiting rooms to wear special clothing intended to prevent the smuggling of drugs and other contraband.
Studies of the implementation of interdiction initiatives in California and in other states suggest that strategies similar to those being proposed by the administration can be effective at reducing contraband and drug use in prison. This, together with the ongoing challenge posed by in–prison drug use, lead us to conclude that the administration’s goal of reducing contraband and drug use in prisons is both worthwhile and achievable. However, as we discuss below, it is unclear based on our review of the research in this area which initiatives, or combination of initiatives, proposed by the administration are most cost–effective at reducing contraband and drug use in prison.
In 1999, CDCR initiated a two–year interdiction pilot program that included all four of the initiatives identified in the administration’s current proposal. A study of this pilot program by the University of California, Los Angeles, found that while drug use declined over the course of the pilot program, most of the decline could be attributed to random urinalysis testing—the least costly of the initiatives proposed by the Governor. The study found that the other interdiction strategies (such as canine units and ion scanners) did not appear to contribute to declines in drug use. In addition, data suggest that the other interdiction initiatives may not be effective at detecting drugs. For example, over the course of the study period, the canine units were involved in almost 9,000 searches that resulted in only ten drug finds, and the use of ion scanners—one of the most costly initiatives proposed by the Governor—resulted in only a single drug find.
We note, however, that certain aspects regarding the implementation of the 1999 pilot program suggest that the above results are not necessarily conclusive. For example, the ion scanners identified above were not used to scan visitors or staff, which CDCR intends to do under the Governor’s proposal. We also note that there may have been improvements in the technology of available scanners since 1999. In addition, the above pilot study was unable to determine the effectiveness of visiting room video surveillance equipment.
While the Governor’s proposal to expand CDCR’s drug and contraband interdiction efforts has merit, it is unclear what the most cost–effective combination of interdiction initiatives is. Thus, we recommend that the Legislature modify the proposal to conduct a pilot of the various initiatives proposed by the Governor. Specifically, we recommend the Legislature reduce the request from $14 million in General Fund support in 2014–15 ($18.5 million in 2015–16) to $3 million annually on a three–year limited–term basis. The reduced funding amount would allow the department to pilot test the four proposed interdiction initiatives—urinalysis testing, canine units, ion scanners, and visiting room surveillance—in different combinations in order to assess the relative effectiveness of the initiatives. The Legislature could use the outcomes of the pilot to determine which, if any, of the various initiatives should be expanded to all of the state’s prisons.
The actual cost of the pilot program could vary depending on how it is designed. Accordingly, we recommend that the Legislature adopt budget bill language requiring that the department (1) contract with independent researcher experts (such as a university) to design and evaluate the pilot program, (2) not expend any funds for the expanded interdiction initiatives until it has notified the Legislature of the design and cost of the pilot program, (3) revert any unspent funds to the General Fund, and (4) report to the Legislature on the outcomes (including the relative cost–effectiveness of each initiative) of the pilot program by April 1, 2017. This would allow the evaluation to incorporate two full years of data and for the results to inform the 2017–18 budget process.
Background. In 2006, after finding the state failed to provide adequate medical care to prison inmates, the federal court in the Plata v. Brown case appointed a Receiver to take control over the direct management of the state’s prison medical care delivery system from CDCR. The Receiver’s office is currently responsible for providing medical pharmaceuticals prescribed by physicians under his management, as well as psychiatric and dental medications prescribed by psychiatrists and dentists managed by CDCR. From 2004–05 through 2010–11, the inmate pharmaceutical budget increased from $136 million to $216 million. (The pharmaceutical budget reflects only the cost of pharmaceuticals and not the cost of medication distribution or management.)
Increases in the inmate pharmaceutical budget can occur for several reasons, such as additional inmates needing prescription drugs and increases in the rate at which inmates are prescribed drugs. Moreover, we note that pharmaceutical costs generally rise at a faster pace than inflation. For example, in 2012, average drug costs increased approximately 3.8 percent and average prices for brand name drugs increased 25.4 percent, compared to an overall 1.7 percent increase in consumer prices. Brand name drugs are often prescribed when generic alternatives are unavailable due to patent protections. In addition, while cost savings can be achieved by using a formulary (a list of preferred medicines that cost less), drugs that have few alternatives are less likely to have formulary options, which can also contribute to cost growth. This is particularly an issue for CDCR because the inmate population is disproportionately likely to have health issues for which there are no generic prescription therapies available. For example, about 26 percent of the inmate patient population has a serious mental health diagnosis and many mental health medications are patent–protected, which results in high mental health pharmaceutical costs.
Recognizing the uncertainty associated with pharmaceutical cost growth, the size and acuity of the patient population, and the potential cost savings of various programmatic changes initiated by the Receiver, the Legislature increased the inmate pharmaceutical budget on a limited (rather than permanent) basis in recent years. Specifically, since 2007–08, the Legislature has provided only limited–term augmentations (typically for one to three years) to support inmate pharmaceutical costs. As we discuss below, spending on such costs has declined in the past couple of years compared to previous highs. The enacted 2013–14 budget includes a total of $178 million for inmate pharmaceuticals. Of this amount, $51 million was provided on a limited–term basis. Figure 17 shows the amount spent on pharmaceuticals per inmate from 2004–05 through 2012–13, and as revised and proposed by the Governor for 2013–14 and 2014–15.
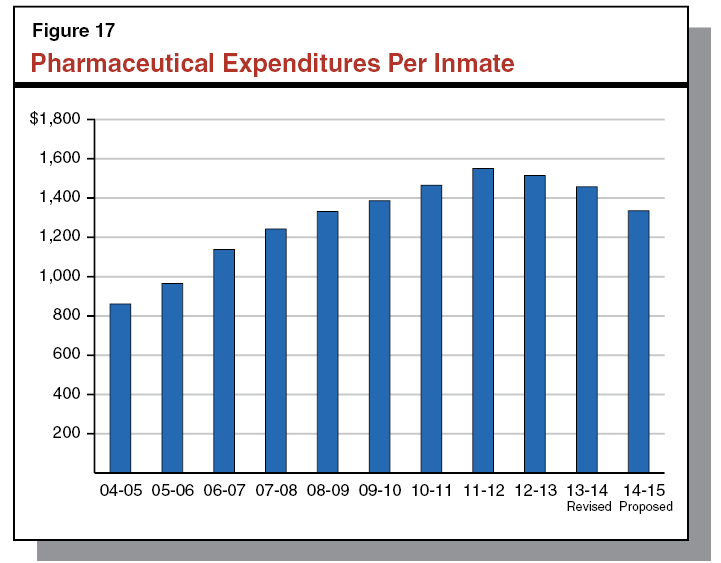
In recent years, the Receiver has taken some steps to reduce pharmaceutical costs. As shown in Figure 17, costs per patient have declined slightly in recent years. In addition, the department is working to reduce non–formulary prescribing and pharmaceutical waste, developing a centralized procurement process, and is using the implementation of electronic health records as an opportunity to standardize ordering, refilling, and discontinuing medications. However, as we discuss below, some of these improvements have not yielded their full benefit and there are still significant improvements that the Receiver has yet to make.
Governor’s Proposal. The Governor’s budget proposes adjustments to the inmate pharmaceutical budget for both the current and budget years. For 2013–14, the budget proposes to reduce the current–year pharmaceutical budget to $168 million. For 2014–15 and ongoing, the budget proposes $161 million for inmate pharmaceuticals. This $161 million budget would become the new baseline for the Receiver’s pharmaceutical spending, establishing an ongoing budget based on current purchasing and prescribing practices.
Pharmaceutical Spending Higher Than Other States. Although the amount that the state spends per inmate on pharmaceutical drugs has declined in recent years, it still remains higher than other large states for which we were able to obtain data, as shown in Figure 18. Under the Governor’s budget, the state would spend about $1,350 per inmate on all pharmaceutical drugs in 2014–15, compared to $1,514 in 2012–13. The state spent approximately $659 on psychiatric drugs per mental health patient in 2012–13, the most recent year for which data was available. By contrast, other large states are spending approximately $820 per inmate on all pharmaceuticals and $571 per inmate on psychiatric medications. California’s spending on pharmaceuticals exceeds the average of these other states by more than 80 percent while its spending on psychiatric medication is approximately 17 percent greater than the average of these other states.
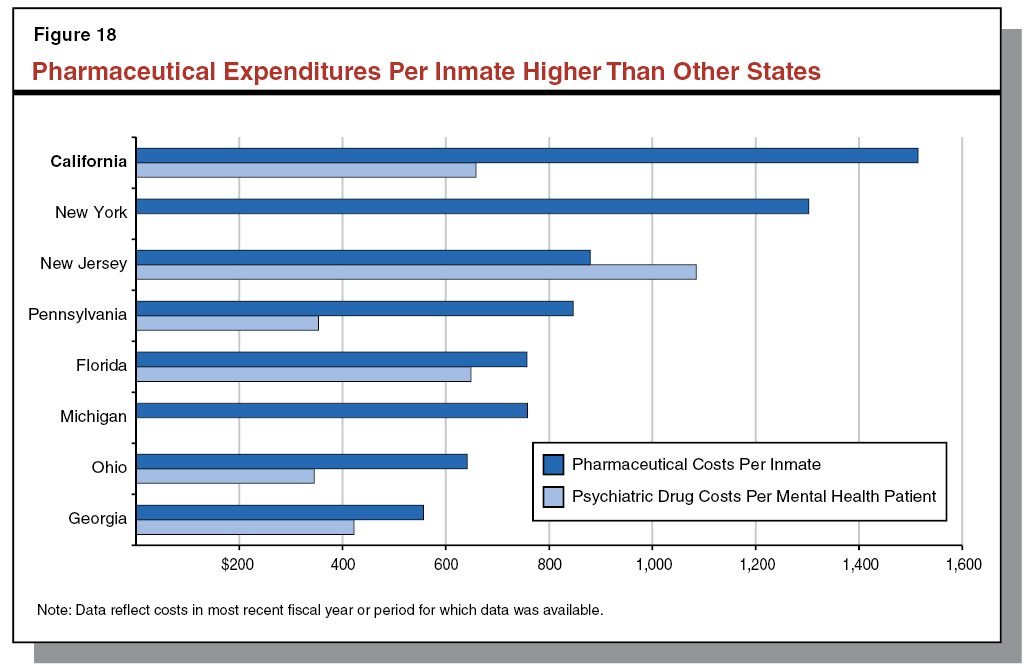
Non–Formulary Prescribing Remains High. The Receiver’s office maintains a list of medicines it prefers that health care providers prescribe to inmates, which is also referred to as a formulary. Non–formulary prescriptions are typically two to three times more expensive than those on the formulary. According to the Receiver’s Turnaround Plan of Action (the Receiver’s detailed proposal for how to achieve a constitutional level of care), one of the keys to managing pharmaceutical costs is utilization of a drug formulary. Accordingly, the Receiver has a goal of having the rate of non–formulary prescriptions by medical providers be 3 percent. As can be seen in Figure 19, however, most CDCR prisons exceed this 3 percent goal. The process for approving non–formulary prescriptions is not centrally controlled by the Receiver’s office, but rather by staff at each of the 34 prisons. This likely contributes to the significant variation in non–formulary usage among prisons.
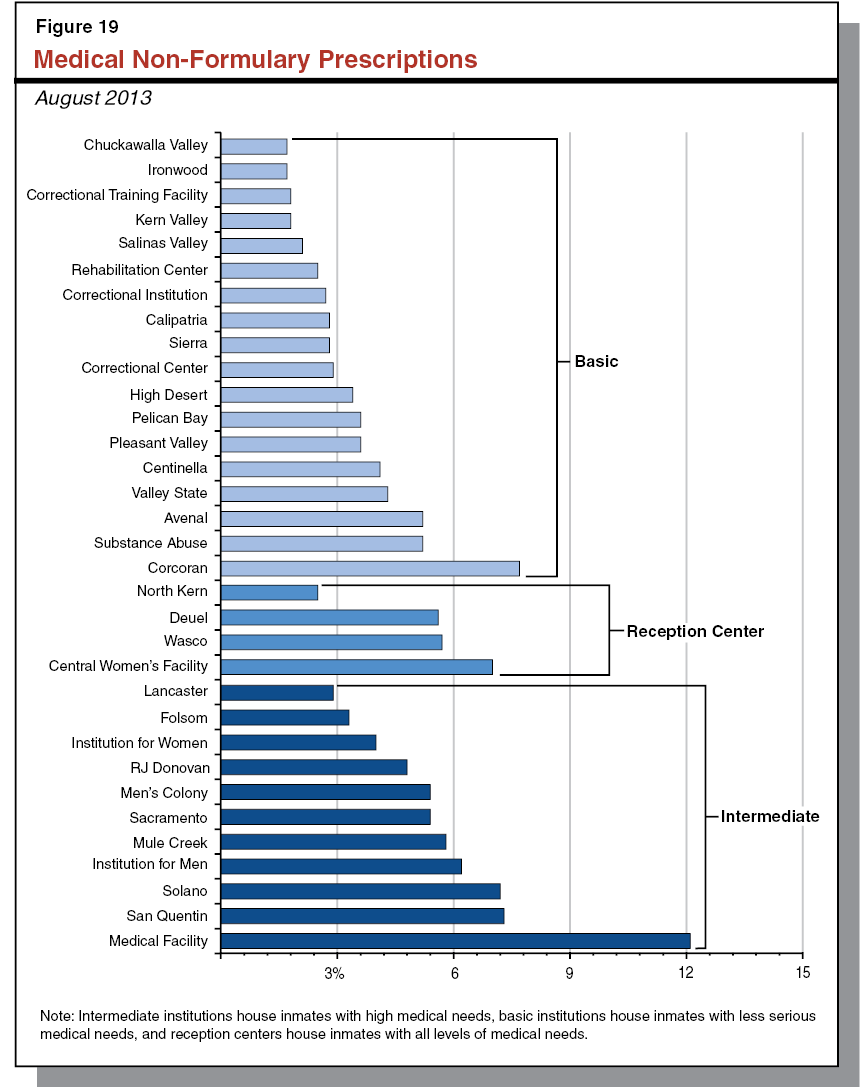
Receiver’s Office Has Not Adopted Some Expert Recommendations. In addition to the issues described above, several other areas of concern related to pharmaceutical practices in prisons continue to be expressed by the Office of the Inspector General (OIG) and Health Management Associates (HMA), a consulting firm that performed an organizational assessment of the Receiver’s office in 2013. While the Receiver’s office is in the process of acting on some of these recommendations, we believe the opportunity for further efficiency increases exists. For example, the Receiver is currently in the process of developing a centralized procurement process and conducting a recovery audit of vendor pricing and rebates. Both of these steps could result in reduced pharmaceutical costs. In addition, prison medical programs continue to have large volumes of pharmaceutical waste (meaning pharmaceuticals that go unused). Such waste could be prevented through improvements in policies related to pharmaceutical prescribing and restocking and inmate transfers (meaning when an inmate moves from one institution to another).
We also note that the Receiver recently established a central fill pharmacy to provide prescriptions to all institutions as a way to create efficiencies. For example, having such a pharmacy could reduce the volume of prescriptions processed and filled at the institutions, as well as reduce the need for each institution to continue operating its own pharmacy. We note, however, currently only an average of 65 percent of keep–on–person medications are filled through the central fill pharmacy, and each institution continues to operate its own pharmacy. Underutilization of the central fill pharmacy can create unnecessary costs because of increased workload and processing at the institutions. Finally, the Receiver’s office also has deficiencies in inventory management, such as the discrepancies between the computerized inventory stock and the actual stock on shelves. All of the issues identified above suggest that the Receiver’s current pharmaceutical expenditures continue to be larger than necessary.
LAO Recommendation. The Governor’s budget proposes to increase the base budget for inmate pharmaceuticals. However, we are concerned that increasing the ongoing base budget for a system that has not yet fully realized recommended efficiency improvements could remove any incentive for further improvement and result in excess cost. Thus, while we recommend that the Legislature approve the administration’s proposed pharmaceutical budget, we recommend that it be for only two years (2014–15 and 2015–16), so that it can reevaluate the need for ongoing funding in two years. In addition, we recommend that the Legislature require the Receiver’s office to perform an analysis of the potential savings that could be achieved by addressing the issues identified by the OIG and HMA and report to the Legislature by January 2016. This information will allow the Legislature to better assess what the ongoing size of the Receiver’s pharmaceutical budget should be when the limited–term funding expires.
Background. The federal Americans with Disabilities Act (ADA) provides civil rights protections and equal access to public and private services and facilities for individuals with disabilities. In 1994 a lawsuit, Armstrong v. Brown, was filed alleging CDCR was not in compliance with the ADA. In 1999, CDCR negotiated a settlement in the lawsuit and developed the Armstrong Remedial Plan (ARP) to address the areas of noncompliance. In 2007, the court issued an injunction because it found CDCR to be in continued violation of the ADA and ARP. In 2012, the court clarified the 2007 injunction, and specified that the Receiver’s office is also subject to the ARP. In August 2012, the Receiver signed an MOU with the plaintiffs, requiring all medical staff to comply with ARP and all orders from the Armstrong court. Based on the outcomes of compliance reviews conducted by CDCR’s Office of Audits and Court Compliance, the Receiver’s office currently has an Armstrong compliance percentage of 84 percent, with the goal of obtaining 100 percent compliance.
Currently, the workload associated with the MOU at each prison is being handled by administrative support staff in the inmate medial services program overseen by the Receiver. This workload is in addition to their normal responsibilities. We also note that three analysts at CDCR headquarters are responsible for reviewing compliance documents and monitoring tour reports, as well as for developing corrective action plans and ensuring institution compliance with ARP. According to the Receiver’s office, there have been challenges in carrying out the above activities with existing staff. As a result, some institutions have experienced delays in submitting the required documents or, in some cases, have submitted incomplete documents. In addition, there have also been delays in the reviews conducted by staff at CDCR headquarters.
Governor’s Proposal. The Governor’s budget for 2014–15 proposes a $4 million General Fund augmentation and 42 new positions for the Receiver’s office to comply with the Armstrong MOU. Of the requested positions, (1) 34 positions will be allocated so that each institution receives one additional position to assist with the workload related to ARP and ADA compliance, (2) two positions will support field operations, (3) four positions will be assigned to headquarters, and (4) two positions for sign language interpretation will be assigned to the two new CDCR facilities—CHCF and DeWitt Nelson. The administration indicates that the requested funding and positions will help reach the goal of 100 percent compliance with the MOU by 2014–15.
Sign Language Interpreter Positions Are Necessary. In 2012, the Armstrong court ruled that CDCR must provide sign language interpreters for all inmates requiring such assistance. Due to the MOU, this requirement also applies to the inmate medical services currently overseen by the federal Receiver. The court also ruled that all institutions designated to house hearing and speech impaired inmates must have a permanent sign language interpreter available to assist such inmates. Despite this requirement, CHCF and DeWitt Nelson currently lack such interpreters due to an oversight in the previous request that established the staffing packages for these intuitions. Accordingly, the Governor’s proposal to provide interpreters to these institutions will bring CHCF and DeWitt Nelson in line with other CDCR facilities and the ARP.
Permanent Staffing Needs Unclear. As noted above, administration indicates that the requested resources will help the Receiver’s office improve from an Armstrong compliance rate of 84 percent to 100 percent by 2014–15. Specifically, the administration states that the proposed position for each institution will develop operating procedures for that institution, assist with corrective action plans, track allegations of noncompliance, and train other staff on ARP and ADA requirements. If the Receiver’s office achieves the projected compliance of 100 percent by 2014–15, it is unclear how much of that workload will exist after 2014–15. For example, once full compliance has been achieved, the need to implement corrective action plans should not be necessary. We also note that the workload associated with tracking noncompliance should be substantially diminished after achieving full compliance. Thus, it appears unnecessary for the requested positions to be provided on a permanent basis rather than on a limited–term basis.
Quantity and Distribution of Staff May Not Be Appropriate. The administration’s budget proposes 40 positions to achieve full compliance with the MOU, a rate of approximately one position for every 250 Receiver budgeted staff positions. By comparison, CDCR has 67 staff assigned to ARP and ADA compliance for non–health care operations, a rate of approximately one position for every 755 CDCR budgeted staff positions. Since many of the compliance activities are associated with tracking complaints against specific staff and training staff on ARP and ADA policies, 40 positions may be excessive for the volume of work associated with compliance. In addition, it is possible that some of the proposed institution–level positions could cover several institutions, as many facilities are colocated or located within a short distance of one another.
The proposal also includes one position for every institution. However, each institution may have different workload. Though each institution will have some level of required activities, institutions with currently low levels of compliance will likely have greater workload. For example, these institutions may have more substantial corrective action plans, may require more monitoring and correction of staff noncompliance, and may require more training. This possibility seems to be supported by the fact that some institutions are currently managing the workload, while others have difficulty meeting deadlines or submitting complete documentation. We are concerned that, under the administration’s plan, some institutions may be understaffed while others may be overstaffed. Without established metrics to evaluate the workload at each institution, it is not possible at this time to determine appropriate ongoing staffing levels.
LAO Recommendations. We find that the two sign language interpreter positions proposed by the Governor are justified and recommend the Legislature approve them. However, while we acknowledge that the Armstrong MOU has resulted in increased workload for the Receiver’s office, we are concerned that the other 40 additional positions proposed by the Governor on a permanent basis do not take into account the volume of workload either at a statewide level or at each institution. We also are concerned that workload will decline in future years and that approving permanent staff is therefore unnecessary.
Given these concerns, we recommend that the Legislature approve 14 one–year, limited–term positions statewide for the Receiver to achieve ARP and ADA compliance. This would provide the Receiver with the same compliance staff to total staff ratio that CDCR uses to achieve compliance. We also recommend that the Legislature require the Receiver to report this spring at budget hearings on specific workload and performance metrics by institution and statewide. The measures the Receiver reports on should include, but not be limited to: performance on the Armstrong audit tool, performance on internal audits, volume of staff noncompliance allegations, volume of inquiries and cases closed, progress on corrective action plans, and number of staff training events. This information would allow the Legislature to reassess the appropriate level of staffing as part of its spring budget deliberations. Should the Receiver present information that suggests that additional positions are necessary, or that positions should be provided on a permanent basis, the Legislature could modify the level of staffing at that time.
Background. As part of the 2002 settlement agreement in Plata v. Brown, CDCR agreed to ensure clean and sanitary health care environments in its prisons. Most of the cleaning is performed by inmates supervised by custody staff. Although the sanitation of health care facilities is held to a higher standard than the cleaning of non–health care facilities, the inmates do not receive training in health care facility cleaning and disinfection. The provision of these janitorial services varies widely by institution. While some institutions have fixed schedules to clean some or all of the health care areas at the institution, other institutions have no set cleaning schedules for any of their health care areas. We also note that at some institutions, additional cleaning is done by contracted janitors.
In 2012, the Plata court ordered medical inspections of institutions that had reached a certain level of compliance with the 2002 settlement agreement. These inspections are performed by court experts and included an evaluation of health care cleanliness and sanitation. Several of the audits identified deficiencies in facility cleanliness, which could delay the transfer of responsibility for the management and provision of inmate medical services back to the state. We also note that in 2012, the chief executive officer of the California Medical Facility (CMF) in Vacaville approached the California Prison Industry Authority (CalPIA) about developing a health care facilities cleaning service pilot project. The contract included the training of inmate laborers, staff oversight of inmate laborers, the maintenance of cleanliness in clinical areas, and the provision of cleaning materials. This pilot project has been extended through 2014 and now employs 46 inmate workers.
Governor’s Proposal. The Governor’s budget proposes to expand the CMF pilot project regarding the cleaning of health care facilities on a statewide basis. Specifically, the budget proposes a $14.5 million General Fund augmentation for 2014–15, which would increase to $19.5 million in 2015–16, for the Receiver to enter into a statewide health care facility janitorial contract with CalPIA. By contrast, without this proposal the Receiver’s office would likely spend around $8 million to keep health care spaces in the prisons clean. The Governor’s budget also proposes the elimination of 83 Receiver staff positions in 2014–15, as the CalPIA contract will replace existing Receiver janitorial resources. The budget proposes to transfer these janitorial positions to CalPIA. In addition, the proposal includes one full–time staff position for program oversight, and anticipates employing 628 trained inmate laborers. The statewide contract cost will be approximately $28 million in 2015–16 (upon full implementation), which translates to a cost of $1.38 per square foot serviced.
Proposal Has Merit. . . Given the concerns raised by the Plata court experts and the lack of statewide consistency in the sanitation of health care areas in the prisons, the Governor’s proposal to contract with CalPIA for janitorial services merits consideration. The CalPIA has experience with managing clinical space cleanliness and has already operated a pilot program at CMF. In addition, developing a standardized statewide program for janitorial services would help ensure appropriate sanitation and, thus, improve the state’s ability to regain control of inmate medical services.
The Governor’s proposal could also help reduce inmate recidivism. This is because CalPIA would train participating inmate laborers in health facility cleaning standards and practices and provide certification to those inmates who complete training. This training and certification could result in improved employment opportunities for such inmates upon their release from prison and make them less likely to reoffend.
. . . But Estimated Costs Appear Unnecessarily High. Although the Governor’s proposal could provide several benefits as discussed above, we find that the proposal would dramatically increase the amount the state spends on cleaning health care spaces in the prison. As mentioned above, the Receiver’s office would likely spend around $8 million on janitorial services absent the Governor’s proposal. This proposal would increase those costs to nearly $28 million annually, at a cost per square foot of $1.38. By comparison, Kaiser pays $1.36 per square foot for janitorial services in its health care facilities. Similarly, janitorial services for comparable spaces at San Joaquin General Hospital—which includes a secured wing that provides medical care to CDCR inmates—costs $1.35 per square foot. While it may seem reasonable that the Receiver would have cleaning costs similar to the private sector, we are concerned by that parity because both of these health care providers employ non–incarcerated individuals and must pay at least minimum wage. By contrast, CalPIA will employ inmate laborers, who typically earn far less than the minimum wage (often less than $1 per hour).
According to information provided by CalPIA and the Receiver’s office, only 5 percent of the contract cost is for inmate wages. Nearly three–quarters of the cost is for the wages and benefits of civil service employees and the oversight, training, and audit employees. Despite the recidivism reduction and improved cleanliness of this proposal, we remain concerned about the high costs—particularly the high personnel costs—of the Governor’s proposal.
LAO Recommendation. While we acknowledge the need for improved janitorial services, we recommend that the Legislature withhold action on this proposal until the Receiver’s office can justify the significant cost of the contract with CalPIA. Accordingly, we also recommend the Legislature require the Receiver’s office to report at budget subcommittee hearings this spring on why these janitorial services cannot be provided at a lower cost by CalPIA or an outside contractor.
Background. The DJJ within CDCR is responsible for housing juvenile offenders sent to its facilities by the juvenile courts for committing certain serious, violent, or sex offenses. The DJJ also houses minors who are sentenced to state prison by the adult criminal courts, usually until they turn age 18, at which time they are transferred to a CDCR prison. Since 1998, the DJJ population has declined. The DJJ is projected to have an average of 708 juvenile offenders in its facilities in 2013–14 and 649 offenders in 2014–15. By June 30, 2019, DJJ is projected to have 556 juvenile offenders.
The DJJ has three main facilities to house juvenile offenders: O.H. Close (OHC) Youth Correctional Facility in Stockton, N.A. Chaderjian (NAC) Youth Correctional Facility in Stockton, and the Ventura Youth Correctional Facility (VYCF) in Camarillo. Each facility houses juvenile offenders in smaller living units based on the type of treatment each offender needs. For example, the behavior treatment program (BTP) living unit serves juvenile offenders who exhibit aggressive and violent behavior. Each of the three DJJ facilities has a BTP living unit, with a capacity of 18 offenders at OHC and 24 offenders each at NAC and VYCF. As of December 30, 2013, there are 11 BTP offenders at OHC, 15 at NAC, and 21 at VYCF.
Governor’s Proposal. The Governor’s budget for 2014–15 proposes to spend $590,000 from the General Fund to construct four noncontact visiting booths at VYCF for use by juvenile offenders in the BTP living unit. These booths would allow for enhanced security while BTP offenders use their visiting privileges. The administration notes that there have been a variety of incidents during visiting hours with BTP offenders, including fights and attempts to introduce contraband into VYCF. According to the administration, noncontact booths would limit the occurrence of these incidents. The proposed project would begin August 2014 and construction would conclude in September 2015.
Declining DJJ Population May Make Proposed Project Less Necessary. According to DJJ’s fall 2013 population projections, the number of juvenile offenders in the BTP living units will decline from 54 to 38 between September 2013 and June 2015. However, more recent data suggest that the BTP population is currently lower than expected. Specifically, as of December 2013, only 37 juvenile offenders were in BTP units, with only 21 of these offenders housed at VYCF. Since the overall population of juvenile offenders is projected to decline by 15 percent between the end of 2013 and June 2015, the BTP population may experience further declines as well. Specifically, if the BTP population declines by 15 percent, OHC will have 12 BTP offenders, NAC will have 16 BTP offenders, and VYCF will have 20 BTP offenders by June 2015. Because the BTP units at OHC and NAC could house 14 additional BTP offenders, DJJ could transfer some of BTP offenders at VYCF to the other BTP programs, leaving as few as six offenders at VYCF. This suggests that, by the time the noncontact visiting booths are constructed in September 2015, DJJ may only need to house a handful of BTP offenders at VYCF. This raises questions about whether the state should invest in permanent infrastructure to service a dwindling population of BTP offenders.
Noncontact Booths Not Needed at Other Facilities. We also note that, despite the fact that OHC and NAC house offenders in the BTP program, neither of these facilities have noncontact visiting booths. The department indicates that neither facility has had difficulty during visiting hours with BTP offenders as has been experienced at VYCF. This raises questions about whether these booths are necessary or if these difficulties could be addressed in other, less costly ways.
LAO Recommendation. We recommend that the Legislature deny the request to construct noncontact visiting booths at VYCF. Given the likelihood that the population of offenders needing these booths will continue to decline, noncontact visiting booths could become largely unnecessary by the time they are completed in September 2015. To the extent that the population of BTP offenders remains at VYCF, we recommend that DJJ use alternative means to provide these offenders with visits. For example, VYCF could consult with NAC and OHC to determine whether strategies used at the northern facilities could be employed at VYCF.
The state works closely with local public safety agencies in several ways to create a cohesive system of state and local law enforcement. Specifically, the state provides funding to local law enforcement through public safety grants administered by various departments (such as the Office of Emergency Services). In addition, the state assists local law enforcement in their efforts. For example, the state’s Commission on Peace Officer Standards and Training (POST) establishes statewide standards for local law enforcement to select and train officers.
After the 2011 realignment, which, as we discuss below, shifted certain state criminal justice functions to local government, the state increased its involvement in local law enforcement in various ways. For example, in recent years, the Board of State and Community Corrections (BSCC) has provided increased assistance to local law enforcement with additional grant programs, and data collection and sharing efforts.
2011 Realignment. As part of the 2011–12 budget package, the state enacted legislation to realign to counties the responsibility for three different felon populations.
- Lower–Level Offenders. The 2011 realignment limited which felons can be sent to state prison, thereby requiring that more felons be managed by counties. Specifically, sentences to state prison are now limited to registered sex offenders, individuals with a current or prior serious or violent offense, and individuals that commit certain other specified offenses. Felons who do not meet these criteria are either (1) required to serve their entire felony sentence in county jail or (2) receive a “split sentence,” in which they spend the initial portion of their sentence in jail and the concluding portion in the community under the supervision of county probation departments.
- Certain Parolees. Before realignment, individuals released from state prison were supervised in the community by state parole agents. Following realignment, however, state parole agents generally only supervise individuals released from prison whose current offense is serious or violent. The remainder are released to the community under the supervision of county probation departments.
- Parole Violators. Prior to realignment, individuals released from state prison could be returned to prison for violating the terms of their community supervision. Following realignment, however, those offenders released from prison—whether supervised by the state or counties—must generally serve their revocation term in county jail.
Impact of Realignment on County Jail Populations. As shown in Figure 20, the statewide jail population has increased by 11,000 inmates since 2011, nearing the peak population of 82,000 inmates that occurred in 2007. Realignment is responsible for most of this increase.
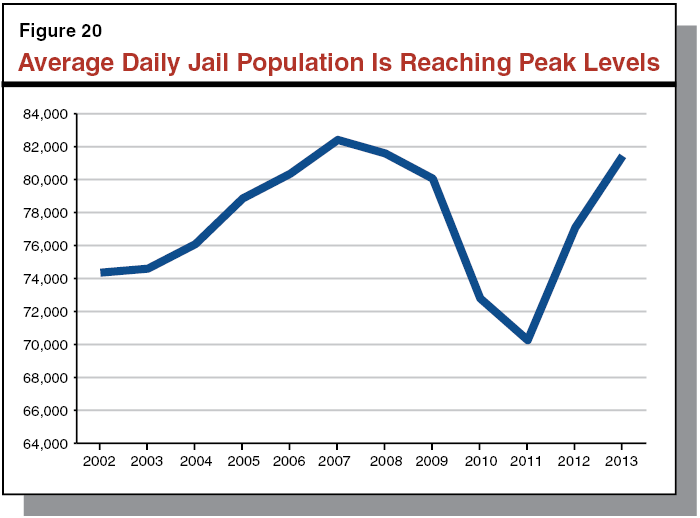
As of June 2013, 56 jail facilities in 25 counties had average daily populations that exceeded their rated capacities. In total, these facilities had 11,500 more inmates than their rated capacity. However, other jails had more capacity than inmates. Specifically, 65 jail facilities in 45 counties had an average daily population below rated capacity. In total, these facilities had 6,000 inmates less than their rated capacity. We note that there are some counties with multiple facilities where one facility may exceed its capacity while another may have available bed space. This typically occurs where the facilities serve different populations (by gender or security need for example) and the counties cannot move inmates between facilities.
We also note that many county jail facilities are under self–imposed or court–imposed population caps. As of June 2013, 39 facilities in 19 counties were operating under either self–imposed caps or court–imposed caps. When such facilities exceed their population caps, they release inmates early. For example, in the first half of 2013, an average of about 13,000 inmates per month were released early.
In addition to changing the number of offenders in county jail, the 2011 realignment changed the type of offenders in jail. Prior to realignment, jails generally held defendants awaiting trial on arraignment and individuals sentenced to serve less than one year in jail. These offenders typically were in jail for relatively short amounts of time. After realignment, however, certain felony offenders began serving all or a portion of their sentence in county jail, rather than in state prison. For example, a 2013 survey conducted by the California State Sheriff’s Association of 52 of the 58 counties found that 44 inmates are currently serving sentences longer than ten years whereas there were none prior to realignment. The most common sentence for these longer–term inmates is drug trafficking.
Since existing jails were not generally designed to house long–term offenders, the longer sentences resulting from realignment create challenges for counties. For example, jails often have only limited space for rehabilitative programs that serve long–term offenders. Jails also often have limited medical facilities to effectively treat long–term inmates with health problems, which can frequently result in inmates being transported to local medical facilities at a significant cost.
State Has Influence Over County Jail Populations. Statutes enacted by the Legislature and Governor establish the body of laws that define crimes and specify the punishments for such crimes. Criminal sentencing law influences the size of county jail populations in two primary ways. First, it defines the types of crimes that are punishable by county jail terms. For example, offenders convicted of crimes that are defined in statute as misdemeanors cannot be sentenced to prison. Similarly, as discussed above, offenders with no prior convictions for serious, violent, or sex offenses who are convicted of nonserious, non–violent crimes are also generally required to serve their sentences in county jail. In addition, criminal sentencing law dictates the amount of time offenders spend in jail. For example, statute limits misdemeanor jail terms to less than one year, and specifies the amount of time offenders convicted of felonies can be required to spend in jail. The state’s ability to control what offenses are eligible for punishment in county jail and the amount of time offenders spend in county jail exerts major influence over the size of county jail populations.
Counties Also Have Significant Influence Over Jail Population. Under current law, various factors at the county level exert significant influence over the size of their jail populations. Some of the primary ways counties can influence the size of their jail population include:
- Sentencing. Although judges are ultimately responsible for the sentences offenders receive, county agencies have significant influence over the sentencing process. For example, probation departments provide presentencing reports to the courts. These reports usually detail the relevant history of the offender (such as prior criminal arrests and convictions, family circumstances, work experience, and educational background) and include a sentencing recommendation. The court uses these reports to make sentencing decisions. In addition, county district attorneys (DAs) can influence sentencing based on how they charge offenders. For example, DAs can decide to charge a crime as a felony or a misdemeanor, with the latter resulting in lesser jail time. In addition, they can seek sentences that result in limited or no jail time. For example, DAs can seek a split sentence or probation in which offenders serve their sentence in the community and are only incarcerated if they violate the terms of their supervision.
- Community Supervision and Revocation. Counties can also influence the size of their jail populations by the manner in which they manage the offenders they supervise in the community. For example, counties can reduce their jail populations through programs aimed at reducing the extent to which the offenders commit new offenses and are returned to jail. In addition, counties also have flexibility in choosing how to punish offenders that violate the terms of their supervision. For example, rather than returning such offenders to jail for extended periods of time, counties can use tools such as flash incarceration, in which a violator is incarcerated in jail for up to ten days. Other alternatives to longer jail terms include electronic monitoring (also known as house arrest) and referrals to programs such as drug abuse treatment programs.
- Pretrial Release. Trial court judges are responsible for deciding whether to release criminal defendants from custody before the courts adjudicate their cases, as well as what conditions to place on that release (such as a requirement to post bail and be supervised). In cases where the judge requires bail, defendants who are unable to pay may be required to stay in jail until their cases are adjudicated. Such individuals (known as “pretrial” defendants”) make up 63 percent of the jail population. Some counties and courts use pretrial risk assessments to determine which defendants could safely be released even if they cannot post bail. These tools typically require staff to collect certain information about the defendant (such as residential history). Most tools then provide a single risk score on the likelihood that a defendant will be rearrested or miss a court appearance. By using such tools to identify pretrial defendants to safely release, counties can significantly reduce their jail populations.
Recent Funding Provided for Jail Construction. In recent years, the state has provided additional funding for jail construction. For example, the Legislature approved Chapter 7, Statutes of 2007 (AB 900, Solorio), which provided $1.2 billion to construct new jails. These funds will add about 10,000 beds to county jails. In addition, in response to the additional pressures created by realignment, the Legislature adopted Chapter 42, Statutes of 2012 (SB 1022, Committee on Budget and Fiscal Review), which authorized an additional $500 million for jail construction. As can be seen in Figure 21, Chapter 42 will add program and medical space to jails as well as about 1,400 additional beds. According to the BSCC, these additional funds were geared mainly toward increasing the ability of counties to provide rehabilitation services rather than increasing county jail capacity.
Figure 21
Overview of State–Funded Jail Construction Projects
(Dollars in Millions)
|
County
|
Award Amount
|
Estimated Additional Beds to Be Constructed
|
Estimated Completion Date
|
|
AB 900a (Phase I)
|
|
Calaveras
|
$26
|
95
|
Completed
|
|
Madera
|
30
|
144
|
Completed
|
|
San Bernardino
|
100
|
1,392
|
Completed
|
|
Solano
|
62
|
362
|
April 2014
|
|
San Luis Obispo
|
25
|
155
|
June 2016
|
|
San Diego
|
100
|
842
|
2016
|
|
Amador
|
23
|
89
|
TBD |
|
San Joaquin
|
80
|
1,280
|
TBD
|
|
Subtotals
|
($446)
|
(4,359)
|
|
|
AB 900 (Phase II)
|
|
Imperial
|
$33
|
232
|
December 2015
|
|
Kings
|
33
|
252
|
April 2016
|
|
Stanislaus
|
80
|
456
|
September 2016
|
|
San Benito
|
15
|
60
|
May 2017
|
|
Kern
|
100
|
822
|
June 2017
|
|
Santa Barbara
|
80
|
376
|
February 2018
|
|
Tulare
|
60
|
514
|
May 2018
|
|
Orange
|
100
|
512
|
November 2018
|
|
Los Angeles
|
100
|
1,024
|
TBD
|
|
Maderab
|
3
|
—
|
TBD
|
|
Monterey
|
36
|
288
|
TBD
|
|
Riverside
|
100
|
1,250
|
TBD
|
|
Siskiyou
|
24
|
150
|
TBD
|
|
Sutter
|
10
|
42
|
TBD
|
|
Subtotals
|
($741)
|
(5,746)
|
|
|
Chapter 42c
|
|
Fresnod
|
$79
|
–200
|
TBD
|
|
Lake
|
20
|
40
|
TBD
|
|
Napa
|
13
|
96
|
TBD
|
|
Orange
|
80
|
384
|
TBD
|
|
Sacramentob
|
56
|
—
|
TBD |
|
San Jaoquin
|
33
|
384
|
TBD
|
|
San Mateob
|
24
|
—
|
TBD
|
|
Santa Barbara
|
39
|
228
|
TBD
|
|
Santa Cruz
|
25
|
64
|
TBD
|
|
Shasta
|
20
|
64
|
TBD
|
|
Solanob
|
23
|
—
|
TBD
|
|
Tehama
|
7
|
64
|
TBD
|
|
Tulare
|
40
|
82
|
TBD
|
|
Tuolomne
|
20
|
198
|
TBD
|
|
Subtotals
|
($480)
|
(1,404)
|
|
|
Totals
|
$1,667
|
11,509
|
|
The Governor’s budget for 2014–15 proposes an additional $500 million in lease–revenue bonds for local jail construction. Under the proposal, counties would be subject to a 10 percent cost–share requirement. However, at the time of this analysis, the administration had not provided much detailed information regarding the proposal. As such, it is unclear what types of projects would be funded with the proposed grants. On the one hand, the administration has suggested that these grants would be used to help alleviate jail overcrowding by building increased capacity, with some priority to county applicants who demonstrate the use of a risk assessment for pretrial defendants. On the other hand, the administration also suggests the grants would be awarded in a manner similar to those authorized in Chapter 42, which focused on program space, rather than additional capacity.
Proposal Lacks Adequate Assessment of Need. It is clear that realignment has resulted in an increase in the county jail population and that some county jails are not currently designed to house long–term offenders. Thus, there is likely a need for funding to support additional county jail projects. However, the administration has not provided a detailed analysis regarding the magnitude of either programming or capacity needs and the extent to which the Governor’s proposal would meet these needs. For example, the administration has not provided an estimate of the number of additional jail beds counties need or the amount of additional rehabilitation program or health service space needed. Although the population currently exceeds capacity at some jails, we note that few of the grant projects funded from Chapter 42 monies have been built yet.
According to BSCC, it received a total of $1.2 billion in grant requests in 2013 for jail construction that it did not fund. Although this information could suggest that the current need for additional jail funding potentially exceeds $500 million, it is insufficient to assess the true extent of the problem. This is because it is unclear whether counties that are requesting additional jail construction funding have:
- Maximized Alternatives to Increasing Jail Space. As discussed above, counties have significant influence over the size of their jail populations. Specifically, counties can use various tools to reduce jail populations, such as split sentences, probation, alternatives to incarceration, rehabilitation programs, flash incarceration, and aggressive pretrial release. Counties can also take other steps, such as contracting for jail space in other county jails. Counties that have not employed such tools may not necessarily need state funds for jail construction to address their jail capacity needs.
- Planned to Make Effective Use of Program Space. It is also unclear on the extent to which counties are requesting funding to build facilities that would be used in an effective manner. In particular, while many counties indicate they need additional program space in their jails, such space may not necessarily be used to deliver programs that can be demonstrated to be effective.
- Identified Local Funding Sources. In addition, it is unclear to what extent counties have attempted to identify local funding sources to address their jail construction needs.
The absence of such analysis make it more difficult for the Legislature to assess what infrastructure needs counties lack and whether the proposed $500 million in the Governor’s budget for jail construction is needed, or if a different amount would be appropriate.
We recommend that the Legislature request additional information from the administration justifying the $500 million in lease–revenue bonds proposed for jail construction. Specifically, we recommend directing the administration to conduct an analysis of the extent to which counties need additional jail funding. Such an analysis should include an assessment of (1) the extent to which counties have maximized use of existing jail space, (2) how effectively counties plan to use any proposed space for rehabilitation programs, and (3) the ability of counties to fund jail construction with local resources.
In order to assist counties with their jail capacity issues, the Governor’s budget proposes that felons with sentences over ten years be required to serve their sentence in state prison rather than in county jail. The administration estimates that this change would increase the state prison population by about 300 inmates annually. The administration also indicates that it may reconsider this policy change depending on the state’s ability to meet the federal court–ordered population cap.
Prison Population Effect Likely Much Larger Than Estimated. The administration estimates that about 300 inmates would be affected by this change. However, this data is based on current county sentencing practices. If this proposal were adopted, counties would have a fiscal incentive to seek longer sentences for defendants as doing so would shift the financial responsibility of these offenders from counties to the state. Moreover, as counties struggle with increased jail populations, longer sentences could also become an easy way to help reduce county jail populations. Accordingly, it is likely that the Governor’s proposal would increase the state prison population by more than 300 offenders annually in the long run. In addition to increasing state costs, we note that the proposal would make it more difficult for the state to comply with the federal court–ordered population cap, as it would be increasing the number of inmates in state prisons.
Reverses Realignment. Additionally, part of the policy rationale for realignment was to make counties responsible for sentencing decisions by making them responsible for the custody of almost all nonserious offenders. This proposal reverses a portion of this outcome and instead allows counties to shift the cost of non–violent offenders onto the state in cases where counties can give offenders sufficiently lengthy sentences.
Potential Sentencing Issues for Some Felonies. The categorization of some felonies as non–violent and nonserious should typically mean that such crimes are punished with shorter sentences than those for serious or violent felonies. However, in some cases, due to specific provisions in sentencing law and the way crimes are prosecuted, offenders convicted of such crimes can receive longer sentences. In other words, although individual nonserious and non–violent crimes may have sentences specified in statute that are significantly shorter than ten years, these felonies can be charged with additional nonserious and non–violent crimes and enhancements that result in an overall sentence length similar to sentences for serious or violent felonies. (We note that many of these longer sentences that are currently being served in county jails are drug offenses—often methamphetamine–related offenses.) This suggests that there is a mismatch between the severity of these sentences and where these sentences must be served.
We recommend that the Legislature reject this proposal. Although county jails are not well suited to house longer–term offenders, in time, counties can adapt to the new population they face following realignment and can limit their long–term jail populations through changes in sentencing practices (such as wider use of split sentences). To the extent the Legislature is concerned about long–term offenders in county jail, it has two fundamental choices. On the one hand, it could place sentencing limits on certain nonserious and non–violent crimes to reduce the incidences of ten year or more jail terms. Conversely, if the Legislature decides such crimes merit lengthy sentences, it could classify such crimes in statute as serious offenses and therefore eligible for prison.
As mentioned above, the 2011 realignment shifted responsibility for housing certain felons from the state to the counties. To reduce the burden on counties of housing these offenders, the 2011 realignment allows judges to sentence these felons to split sentences. Offenders that receive a split sentence spend the initial portion of their sentences in jail and the remaining portion in the community under the “mandatory supervision” of county probation departments. Split sentences reduce jail populations because they reduce the amount of time offenders spend in jail, as well as reduce county costs because mandatory supervision is typically less expensive than jail.
The extent to which counties employ split sentencing varies greatly. For example, judges in 18 counties use split sentences for more than half of eligible felons, while in Los Angeles County, only 5 percent of felons receive them. It is estimated that 28 percent of eligible felons receive split sentences statewide.
The Governor proposes budget trailer legislation to make two statutory changes to split sentencing. Both changes are intended to increase the use of these sentences. We discuss each in greater detail below.
Presumptive Split Sentencing. The Governor proposes legislation to make spilt sentences the presumptive sentence for eligible felons. Under the proposal, any county jail felony sentence would be a split sentence unless the court finds that the facts of the case warrants a straight jail sentence. The proposed legislation also restricts how judges can divide split sentences between jail and mandatory supervision based on the length of the sentence.
- For offenders whose sentences are three years or less, judges would have complete discretion in determining what portion of the sentence is served in jail or under mandatory supervision.
- For offenders whose sentences are more than three years but less than eight years, judges would be required to order at least one year of mandatory supervision.
- For offenders whose sentences are greater than eight years, judges would not be allowed to order mandatory supervision terms that exceed one–third of the total sentence length.
One–Year Enhancement for Mandatory Supervision Felonies. In addition, the Governor’s budget package adds an additional one–year enhancement to all felony sentences in cases where the offender committed the felony while under mandatory supervision.
As discussed above, split sentences can help reduce county jail population and costs. Moreover, split sentences may improve outcomes for some offenders. Specifically, research indicates structured supervision and programs delivered through community supervision can lower recidivism. To the extent that presumptive split sentencing increases the use of mandatory supervision, this could increase the number of offenders subject to structured supervision and programs delivered in the community and improve offender outcomes. In light of this, the administration’s proposal to increase the use of split sentences by making them presumptive merits legislative consideration.
We are concerned, however, about the proposal’s restriction on the ability of judges to determine the appropriate amount of time for offenders to spend on mandatory supervision. According to the administration, community supervision lasting between one and three to four years is consistent with best practices, and yields better results for offenders than shorter or lengthier supervision. However, we have found no evidence that there is an optimal length of supervision. While some research suggests that shorter and more intensive supervision is better than longer and less intensive supervision, it is unclear whether the majority of a sentence is better served in jail or under community supervision.
We also note that adding restrictions on how sentences are split removes additional flexibility from judges. Moreover, data is not readily available on how judges are currently splitting sentences, making it unclear how the proposed restrictions will change the amount of time offenders are spending outside of jail in the community. To the extent the proposed changes result in less mandatory supervision time than is currently being used, the changes could result in additional pressure on county jails.
One–Year Enhancement Could Exacerbate Overcrowding and Is Unnecessary
The Governor’s proposed one–year enhancement for mandatory supervision felonies would result in longer sentences and, thus, increase state prison and county jail populations. The administration assumes that the proposal would increase the rate at which counties and courts employ split sentencing by deterring offenders from reoffending while on community supervision. To the extent that the Governor’s proposal increases the likelihood that offenders receive split sentences, it would result in a reduction in the average daily jail population as such offenders would spend less time in jail than would otherwise be the case under the Governor’s proposal. Similarly, the proposal would reduce the jail population to the extent that it decreased the likelihood that offenders commit new offenses while under mandatory supervision. However, the actual extent to which the proposed change would prompt additional split sentences or lower recidivism rates remains unclear. Thus, it is uncertain the precise net impact that the Governor’s proposal collectively would have on jail operations and costs.
The effect of the proposal on the state prison population is also unclear, though it is less likely to result in a net reduction. On the one hand, the additional punishment could deter offenders from committing new felonies, which could reduce the number of offenders sent to state prison. However, to the extent it does not change offender behavior, it would simply increase state prison populations. This would be problematic because it would exacerbate state prison overcrowding and make it more difficult for the state to comply with the federal court–ordered population cap.
Modify Presumptive Split Sentencing Proposal. We recommend that the Legislature approve the Governor’s proposal to make split sentences presumptive. To the extent that presumptive split sentencing increases its use, it can reduce jail overcrowding and potentially provide better outcomes for offenders. However, in view of our above concerns regarding the proposed restrictions on how sentences could be split, we recommend that the Legislature modify the proposal to eliminate such restrictions. Judges would continue to have the ability to split sentences between jail time and mandatory supervision as they deem appropriate.
Reject One–Year Enhancement Proposal. While we concur with the administration that the state should make sure that counties have the ability to control and reduce the size of their jail populations, we recommend that the state do so without using sentence enhancements that have the potential to create the opposite effect. Accordingly, we recommend that the Legislature reject this proposal. Although a one year sentence enhancement may increase the use of split sentencing, it also may increase jail and prison populations. If presumptive split sentencing does not have a measurable effect on the use of split sentencing, the Legislature may want to request information on why counties are not using split sentences and explore a variety of options that do not risk exacerbating jail and prison population overcrowding issues.
The POST sets minimum selection and training standards for California law enforcement, develops and runs training programs, and reimburses local law enforcement for training. The Governor’s budget includes about $56 million from all fund sources for POST in 2014–15, a decrease of about $5 million (or 8 percent) from the revised estimate of 2013–14 expenditures. Of the total, $40 million would be spent on state operations, such as the development of new officer selection standards, training materials, and training state law enforcement. The remaining $16 million would be spent on local assistance, such as the reimbursement of local law enforcement costs associated with attending POST training (including travel, food, and course tuition).
The POST is funded primarily by the Peace Officers’ Training Fund (POTF), which derives revenue largely from penalty assessments on criminal and traffic fines. As shown in Figure 22, expenditures have exceeded revenues from POTF for several years, resulting in an operating shortfall. This is due to a variety of factors. For example, expenditures from POTF increased when POST decided to increase reimbursement rates to local law enforcement for attending trainings beginning in 2008–09. The commission did this as a way to assist local governments with their budget constraints during the economic downturn. According to the commission, expenditures increased further in recent years due to growth in the number of individuals attending trainings, as local law enforcement budgets became less constrained. The reduction in POTF revenue is also due to several factors, including funding reductions made to law enforcement that may have resulted in fewer fines being issued. For the past several years, a significant fund balance in the POTF was used to address the fund’s operating shortfall. We note, however, that such a fund balance is currently insufficient to fully support planned expenditures in the future.
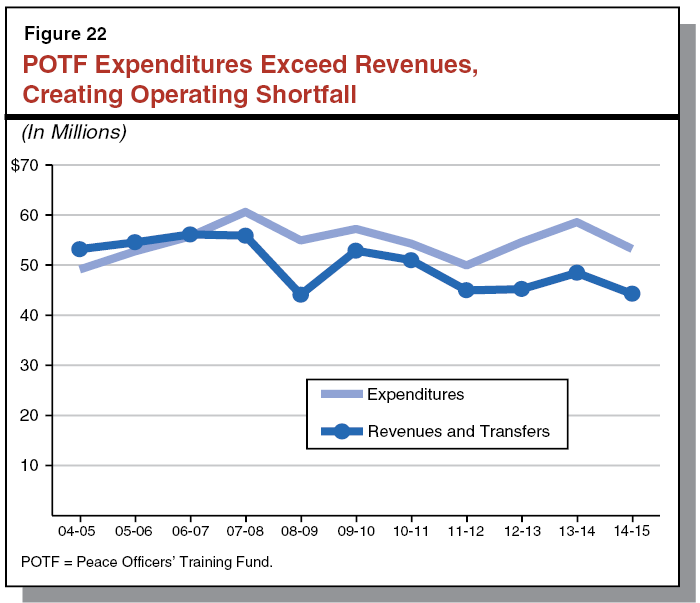
In order to bring expenditures more in line with revenues, POST has reduced services supported by POTF in the current year and plans to continue to do so in the budget year. As reflected in the Governor’s proposed budget, the commission estimates that such reductions will create savings of $1 million in 2013–14 and $7 million in 2014–15. Specifically, as of January 1, 2014, the commission has taken steps to:
- No longer reimburse training costs for attendees who register after registration deadlines and are admitted to courses.
- Reduce the availability of certain courses that are not mandated or part of the core curriculum to 2012–13 levels.
- Suspend all symposia, workshops, and seminars. Although some team–building workshops will continue, the number offered will be reduced. (Previously scheduled workshops will not be cancelled, but must conclude before June 30, 2014. Additional exceptions could be granted by the commission’s executive director.)
- Suspend reimbursements for travel, lodging, commuter lunch, and per diem expenses. However, mandated and contracted training courses are exempted from this suspension.
Despite the above reductions, the proposed expenditures from the POTF are expected to exceed revenues by about $9 million in 2014–15. An expected reserve balance of $11.8 million at the end of 2013–14 would help keep the fund solvent through 2014–15. However, the reserve balance is estimated to be only $2.8 million at the end of 2014–15. Thus, if POST plans to continue the same level of activities in 2015–16, the reserve will not be large enough to cover all of the expenditures for such activities—resulting in the fund becoming insolvent partway through 2015–16.
Because of the possibility that the POTF could become insolvent in the near future, we recommend that the Legislature take steps to further reduce expenditures in the budget year. In order to permanently bring the fund into balance, POST must make additional ongoing reductions of around $9 million annually—equivalent to a 64 percent reduction in local assistance payments beginning in 2014–15. This could be accomplished by eliminating various types of local assistance that POST currently provides. For example, POST could reduce reimbursements to local law enforcement for tuition costs and the salary costs of officers attending training courses.
As mentioned above, POST indicates that law enforcement agencies have begun to send more officers to POST trainings. This could be a sign that local law enforcement budgets have begun to recover. Given this possibility and the limited resources available from the POTF to support training, it seems appropriate for POST to scale back its reimbursements. Although such actions would make training more expensive for local law enforcement, they are necessary to help ensure that the POTF is able to continue to support local law enforcement in the long run.