Fundamental Principle of Public Finance. A central tenet of public finance holds that expenses should be paid for during the year that they are incurred. In the case of annual operating expenses, this means that deferrals and other accounting maneuvers that delay costs should be avoided. In the case of pension and other retirement benefits, this means that costs should be paid for during the employees’ working years. Waiting until employees retire to pay these expenses not only increases the total costs of providing benefits but also imposes these costs on future generations.
Purpose of Report. In some cases, the state has taken actions that allowed it to provide services without at the same time paying for their full costs, creating a liability that must later be addressed. This report provides an overview of these key liabilities—that is, debt, deferred payments, and other liabilities that will affect the state’s financial health in the future. First, we categorize and provide information about California’s key liabilities. Next, we develop a framework for the Legislature to consider in prioritizing how state funds could most effectively be used to pay down these liabilities. Finally, we make recommendations on which liabilities to pay down first and comment on how the state should address these costs in the future.
Determining Scope of Report Requires Significant Judgment. California has many retirement, infrastructure, and budgetary liabilities, and there is no single correct way to itemize them. We have used our best judgment in providing the Legislature with our take on the state’s key liabilities. In general, the state has not paid for the liabilities in this report as costs accrued. The liabilities detailed in this report have some relationship with the General Fund—the state’s main operating account. Specifically, the General Fund must be directly responsible for paying at least part of the cost of a liability or indirectly responsible—meaning that if another funding source were incapable of paying for a liability the General Fund could become responsible in part or in whole. In addition, the report lists two liabilities—pension and retiree health benefits for University of California (UC) employees—for which the General Fund does not have a legal responsibility. Because growing costs associated with these liabilities could result in pressure for the state to provide future General Fund augmentations to UC, the liabilities have an indirect relationship with the General Fund and are included in this report. Appendix 1 provides some additional detail on the scope of this report.
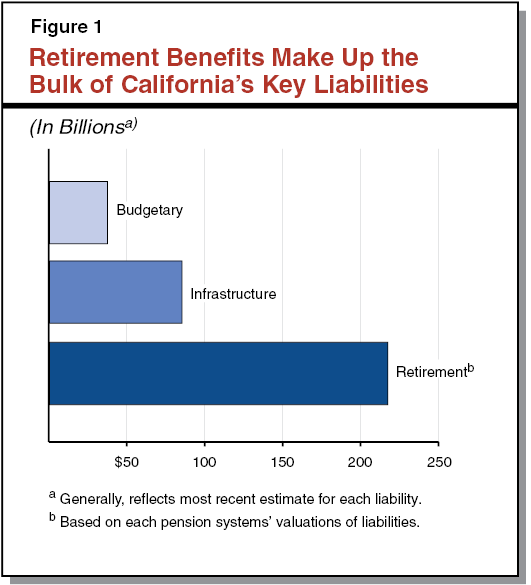
Three Major Categories of Liabilities. California’s liabilities fit into three broad categories—retirement, infrastructure, and budgetary. As shown in Figure 1, the state’s key liabilities total about $340 billion. State retirement liabilities—for pension and retiree health benefits—make up the bulk of that amount.
- Retirement. These liabilities include unfunded liabilities for pension and retiree health benefits for state employees, as well as for pension benefits for the state’s teachers and school administrative personnel. (For the purposes of this report, the term “state employees” includes judges and California State University [CSU] employees but not UC employees. UC employees are addressed in this report separately from state employees.)
- Infrastructure. These liabilities include the principal amount of outstanding general obligation and lease revenue bonds issued by the state to finance capital infrastructure.
- Budgetary. These liabilities include those that the state incurred in recent years to address its budget problems, as well as liabilities arising from typical government operations—such as the value of state worker vacation balances—that have not been funded over time.
Some Key Liabilities Already Being Addressed. Within these three categories, changes to current law and policy are not needed in order for some liabilities to be eliminated in a reasonable manner. For example, recent actions taken by the CalPERS board are expected to increase future employer contributions to the system and aim to eliminate the unfunded liability for its pension program over about 30 years—a reasonable amount of time in our view. On the other hand, some liabilities are at least in part not being addressed and merit further legislative attention. For example, absent corrective action, the CalSTRS pension program is expected to deplete its assets during the 2040s. Additional actions are therefore needed to address this unfunded liability, as well as certain other liabilities. As shown in Figures 2 and 3, most of the state’s key liabilities merit further action in our view.
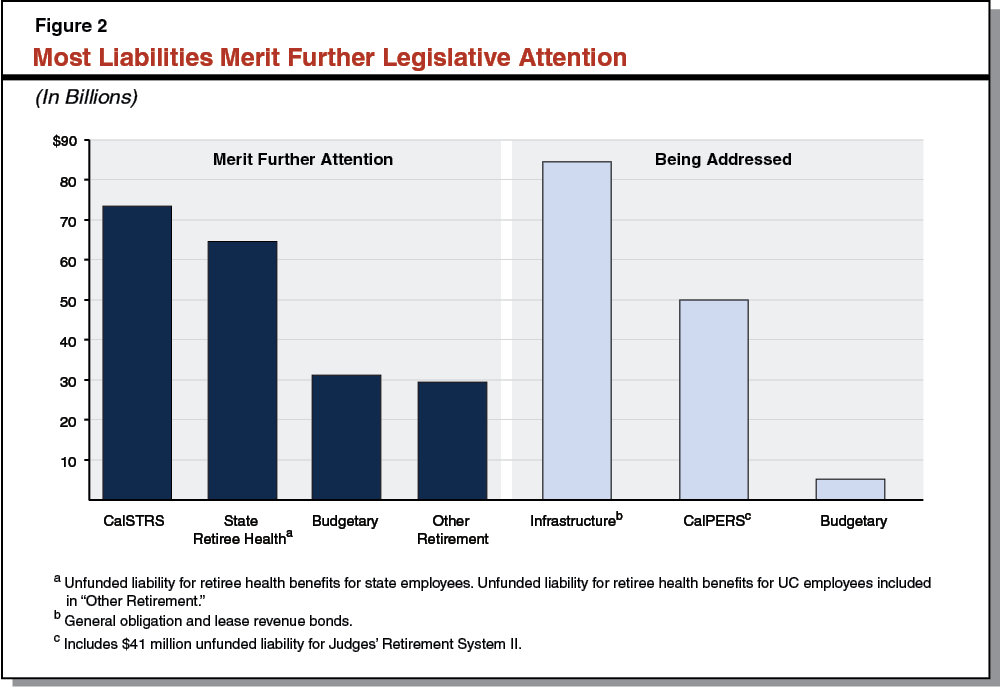
Figure 3
Most Key Liabilities Merit Further Legislative Attentiona
(In Billions)
|
Liabilities That Merit Further Legislative Attention
|
Amount
|
|
Retirement
|
|
|
CalSTRS pension program
|
$73.7
|
|
Retiree health benefits for state employees
|
64.6
|
|
UC pension program
|
13.8
|
|
Retiree health benefits for UC employees
|
12.5
|
|
Judges’ Retirement System I pension program
|
3.3
|
|
Subtotal
|
($167.9)
|
|
Budgetary
|
|
|
School and community college obligationsb
|
$10.0
|
|
Special fund loans to the General Fund
|
4.5
|
|
State worker leave
|
4.1
|
|
Workers’ compensation obligations
|
3.5
|
|
Deferred Medi–Cal costs
|
2.0
|
|
Mandate reimbursements to cities, counties, and special districts
|
1.9
|
|
Salton Sea mitigation and other pollution remediation
|
1.8
|
|
State payroll deferral
|
1.6
|
|
Proposition 98 settle–up
|
1.5
|
|
Unclaimed property
|
0.9
|
|
CalPERS quarterly payment deferral
|
0.4
|
|
Unemployment insurance loan from federal governmentc
|
—
|
|
Subtotal
|
($32.1)
|
|
Total
|
$200.0
|
|
Liabilities That the State Is Addressing
|
|
|
Retirement
|
|
|
CalPERS pension program for state employees
|
$49.9
|
|
Judges’ Retirement System II pension program
|
0.0d
|
|
Subtotal
|
($50.0)
|
|
Infrastructure
|
|
|
General obligation bonds
|
$75.1
|
|
Lease revenue bonds
|
10.2
|
|
Subtotal
|
($85.3)
|
|
Budgetary
|
|
|
Economic recovery bonds
|
$4.6
|
|
Quality Education Investment Act obligation
|
0.4
|
|
Transportation Investment Fund borrowing
|
0.3
|
|
Paterno settlement
|
0.1
|
|
Subtotal
|
($5.3)
|
|
Total
|
$140.6
|
|
Grand Total
|
$340.7
|
How Much Is $340 Billion? The state’s key liabilities listed in Figures 1 through 3 total around $340 billion, a substantial sum. To put that figure in perspective, it is nearly two–and–one–half times the amount of state General Fund and special fund spending in 2013–14. If divided among the state’s residents, the amount of these key liabilities would represent over $8,500 per person. The state’s key liabilities represent nearly one–fifth of California personal income in 2013 (a commonly cited measure of the size of the state’s economy).
General Fund Not Only Source for Addressing Key Liabilities. Figure 4 displays the sources of funding that may be used to address the state’s key liabilities. As shown in the figure, the state’s General Fund will incur all of the costs of addressing some liabilities. In other cases, however, other state funds and even external sources may share in a portion of the costs. For example, depending on how the Legislature and Governor assign responsibility for the $73.7 billion CalSTRS unfunded liability, school and community college districts and teachers may pay a share of the costs. In this and similar cases, the full costs of key liabilities described in this report may not be borne entirely by the state.
Figure 4
Key Liabilities Paid From State General Fund and Other Sources
(Dollars in Billions)
|
|
Liability
|
State General Fund
|
Other State Fundsa
|
Other Possible Sources of Funding
|
|
Liabilities That Merit Further Legislative Attention
|
|
|
|
|
|
Retirement
|
|
|
|
|
|
CalSTRS pension program
|
$73.7
|
Unk.
|
—
|
School districts, teachers
|
|
Retiree health benefits for state employees
|
64.6
|
59%
|
41%
|
State employees
|
|
UC pension program
|
13.8
|
Unk.
|
—
|
UC, UC employees
|
|
Retiree health benefits for UC employees
|
12.5
|
Unk.
|
—
|
UC, UC employees
|
|
Judges’ Retirement System I pension program
|
3.3
|
100
|
—
|
—
|
|
Budgetary
|
|
|
|
|
|
School and community college obligationsb
|
10.0
|
100c
|
—
|
—
|
|
Special fund loans to the General Fund
|
4.5
|
100
|
—
|
—
|
|
State worker leave
|
4.1
|
49
|
51
|
—
|
|
Workers’ compensation obligations
|
3.5
|
65
|
35
|
—
|
|
Deferred Medi–Cal costs
|
2.0
|
100
|
—
|
|
|
Mandate reimbursements to cities, counties, and special districts
|
1.9
|
100
|
—
|
—
|
|
Salton Sea mitigation and other pollution remediation
|
1.8
|
Unk.
|
Unk.
|
—
|
|
State payroll deferral
|
1.6
|
46
|
54
|
—
|
|
Proposition 98 settle–up
|
1.5
|
100
|
—
|
—
|
|
Unclaimed propertyd
|
0.9
|
—
|
100
|
—
|
|
CalPERS quarterly payment deferral
|
0.4
|
100
|
—
|
—
|
|
Unemployment insurance loan from federal governmente
|
—
|
—
|
—
|
Employers, benefit changes
|
|
Total
|
$200.0
|
|
|
|
|
Liabilities That the State Is Addressing
|
|
|
|
|
|
Retirement
|
|
|
|
|
|
CalPERS pension program for state employees
|
$49.9
|
58%
|
42%
|
—
|
|
Judges’ Retirement System II pension program
|
0.0f
|
100
|
—
|
—
|
|
Infrastructure
|
|
|
|
|
|
General obligation bonds
|
75.1
|
83
|
17
|
—
|
|
Lease revenue bonds
|
10.2
|
74
|
26
|
—
|
|
Budgetary
|
|
|
|
|
|
Economic recovery bonds
|
4.6
|
—
|
100g
|
—
|
|
Quality Education Investment Act obligation
|
0.4
|
100
|
—
|
—
|
|
Transportation Investment Fund borrowing
|
0.3
|
100
|
—
|
—
|
|
Paterno settlement
|
0.1
|
100
|
—
|
—
|
|
Total
|
$140.6
|
|
|
|
|
Grand Total
|
$340.7
|
|
|
|
This section of the report details liabilities that are not being addressed (at least in part) and therefore merit further legislative attention.
Retirement
For background information on pension and retiree health benefits—including a description of unfunded liabilities, constitutional protections of vested benefits, and actuarial practices—see Appendix 2 at the end of this report.
CalSTRS
Second Largest Pension System in U.S. Established in 1913, CalSTRS administers retirement programs for 868,000 members—equivalent to about 2 percent of California’s population. CalSTRS members are current, former, and retired teachers and administrators, as well as their beneficiaries.
State Sets Contribution Rates in Statute. A key distinction between CalSTRS and other active pension systems in California is that the Legislature and the Governor set contribution rates for CalSTRS in state statutes. In other pension systems, including CalPERS and the Judges’ Retirement System (JRS) II, the retirement system’s governing board has the authority to change employer contribution rates. These rates are generally based on actuarial valuations such that changes in estimates of unfunded liabilities and normal costs produce changes in employer contributions required to fund these systems.
$6 Billion in Contributions to CalSTRS in 2012–13. In 2012–13, employees contributed 8 percent of their pay ($2.3 billion), districts contributed 8.25 percent of payroll ($2.3 billion), and the state contributed about 5 percent of payroll ($1.4 billion, as measured on a two–year lag).
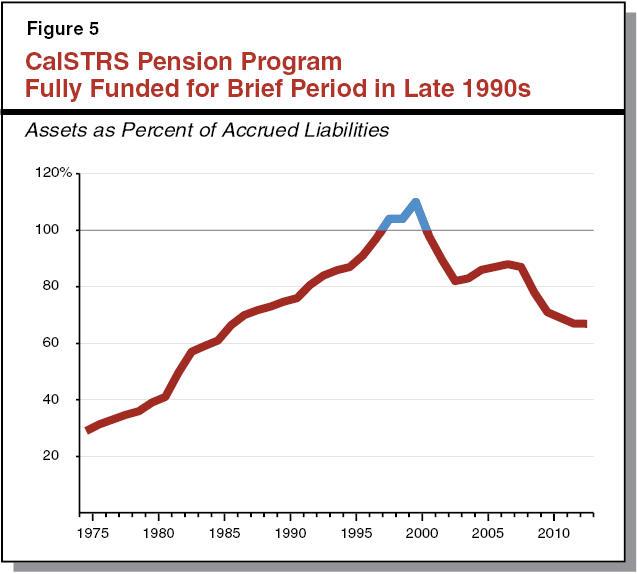
$73.7 Billion Unfunded Liability. CalSTRS has not been appropriately funded for most of its 101–year history. The program was fully funded for a brief period in the late 1990s, as shown in Figure 5. Around that time, the state increased member benefits and reduced the state’s contributions to CalSTRS. These actions, combined with weak investment returns in the early 2000s, produced a $23 billion unfunded liability by 2003. The unfunded liability increased significantly as the system recorded large investment losses during the late 2000s economic downturn and adjusted downward its estimates of future system investment returns. The unfunded liability is estimated to be $73.7 billion as of June 30, 2013.
Unfunded Liability Continues to Grow Despite Strong Investment Returns. Over the past three years, CalSTRS’ annual investment returns have averaged over 12 percent. Despite these strong gains, the unfunded liability has grown 14 percent (from $64.5 billion to $73.7 billion) over the same period, largely due to the underfunding of the system.
Projected to Deplete Assets in About 30 Years. According to its latest actuarial valuation, absent additional contributions to its pension program, CalSTRS estimates that it will exhaust its assets in 2046. If assets are depleted, CalSTRS benefits could only be paid on a pay–as–you–go basis—meaning that benefits would have to be paid for after the employees retire rather than funded during their service years. This would be significantly more costly because the program could no longer use investment returns to pay a portion of the benefits. To prevent this worst–case scenario, additional funding would need to be provided to CalSTRS in the coming few decades.
Over $5 Billion in Additional Annual Contributions Likely Needed. To fully fund the system over a 30–year period, annual contributions from the state, teachers, and districts will likely need to increase by more than $5 billion. This amount assumes a gradual ramp–up of additional contributions starting in 2015–16. This also assumes that the system achieves its 7.5 percent average annual investment return target. The over–$5 billion estimate could prove too high or too low, depending on the details of the funding plan, investment returns, and other actuarial factors.
CalSTRS Unfunded Liability May Be State’s Most Difficult Fiscal Challenge. Assuming a gradual ramp–up of additional contributions, the amounts necessary to fully fund the CalSTRS pension program over a 30–year period would be about the same as the amount of state General Fund spending on the UC and CSU combined. As some of these contributions may come from teachers and districts, addressing the CalSTRS unfunded liability likely will have a significant effect on state and district budgeting. As such, this may be the state’s most difficult fiscal challenge.
Retiree Health Benefits for State Employees
State Covers 277,000 Retirees and Dependents. California provides health and dental benefits to 277,000 retired state employees and their dependents. The state also provides health benefits to active employees, most of whom would be eligible for health benefits in retirement assuming they finish their careers with the state.
For Most State Employees, Eligibility Dependent on Years of Service. State employees hired prior to 1985 receive 100 percent of average state health premium costs at retirement. Most state employees hired since 1985, however, must work a certain number of years before the state will pay 100 percent of the average health premium in retirement. (CSU retirees are one exception—the state will pay 100 percent of average premium costs provided they are eligible for health benefits at retirement.) For state employees hired after 1989, the state pays 50 percent of average premiums at retirement provided they have ten years of service. With each additional year of service at retirement, the state will pay an additional 5 percent of the premium, such that if an employee has 20 or more years of service the state will pay 100 percent of average premium costs. (At 20 or more years of service, the state also pays 90 percent of dependent costs.)
California Governments Generally Do Not Prefund Retiree Health Benefits. Most pension systems invest contributions and use the resulting investment returns to partially fund future costs. Generally, governments in California do not prefund retiree health benefits in this way. Rather, retiree health benefits are funded on a pay–as–you go basis, a significantly more expensive method of paying benefits. This means that governments pay for the costs of benefits when the employees retire rather than as costs accrue during the employees’ service years. These costs therefore are routinely deferred to future generations.
Retiree Health Partially Prefunded for Three Bargaining Units. In 2010, the Legislature ratified labor agreements with three bargaining units—Unit 5 (California Highway Patrol [CHP] officers), Unit 12 (craft and maintenance workers), and Unit 16 (physicians, dentists, and podiatrists)—to begin prefunding retiree health benefits. Employees in these units contribute at least 0.5 percent of their pay and, in the case of Unit 5, the state makes additional contributions. Despite these modest efforts, however, California’s retiree health liability remains virtually unfunded. Specifically, the state has assets sufficient to pay for less than one–tenth of one percent of its $64.6 billion retiree health liability.
$64.6 Billion Unfunded Retiree Health Liability. The state’s unfunded liability for retiree health benefits was estimated to be $64.6 billion as of June 30, 2013 under current public–sector accounting guidelines. This accounting estimate of these unfunded liabilities would be much lower, however, if the state committed to prefund retiree health benefits. This would involve eliminating the unfunded liability over a few decades while at the same time paying for the full cost of the benefits as they accrue. Because investment returns would pay for a much greater share of the cost for providing future retiree health benefits, the accounting guidelines would then allow a higher assumption about investment returns, significantly reducing the estimate of the unfunded liability. Specifically, under a scenario in which the state commits to fully fund retiree health benefits over 30 years, the unfunded liability would fall to $42.5 billion.
Additional $1.8 Billion Needed Annually Under Full Funding Scenario. The state will spend $1.8 billion on retiree health benefits in 2013–14. To fully fund retiree health benefits in 30 years, state spending would have to be twice that amount ($3.6 billion).
UC Retirement Liabilities
UC Pension Program Covers 254,000 Members. The UC Regents created the UC Retirement Plan (UCRP) in 1961. In 2013–14, the UCRP covered 254,000 current, former, and retired faculty and other UC employees, as well as their beneficiaries.
UCRP Historically Well–Funded. . . Figure 6 displays historical funding ratios for the UCRP. Unlike most pension systems in California, the UC pension plan was “superfunded” for about 20 years starting in the late 1980s. This means that the system had over 100 percent of the assets needed to pay future benefits. At its peak around 2000, for example, the UCRP had assets totaling 154 percent of the amount needed to pay the cost of future benefits earned as of that date. Due to UCRP’s exceptional funding status, the UC Regents allowed a “funding holiday” for nearly two decades during which neither UC nor its employees were required to contribute to the retirement plan. (The funding holiday also resulted in the state discontinuing funding to UC for retirement costs for instructional and certain other staff.)
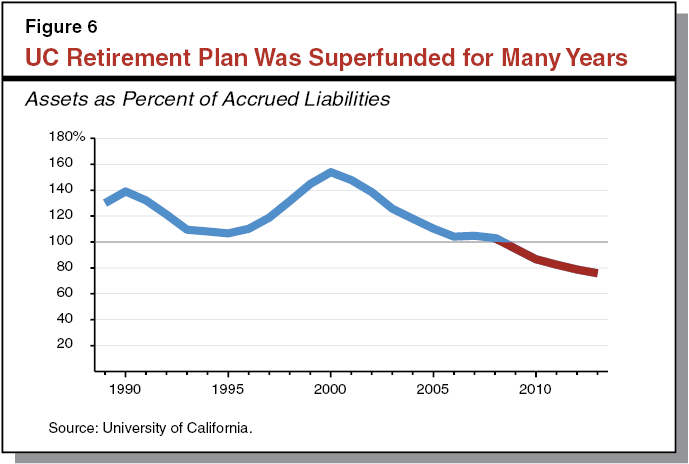
. . .But Funding Holiday Led to $13.8 Billion Unfunded Liability. The 2009 valuation revealed the first unfunded liability for the plan in over two decades. As of July 1, 2013, the system had a $13.8 billion unfunded liability, with 76 percent of the assets needed to pay benefits earned as of that date.
Contributions to UCRP Reinstated in 2009. Effective July 1, 2009, the UC Regents adopted a funding policy to reinstate contributions to the UCRP. Under UC’s funding policy, contributions to the plan have been gradually ramped up. In 2014–15, total funding for the plan will be 22 percent of pay—8 percent from employees and 14 percent from the UC (up from 6.5 percent and 10 percent in 2013–14, respectively). While contributions from employees and the UC combined will exceed estimated normal costs in 2014–15, contributions of around 30 percent of pay are required to address the unfunded liability in 30 years. For this reason, the UC Regents will need to take further actions to increase contributions and finish implementing the funding policy.
$12.5 Billion Unfunded Liability for UC Retiree Health Benefits. The UC provides a choice of health and dental benefits to eligible employees upon retirement. Similar to the state, UC provides retiree health benefits on a pay–as–you–go basis. As of July 1, 2013, the UC’s unfunded liability for retiree health benefits was $12.5 billion.
General Fund Has No Direct Responsibility for UC Retirement Liabilities. The state does not have a legal obligation to provide funding to the UC specifically to pay for its retirement liabilities. As these retirement liabilities consume a larger share of UC’s budget, however, there may be pressure on the state to provide General Fund augmentations to UC, as these rising costs will affect university operations. For example, in the 2012–13 budget, the state provided $90 million for UCRP. UC’s retirement liabilities therefore could affect the state’s future financial health, and that is why they are discussed alongside the other liabilities in this report.
JRS I
System Covers 2,300 Members. Administered by CalPERS, JRS I provides benefits for judges who serve or served on the state Supreme, Appellate, Superior, and Municipal Courts, as well as their beneficiaries. Chapter 879, Statutes of 1994 (SB 65, McCorquodale), closed JRS I to members elected or appointed after November 9, 1994. As of June 30, 2013, only 328 members in JRS I were active—that is, they were still working as of that date.
JRS I Historically Underfunded. For years, JRS I had a severe normal cost deficit—that is, contributions from employees and the state were insufficient to pay the future cost of those members’ benefits. The system provided relatively generous benefits—75 percent of a judge’s final salary at age 60 with only 20 years of service (65 percent with fewer than 20 years of service). By 1993–94, due to insufficient funds in the Judges’ Retirement Fund, the system received a General Fund subsidy of $52.5 million to pay benefits. At that time, the amount of the subsidy was expected to grow to over $200 million by 2001–02. The state General Fund pays JRS I benefits on a pay–as–you–go basis because employer and employee contributions for the remaining employees in JRS I are far below amounts needed to pay current benefits. The state essentially has chosen to fund JRS I on a pay–as–you–go basis now and in the future. As of June 30, 2013, JRS I had an unfunded liability of $3.3 billion, with under 2 percent of the system’s liabilities funded.
Budgetary
Below, we discuss (1) liabilities arising from typical government operations—such as the value of state worker vacation balances—that have not been funded over time and (2) liabilities resulting from actions that the state took in recent years to address its budget problems. In general, these latter budgetary liabilities are similar to those in the Governor’s wall of debt. Figure 7 displays the items in the Governor’s wall of debt that also appear in our list of budgetary liabilities.
Figure 7
Items in Governor’s “Wall of Debt” Included in Our List of Budgetary Liabilitiesa
(In Billions)
|
School and community college obligationsb
|
$10.0
|
|
Economic recovery bonds
|
4.6
|
|
Special fund loans to the General Fund
|
4.5
|
|
Deferred Medi–Cal costs
|
2.0
|
|
Mandate reimbursements to cities, counties, and special districtsc
|
1.9
|
|
State payroll deferrald
|
1.6
|
|
Proposition 98 settle–upe
|
1.5
|
|
CalPERS quarterly payment deferral
|
0.4
|
|
Quality Education Investment Act obligatione
|
0.4
|
|
Transportation Investment Fund borrowing
|
0.3
|
|
Total
|
$27.1
|
Budgetary liabilities are almost all on the spending side of the state budget. For example, payment deferrals achieve a one–time savings by delaying spending into a future fiscal year. The state, however, also took actions on the revenue side of the state budget to address its budget problems. For example, the state accelerated taxpayer payments from future fiscal years to produce a one–time increase in revenues. While these revenue actions are not liabilities, we think that they are similar to payment deferrals and other items on the Governor’s wall of debt. The box below details these revenue actions.
Revenue Actions Also Produced Budgetary Savings
Several Billion Dollars in Tax Accelerations. In the late 2000s, the state changed tax policy to accelerate revenues from future years into earlier years. While these actions provided one–time revenue gains for the General Fund and helped the state balance budgets at that time, they amount to multi–month interest–free loans from taxpayers to the state that now recur annually because they remain a part of state law. For example, the 2009–10 spending plan increased amounts withheld from many public– and private–sector workers’ paychecks primarily to capture $1.6 billion in additional personal income tax (PIT) revenues in 2009–10. In addition, changes in the state’s estimated payment schedule around this time accelerated PIT and corporation tax revenues from the second half of the calendar year to the first half, increasing General Fund revenues by over $2 billion in 2008–09, 2009–10, and 2010–11 combined. These tax payment “accelerations” continue to this day. We estimate that reversing these changes to withholding and estimated payments would have a one–time cost of between $4 billion and $5 billion at the present time.
Recommend Reversal of These Tax Accelerations in the Future. As we discussed in a March 2014 analysis, these tax accelerations were adopted for short–term budget benefit and, in our view, have little or no independent policy rationale supporting them. We recommend that the Legislature reverse these tax accelerations at some point in the future.
$10 Billion in School and Community College Obligations. Beginning in the early 2000s, the state adopted various actions to delay or suspend payments to schools in order to achieve state General Fund savings. By the end of 2012–13, the state had $11.5 billion in these obligations. When the state repays the $1.5 billion in Proposition 98 “settle–up” obligation discussed later in this report, those funds can be used to pay down these obligations. For that reason, we only list $10 billion for this item to avoid double counting. In addition, the state can count spending to repay certain education liabilities toward meeting the Proposition 98 minimum guarantee for funding schools and community colleges. This means that as the amount required to be spent on schools and community colleges grows in the future, the state can allocate some of that growth to repaying these liabilities without committing additional General Fund dollars. For example, the 2014–15 Governor’s Budget proposes to allocate some of the growth in Proposition 98 funding to eliminate all remaining payment deferrals and pay down $188 million of the Emergency Repair Program (ERP) obligation. The following obligations can be repaid within future growth in the minimum guarantee.
- $6.2 Billion in Payment Deferrals. From 2001–02 through 2003–04, the state deferred a total of $1.3 billion in payments to schools and community colleges. These payment deferrals allowed the state to push payments back a few weeks into the following fiscal year—generating a one–time savings for the General Fund—while not affecting the amount of programmatic spending in schools. (The deferrals, however, increased the need for some schools to borrow for cash–flow purposes.) Over four years beginning in 2008–09, the state deferred additional payments to schools and community colleges, with the total reaching $10.4 billion by the end of 2011–12. The 2013–14 budget pays down a total of $4.2 billion, bringing the total to $6.2 billion as of the end of 2013–14. (The Governor’s 2014–15 budget plan proposes to eliminate the remaining deferrals.)
- $4.8 Billion in Mandate Reimbursements to Schools and Community Colleges. Proposition 4 (1979) requires the state to reimburse local governments—including schools and community colleges—for new programs or services that the state requires them to provide. The state began to defer its reimbursement of these costs as it addressed significant budget shortfalls in the early 2000s. Reimbursements owed to schools and community colleges grew in later years, and total $4.8 billion as of April 2013.
- $462 Million ERP Obligation. Williams v. California was a class–action lawsuit filed on behalf of public school students. Plaintiffs argued that instructional materials, facility conditions, and the number of teachers were inadequate in many of the state’s schools. As part of a 2004 settlement, the state agreed to provide $800 million to address repair needs at schools. The administration estimates $462 million of the ERP was outstanding as of the end of 2012–13. (The Governor’s 2014–15 budget plan proposes to pay down $188 million of the ERP obligation.)
$4.5 Billion in Special Fund Loans to the General Fund. Since the early 2000s, loans from special funds helped close General Fund budget shortfalls, generating one–time savings that avoided spending cuts or revenue increases of an amount equal to the loans. The amount of special fund loans outstanding reached $2.4 billion in 2004–05, but fell to roughly $750 million in 2007–08. Borrowing from special funds increased sharply as the state struggled with huge budget shortfalls during the recent economic downturn. As of the end of 2013, the state General Fund owed special funds $4.5 billion. (Because special fund loans represent amounts owed from one state fund to another, it could be said that the amount of state debt for special fund loans nets to zero.) The General Fund is required to repay special funds when needed to ensure the special fund meets the objects for which it was created. Courts have given the Legislature latitude in making determinations about when to repay special funds under this standard.
$4.1 Billion for State Worker Leave Liabilities. When state employees retire or otherwise leave state service, they are able to cash out accrued vacation, annual leave, and other types of paid leave. The state does not set aside funds to pay for state worker leave as employees earn time off. The total amount of accrued leave grew significantly in recent years, as the state used furloughs—unpaid time off work—to reduce employee compensation costs. Specifically, these policies resulted in state employees using most of their additional furlough days and less of their normal leave days than would have otherwise been the case. Because of this, some of the savings resulting from furlough policies will result in costs when employees cash out their banked leave when they either retire or otherwise leave state service. (For additional information regarding the effect of the state’s recent furlough policies, see our March 2013 report, After Furloughs: State Workers’ Leave Balances.) As of the end of 2012–13, the total amount of accrued leave was estimated to be $4.1 billion. (State employees’ unused sick leave can be converted to CalPERS service credit, payments for which the state makes through its routine pension contributions.)
$3.5 Billion in Workers’ Compensation Claims. The state generally self–insures against workers’ compensation claims. In other words, the state generally pays for claims as they are due rather than setting aside funds to cover the cost of future claims by either purchasing insurance or prefunding the liability. This is not unusual, as many other large organizations self–insure against these types of claims, but this pay–as–you–go approach means that the state does not pay for all workers’ compensation costs as injuries occur. The state’s Comprehensive Annual Financial Report (CAFR) includes an actuarial estimate of the cost of future payments to state workers for injuries that have already been incurred. (We discuss the CAFR in the nearby box.) As of the end of 2012–13 the state’s workers’ compensation liability was estimated to be $3.5 billion. (Around 40 percent of the liability is for estimated injury costs that have been incurred but not yet reported.)
State Financial Reporting
Comprehensive Annual Financial Report (CAFR). Each year, the State Controller’s Office works with departments to produce the CAFR. The CAFR generally displays the state’s finances in compliance with generally accepted accounting principles (GAAP) for state and local governments in the United States. The Governmental Accounting Standards Board (GASB)—a nonprofit entity—has a key role in establishing GAAP for state and local governments. The State Auditor’s Office audits the CAFR, and the report is released each spring. The CAFR is the source for a few of the estimates of liabilities listed in this report—including liabilities for state worker leave, workers’ compensation, unclaimed property, and pollution remediation. The CAFR includes other liabilities described in this report, but we instead reflect more up–to–date information from another source. (For example, the State Treasurer’s Office releases data monthly concerning the state’s outstanding general obligation and lease revenue bonds.) In other cases, the CAFR and our report reflect different liabilities, such as in cases where GASB standards differ from common pension valuation practices.
$2 Billion Deferral of Medi–Cal Costs. Another action the state took to mitigate its significant budget problems during the 2000s was to change the accounting basis for the Medi–Cal Program from an accrual basis to a cash basis. An accrual basis of accounting records expenses as they are incurred whereas cash basis accounting records expenses when payments are made. Moving the Medi–Cal Program to a cash basis therefore allowed the state to use payment deferrals for one–time budgetary savings. For example, as part of the 2003–04 budget package, the state delayed payments to Medi–Cal providers for a few weeks into the following fiscal year, thereby providing a one–time savings for the General Fund of $930 million. As of the end of 2012–13, the administration estimates that it would cost $2 billion to revert to the accrual basis of accounting for the Medi–Cal Program.
$1.9 Billion for Mandate Reimbursements to Cities, Counties, and Special Districts. As described earlier, Proposition 4 requires the state to reimburse local governments for new programs or services that the state requires them to provide. In the early 2000s, the state began deferring its reimbursement of these costs due to budget problems and, by 2004, the state owed cities, counties, and special districts about $1 billion. Proposition 1A (2004) requires the state to either (1) pay local governments the costs of all outstanding claims for a mandate or (2) suspend or repeal the mandate. (This prompt repayment requirement does not apply to certain employee relations mandates and obligations incurred before 2004.) As a result, the state has suspended or repealed many mandates to avoid having to pay these costs. Despite these suspensions and repeals, the state owed $1.9 billion to cities, counties, and special districts for mandate claims as of April 2013.
$1.8 Billion for Salton Sea Mitigation and Other Pollution Remediation. Public–sector accounting rules require the state to list in its CAFR the future remediation costs of existing pollution. As of the end of 2012–13, the CAFR lists $974 million in known future remediation costs. Because the state only records costs when a reasonable estimate can be made, future costs likely will exceed current estimates. For example, the 2011–12 CAFR mentioned two remediation sites—a mine and a landfill—that will result in future costs but for which remediation costs were unknown. In addition, state law and an agreement with local governments and other entities requires the state to conduct mitigation activities related to the Salton Sea, with the bulk of expenditures occurring after 2017. Based on a 2006 Natural Resources Agency estimate (and after adjusting for amounts agreed to be paid by local water agencies), a portion of the mitigation costs for the Salton Sea could total roughly $800 million. Similar to the pollution remediation costs reflected in the CAFR, as the state’s mitigation responsibilities become more clear over time, total costs may exceed this amount. The costs for restoration of the Salton Sea—which are more discretionary than mitigation costs—could be much greater. Estimates for restoration activities range from $2.3 billion to $8.9 billion—the latter estimate reflecting the Natural Resources Agency’s preferred alternative as of 2007—and would be conducted over a period of up to 75 years. While future Salton Sea costs would be paid by the state over many years, it is clear that—at the high end of such cost estimates—restoring the sea could rank in the upper tier of the state’s liabilities.
$1.6 Billion State Worker Pay Deferral. The 2009–10 budget package included an ongoing one–month deferral of June state payroll to early July, providing a one–time savings for the state. This accounting action did not affect when paychecks were issued to state employees, but represents costs that the state does not recognize as they accrue. Undoing the payroll deferral would also not affect the timing or amount of state worker paychecks. Based on administration estimates, reversing the deferral would cost $732 million from the General Fund and $866 million from other state funds.
$1.5 Billion Proposition 98 Settle–Up Obligation. The Proposition 98 minimum guarantee for any given fiscal year is based on numerous factors, including General Fund tax revenue and per capita personal income. Estimates of these factors often change after the level of Proposition 98 funding is set in the budget. Sometimes the actual guarantee turns out to be larger than the amount that was included in the budget, meaning the state sometimes owes additional amounts to satisfy past Proposition 98 requirements. This funding shortfall is referred to as a settle–up obligation. The state owed $1.5 billion in Proposition 98 settle–up as of the end of 2012–13. When the state repays this obligation, the funds can be used to pay down school and community college obligations, as described earlier.
$853 Million Unclaimed Property Liability. Since 1959, banks and other companies (“holders”) have been required by law to remit unclaimed property to the state. The most common types of unclaimed property are bank accounts, safe deposit box contents, stocks, and proceeds of insurance policies. Most property is deemed unclaimed when an account has remained dormant for three years and efforts to locate the owner have been unsuccessful. The State Controller’s Office reports that the state’s potential liability for unclaimed property is $6.9 billion in properties belonging to 24.9 million owners. To comply with public–sector accounting rules, the state’s CAFR estimates the amount owners will reclaim in the future. That liability is estimated to be $853 million as of the end of 2012–13.
$431 Million Deferral to CalPERS. The state routinely defers its fourth–quarter contributions to CalPERS to the subsequent fiscal year. This means that the state does not incur each year’s costs until the following fiscal year. The administration estimates that reversing that deferral would have cost $431 million as of the end of 2012–13.
Federal Unemployment Insurance (UI) Loan. The UI program provides weekly payments to workers who are unemployed through no fault of their own. In January 2009, the UI fund became insolvent, meaning that unemployment taxes paid by employers were insufficient to fund UI benefits at that time. California—like 32 other states around that time—obtained loans from the federal government to continue providing unemployment benefits. As of the end of 2013, the state owes the federal government nearly $9.7 billion on these loans. While the state General Fund pays interest each year on the loan, under current law the principal will be repaid in the coming years by employers. (This arrangement is unique among the liabilities discussed in this report.) Specifically, since 2012 federal unemployment tax rates paid by employers have increased incrementally each year, with the resulting revenues applied to the outstanding loan balance. Because under current law employers will repay the $9.7 billion principal, it is not reflected in our earlier figures.
In our November report, The 2014–15 Budget: California’s Fiscal Outlook, we projected that the state would make interest payments totaling over $900 million between 2013–14 and 2019–20, when we estimate the loan to be repaid. While the condition of the UI fund has improved in recent years due to growth in the economy, ideally the loan would be repaid much sooner, allowing the UI fund to build a significant reserve prior to the next recession. (A recession prior to 2020 is quite possible given that the current economic expansion has lasted about five years—the same as the average economic expansion since World War II.) Should a recession occur before the fund is able to build a significant reserve, an increased unemployment rate could quickly return the fund to insolvency. For this reason, we continue to think that tax and benefit changes are necessary to improve the condition of the UI fund. We discuss these possible changes in our October 2010 publication, California’s Other Budget Deficit: The Unemployment Insurance Fund Insolvency.
While the state did not pay for the full costs of retirement and budgetary liabilities listed in this section as they accrued, the state is taking actions each year that are expected to address the liabilities in a reasonable manner over time. In other words, costs to address these liabilities already are reflected in the state budget each year. Similarly, the state makes payments each year to service its infrastructure debt. We think it is reasonable for the state to finance infrastructure over the life of an asset.
Retirement
CalPERS
Largest Public Pension System in U.S. With assets totaling over $275 billion, CalPERS is the nation’s largest public pension fund. CalPERS administers retirement programs for over 3,000 state and local employers. This report, however, concerns retirement programs that CalPERS administers on behalf of the state. Specifically, CalPERS administers benefits for 589,000 current, former, and retired state employees, as well as their beneficiaries. These include CSU employees.
Employer Contributions Determined by CalPERS Board. In contrast to CalSTRS (the contributions to which are set in statute by the Legislature and Governor), employer contributions to CalPERS are set by the CalPERS board. Specifically, each year the CalPERS board adopts contribution rates based on its most recent actuarial study. The Legislature and Governor have no direct control over the employer contributions to CalPERS.
$5.1 Billion in Contributions. Based on CalPERS valuation estimates, in 2013–14 the state and its employees will contribute a total of $3.8 billion and $1.3 billion to CalPERS, respectively. The state contribution is funded from both the General Fund and other state funds. In 2014–15, the administration estimates that the General Fund will pay 58 percent of the state contribution, while other state funds will provide the remaining 42 percent.
Recent Changes Expected to Improve Funding Status Over Time. Recently, the CalPERS board voted to change its actuarial practices, resulting in increased employer contributions. Specifically, employer rates are expected to increase significantly over the next several years. Employer rates differ for various groups of state employees, but for State Miscellaneous Tier 1 employees—a group that represents the majority of state employees—the rate was set for 24.3 percent of pay for 2014–15. (The 2014–15 rate is much higher for the State Peace Officers and Firefighters and CHP groups—36.8 percent and 43.5 percent, respectively. These rates include additional contributions the state has opted to make to offset recently increased employee contributions and pay off unfunded liabilities.) The new practices aim to fully fund the system—thus eliminating the unfunded liability—in about 30 years. In our view, this is a reasonable amount of time over which to address unfunded pension liabilities.
State Unfunded Liability Totals $49.9 Billion. As of the end of 2012–13, the state’s unfunded liability for state employee pension benefits was $49.9 billion, with 66 percent of the assets needed to pay benefits earned as of that date. Figure 8 displays the historical funded status of the CalPERS pension program. While the CalPERS and CalSTRS pension programs had similar funded ratios as of the end of 2012–13, an important distinction is that CalPERS aims to address its unfunded liabilities over the coming few decades, whereas current law provides no means for CalSTRS to address its unfunded liabilities.
JRS II
System Covers 1,400 Members. Similar to JRS I, JRS II is administered by CalPERS and provides benefits to judges and beneficiaries. Nearly all of the system’s 1,400 members were active judges as of June 30, 2013.
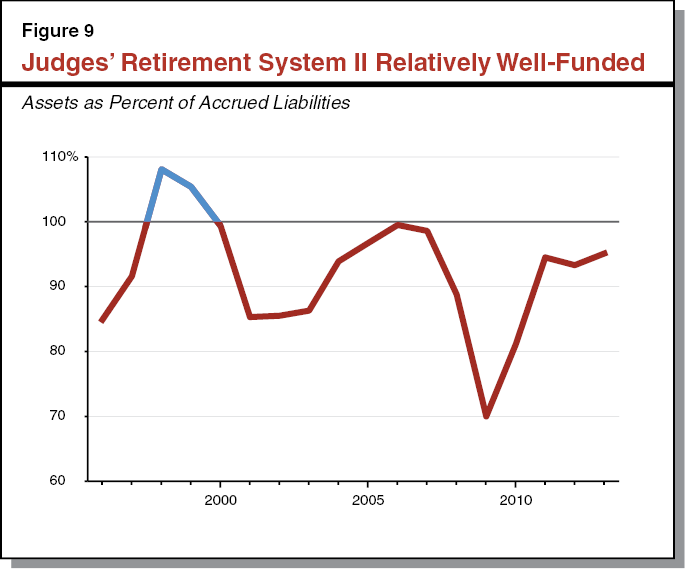
Actuarially Sound Pension Program. As described in the previous section of this report, contributions to JRS I were insufficient to pay benefits. Chapter 879 closed JRS I to new members and created JRS II, an actuarially sound system in which members are required to work until a later age to receive the same level of benefits. The major difference between the two systems, however, is that the employer contribution to JRS I is 8 percent of pay whereas the contribution to JRS II is based on actuarial estimates and changes every year. That rate was set at 24.6 percent for the 2014–15 fiscal year. The actuarially determined state contribution is a key factor in the relative health of the JRS II system shown in Figure 9, and is the reason that no additional actions are required to eliminate the small JRS II unfunded liability. As of June 30, 2013, the JRS II unfunded liability was only $41 million, with 95 percent of assets needed to meet liabilities already on deposit with CalPERS.
Infrastructure
General Obligation and Lease Revenue Bonds
Most Infrastructure in California Financed Using Bonds. Decades ago, the state funded many of its infrastructure projects on a pay–as–you–go basis. This meant that taxes and fees were used to pay for infrastructure when it was built, rather than financing construction costs over many years. Over time, bonds became the state’s predominant tool with which to finance infrastructure. By the 2000s, California issued bonds to finance about two–thirds of its infrastructure spending. (The other third was funded on a pay–as–you–go basis, mostly funded by transportation revenues deposited into special funds.)
Two Types of Bonds Used. California issues two main types of infrastructure bonds—general obligation bonds and lease revenue bonds. Investors buy these bonds, and the state uses the proceeds to finance infrastructure projects, including highways, bridges, higher education facilities, water infrastructure, prisons, health care facilities, and government buildings. The state pays principal and interest payments to investors in most cases over a period of around 30 years, meaning that the Legislature and the Governor do not need to take additional actions for the bonds to be addressed (though they could choose to accelerate repayment of the bonds). The General Fund and, to a much lesser extent, special funds incur costs each year to service these debts.
$75.1 Billion in General Obligation Bonds. The state pledges its “full faith and credit” to repayment of general obligation bonds. General obligation bonds are placed on the ballot either through the initiative process or by the Legislature with a two–thirds vote and must be approved by a majority of the state’s voters. General obligation bonds make up most of the state’s bond debt. As of April 1, 2014, $75.1 billion in general obligation bonds were outstanding.
$10.2 Billion in Lease Revenue Bonds. Lease revenue bonds are repaid by the state department that uses the facility for which the bonds are issued. One–third of lease revenue bonds outstanding today finance facilities at the Department of Corrections and Rehabilitation, and another 10 percent are for CSU facilities. The annual debt–service payments come from the departments’ operating budgets, most of which are funded from the General Fund. Unlike general obligation bonds, lease revenue bonds are not backed by the state’s full faith and credit. For this reason, lease revenue bonds tend to have slightly higher interest and issuance costs, meaning they are a more expensive way to borrow money. They are also a much smaller component of the state’s infrastructure debt—as of April 1, 2014, $10.2 billion in lease revenue bonds were outstanding. Lease revenue bonds do not require voter approval and can be approved by a majority vote of the Legislature.
Bonds Authorized but Not Yet Sold. The amount of currently outstanding bonds does not include about $31 billion in general obligation and lease revenue bonds that have been authorized but not yet issued, meaning the state has not yet sold the bonds to investors. A large share of this—about $23 billion—is from the nearly $54 billion in bonds that were authorized by voters in 2006 and 2008. When these bonds are sold they will increase the state’s liability for general obligation and lease revenue bonds reflected in our earlier figures.
Growing Backlog of Deferred Maintenance Could Increase Demand for Bonds in Future. Shortly after the release of the 2014–15 Governor’s Budget, the Governor released the first five–year infrastructure plan since 2008. In the plan, the administration estimates that the state has deferred maintenance equal to $64.6 billion, over 90 percent of which is for the state’s highways. Defining which projects are categorized as deferred maintenance is difficult, however, and reasonable estimates of the state’s deferred maintenance backlog can vary significantly. The reason that deferred maintenance is related to the state’s liabilities is that it represents routine and scheduled maintenance that was deferred to the future. The state would not have deferred maintenance if it spent the amounts necessary each year to keep its assets in good condition. Over the years, however, the state has not fully funded its necessary maintenance needs each year, contributing to a growing deferred maintenance backlog.
Delaying maintenance on the state’s infrastructure can result in higher maintenance or replacement costs in the future. Deferring maintenance therefore increases future maintenance costs and—in the worst cases—reduces the useful life of the asset. In these latter cases, deferring maintenance increases the demand for infrastructure bonds or other costs in the future.
Budgetary
$4.6 Billion of Economic Recovery Bonds (ERBs). Proposition 57 (2004) authorized the state to sell up to $15 billion in bonds to finance past budget deficits. Roughly three–quarters of these bonds were issued in 2004, and some were issued in 2008, for a total of nearly $15 billion. Proposition 57 created a complex financing mechanism—known as the “triple flip”—that dedicated a part of the local sales tax to repay the ERBs. That mechanism will remain in effect until the bonds are repaid, meaning that no additional action is needed from the Governor and the Legislature to service these bonds. The 2014–15 Governor’s Budget, however, proposed to deposit 3 percent of General Fund revenues into the state’s rainy–day reserve. The State Constitution requires half of that deposit be used to accelerate payments on the ERBs. Under that plan, the administration expects the ERBs to be repaid in 2015. There is no provision in law that would allow similar bonds to be issued in the future.
$410 Million Quality Education Investment Act (QEIA) Obligation. In response to the 2004–05 suspension of the Proposition 98 minimum guarantee and a related settle–up obligation in 2005–06, the California Teachers Association (CTA) sued the state, claiming the state underfunded K–14 education by $2.8 billion in those years. In 2006, the administration reached a settlement with CTA, agreeing to provide $2.8 billion to schools and community colleges under the QEIA over seven years beginning in 2007–08. (Because the settlement related to the underfunding of Proposition 98, amounts provided under QEIA are from the General Fund and are in addition to Proposition 98 requirements.) As of the end of 2012–13, the state owed $410 million, with the balance expected to be repaid in 2014–15.
$251 Million in Transportation Investment Fund (TIF) Borrowing. Proposition 42 (2002) required the state to transfer revenue from the sales tax on gasoline to the TIF. The state was allowed to suspend these transfers and use the funds for other budgetary purposes. The 2003–04 and 2004–05 budgets suspended $2.1 billion in such transfers. The 2006–07 budget repaid roughly two–thirds of that balance. Shortly thereafter, Proposition 1A (2006) required that the remaining balance ($754 million) be repaid by the end of 2015–16. The state has been making annual payments of $83 million since 2007–08. As of the end of 2012–13, $251 million was owed to the TIF. The administration expects the balance to be repaid by 2015–16.
$86 Million Paterno Settlement Obligation. In 1986, a levee in Yuba County breached, flooding homes and businesses. About 2,600 affected parties filed suit against the state, and in 2003 a state appellate court found the state liable. The state eventually reached a $464 million settlement with the plaintiffs. The 2005–06 spending plan used a ten–year financial arrangement (similar to a “judgment bond”) to finance the Paterno settlement. This action achieved $361 million in General Fund savings at the time, but resulted in the state paying more than this amount over the ensuing ten–year period. As of the end of 2012–13, the state owes $85.6 million in principal under this transaction, with the last payment scheduled for June 2015.
This section develops a framework for the Legislature to consider in prioritizing how state funds could be used to most effectively pay down key liabilities. In our view, it is in the state’s interest to address the liabilities in this report at some point in the future. Because the state does not have the resources to immediately address all of them, however, the state must set priorities about which liabilities to repay. In general, we suggest priority be given to paying down those liabilities that result in the greatest benefits. We assess these benefits by looking at characteristics of the liabilities—including (1) the rate at which they grow and (2) whether addressing them also benefits groups or entities other than the state government.
Some Liabilities Excluded From Framework. Liabilities that are already being addressed merit little additional legislative attention. In addition, as the amount required to be spent on schools and community colleges under Proposition 98 grows in the future, the state can allocate some of that growth to pay down school and community college liabilities, including payment deferrals, mandate reimbursements, and the ERP obligation. The Governor, for instance, proposes paying down school payment deferrals in his 2014–15 budget plan in this manner. Because future decisions about how to repay these items will depend on available resources in the Proposition 98 budget, the state’s elected leaders will have a separate conversation about these liabilities. For a discussion of the relative trade–offs of paying down school and community college liabilities, see the “Wall of Debt Plan” section of our February 2014 report, The 2014–15 Budget: Proposition 98 Education Analysis.
Growth Rates of Key Liabilities
Growth Rates. In Figure 10, we make some rough estimates about how much liabilities will tend to grow over time. In effect, these rates reflect the interest—or carrying—cost associated with these liabilities. The growth rates reflected in Figure 10 apply to amounts outstanding at a certain point in time and do not attempt to predict how future actions could change those amounts.
Figure 10
Rough Estimate of Growth Rates for Key Liabilitiesa
(Dollars in Billions)
|
Liability
|
Growth Rates
|
Amount
|
|
Retirementb
|
|
|
|
CalSTRS pension program
|
7.5%
|
$73.7
|
|
Retiree health benefits for state employees
|
4.3
|
64.6
|
|
UC pension program
|
7.5
|
13.8
|
|
UC retiree health benefits
|
5.5
|
12.5
|
|
Judges’ Retirement System I pension program
|
4.3
|
3.3
|
|
Subtotal
|
|
($167.9)
|
|
Budgetary
|
|
|
|
Special fund loans to the General Fund
|
0.7%c
|
$4.5
|
|
State worker leave
|
Growth of state worker payd
|
4.1
|
|
Workers’ compensation obligations
|
3.5
|
3.5
|
|
Deferred Medi–Cal costs
|
—e
|
2.0
|
|
Mandate reimbursements to cities, counties, and special districts
|
0.3
|
1.9
|
|
Salton Sea mitigation and other pollution remediation
|
0.0
|
1.8
|
|
State payroll deferral
|
Growth of state worker payd
|
1.6
|
|
Proposition 98 settle–up
|
0.0
|
1.5
|
|
Unclaimed property
|
0.0
|
0.9
|
|
CalPERS quarterly payment deferral
|
Growth of state worker payd
|
0.4
|
|
Unemployment insurance loan from federal governmentf
|
—g
|
—
|
|
Subtotal
|
|
($22.1)
|
|
Total
|
|
$190.0
|
Liabilities Grow at Very Different Rates. As shown in the figure, these liabilities tend to grow at very different rates. Left unaddressed, retirement liabilities tend to grow—over the long run—at a rate similar to their assumption for investment returns. This is because each year the state delays action on unfunded retirement liabilities, the state loses another year of investment returns under the actuarial assumptions, an amount that compounds over time. On the other hand, most budgetary liabilities are either fixed or grow at comparatively low interest rates.
Left Unaddressed, Retirement Liabilities Present Long–Term Risk to Budget. In general, retirement liabilities grow much faster than budgetary liabilities. Delaying action to address the state’s retirement liabilities means that overall costs will be much greater when the state ultimately takes action. For this reason, retirement liabilities present significant long–term risks to the state budget—the longer they remain unaddressed, significantly fewer budgetary resources will be available for other purposes in the future. Because of these long–term risks, growth rates are in our view an important factor for the Legislature to consider when prioritizing the pay down of key liabilities.
Benefits to Employers, Individuals, and Local Governments
Addressing Most Key Liabilities Results in Benefits to These Groups. Paying down most of the state government’s liabilities benefits other entities and groups, including local governments (including schools and community colleges) and individuals. Because some liabilities have similar growth rates, evaluating the benefits that accrue to these groups from paying down key liabilities can be a secondary factor to consider in determining how to prioritize liabilities.
Mandates, Proposition 98 Settle–Up Benefit Local Governments. Paying down the mandate backlog and Proposition 98 settle–up obligations would result in one–time revenue for local governments, including schools and community colleges. These actions would increase budgetary flexibility for local governments, and could result in one–time spending or tax relief, which would then benefit others.
Repaying Certain Special Fund Loans Results in Greater Benefit Than Others. Repaying a special fund loan increases the balance available in that fund. In some cases, those balances could be spent—increasing services to groups for which the fund was created—or used to reduce fees and charges, thereby helping to ensure that fee payers are not overcharged.
Funding Retirement Liabilities Decreases Risk to Public Sector Employees and Retirees. Making additional contributions to retirement systems results in more secure retirement funding (either pensions or retiree health benefits) for program participants and beneficiaries. The state and other governmental entities often have contractual commitments to ensure that pension funds are soundly funded over the long term.
Other Liabilities Have Little Effect on Other Groups. Repaying some other key liabilities would produce little to no tangible benefit for other groups. For example, reversing the state payroll deferral would not result in any change to the timing or amount of state employee paychecks.
Other Considerations
Public Confidence in Government. In general, the liabilities listed in this report reflect cases where the state did not pay for its costs as they accrued. These liabilities diminish public confidence in government—for example, some recent cost deferrals were seen by some to be accounting gimmicks. Consequently, addressing the items listed in this report may improve public confidence in government. In addition, getting the state’s fiscal house in order would likely be seen by bond investors and rating agencies as positive. This could result in an improvement to the state’s credit rating and therefore could reduce future state borrowing costs slightly.
Suggested Approach
Figure 11 summarizes our suggested approach for prioritizing repayment of the state’s key liabilities and how the state should address these costs in the future. As noted throughout this report, some liabilities—such as the state’s infrastructure and CalPERS liabilities—are already being addressed. Moreover, as noted in Figure 11, the Governor’s 2014–15 budget proposal would address other liabilities, such as school payment deferrals and the state’s ERBs.
Figure 11
Suggested Approach on State’s Key Liabilities
|
Implement Key Liability Provisions of Governor’s 2014–15 Budget Proposal
|
- These include the Governor’s proposed paydown of school and community college payment deferrals in his 2014–15 budget proposal.
|
- The state’s economic recovery bonds and some special fund loans also are repaid in the Governor’s 2014–15 budget proposal.
|
|
Address CalSTRS as a Top Priority
|
- Fully funding the CalSTRS pension program over about 30 years is crucial.
- Will require significant ongoing annual funding.
|
|
Then Address Other Liabilities
|
- State retiree health benefits involve large costs that should be paid (prefunded) as workers accrue benefits during their careers.
- Would require ongoing annual funding.
|
- Prioritize other budgetary liabilities with high growth rates or that produce benefits for other entities or groups. In some cases, these could be paid from one–time state revenues.
- Mandate reimbursements.
- Proposition 98 settle–up.
- Certain special fund loans.
- Salton Sea mitigation.
- Unemployment insurance tax and benefit changes.
|
- Consider state’s role in addressing UC retirement liabilities.
|
- Establish longer–term goal of prefunding budgetary liabilities where possible.
- State worker leave.
- Workers’ compensation.
- Unclaimed property.
- Other pollution remediation.
|
|
How to Address Liabilities in the Future
|
- Going forward, key goal of state budgeting to pay for costs as they accrue.
|
- Address key liabilities without intent to incur them again. Building budget reserves when times are good is key method to make this goal more realistic.
|
Make CalSTRS Top Priority. Due to its massive unfunded liability and relatively fast growth rate, we recommend that the Legislature make the CalSTRS pension program a top priority in addressing the state’s key liabilities. We recommend that the Legislature aim to fully fund the system in about 30 years. Doing so will be difficult. Depending on the funding arrangement, the additional contributions from the state, teachers, and districts combined could total over $5 billion per year by the early 2020s, similar to the amount of current state funding for the two university systems combined. For each year of delay in implementing a funding plan, CalSTRS loses another year of investment returns, which compound over time, making addressing the funding shortfall more costly the longer we wait. The most important action the state can take to minimize costs is to act quickly to increase contributions. As we noted in our January 2014 publication, The 2014–15 Budget: Overview of the Governor’s Budget, it would be smart to set aside money during the 2014–15 budget process in anticipation of higher state costs under a long–term CalSTRS funding plan.
Prefunding Retiree Health Benefits for State Employees. Among the state’s other key liabilities, retiree health liabilities for state employees present a difficult challenge. Despite modest efforts in recent years to begin prefunding retiree health benefits for state workers, the state has virtually no assets on hand to pay for $64.6 billion of estimated unfunded liabilities. Committing to a plan to prefund retiree health benefits for state employees over 30 years would cost an additional $1.8 billion annually. (About $1.1 billion of this amount would be paid from the General Fund, with other state funds paying for the rest.) While this is a significant sum, using investment returns to pay for these benefits would dramatically reduce state costs over the long run. For this reason, we recommend making retiree health a key priority after CalSTRS from ongoing revenues that are available to address these liabilities.
Approach Could Mean Fewer Resources for Addressing Wall of Debt. Addressing the CalSTRS liability and some or all of the retiree health unfunded liabilities would mitigate two of the greatest long–term risks to the state budget. In the near term, however, addressing both of these liabilities would mean fewer resources available for other priorities—including building budget reserves and paying down the rest of the Governor’s wall of debt. Because CalSTRS and retiree health liabilities tend to have higher interest rates than the items on the wall of debt, failing to prioritize CalSTRS and retiree health would increase budgetary risk in the longer run, as addressing these retirement liabilities would become significantly more costly in the future. Similarly, UC’s pension and retiree health liabilities could pressure the university’s finances—and potentially the state budget—if they persist. As the Legislature considers which budgetary liabilities to repay, we suggest prioritizing remaining resources for addressing certain liabilities, as described below.
Prioritize Budgetary Liabilities With High Growth Rates or That Benefit Others. Budgetary liabilities often involve no ongoing commitment of state funds. This means that they can be repaid from one–time influxes of state revenues. Among budgetary liabilities, our sense is that addressing mandate reimbursements, Proposition 98 settle–up, and some special fund loans would be the best use of budgetary resources in the near term. While mandate and Proposition 98 settle–up liabilities do not grow quickly, repaying these items would increase budgetary flexibility for local governments. Addressing the significant environmental problems facing the Salton Sea would benefit nearby residents and local governments. Finally, among special fund loans, we advise the Legislature to be selective in choosing which loans it repays first. Naturally, any special fund facing budgetary problems must be repaid to ensure the fund has sufficient cash on hand. Aside from that constraint, we suggest repaying loans with higher interest rates or where the special fund proceeds could be directed toward legislative priorities (for example, reducing a backlog in a department’s safety inspection workload).
UI Loan Also Merits Attention. While under current law the principal on the UI loan will be repaid in the coming years by employers through increased revenues related to the federal unemployment tax credit, the state incurs substantial interest costs related to the loan. (As discussed earlier, in our November 2013 report, The 2014–15 Budget: California’s Fiscal Outlook, we forecasted that state interest payments on the UI loan would total over $900 million between 2013–14 and 2019–20.) Addressing the UI fund insolvency—through a combination of tax and benefit changes—could produce a greater interest savings than addressing budgetary liabilities with slower growth rates.
Prefunding Could Reduce State Costs Over the Long Run. Historically, the state’s efforts to prefund liabilities has been focused on pension and retiree health programs. Prefunding other liabilities, however, would allow the state to use investment returns to partially pay the costs. To illustrate, according to CalSTRS, 58 percent of resources used to pay benefits from 1984–85 through 2011–12 were generated from investment returns. Absent those returns, teachers, districts, and the state might have had to contribute more than twice what they contributed during those years to provide the same level of benefits. This is also the reason why committing to a full funding plan for the state’s retiree health liabilities would result in the estimate of the unfunded liability for those benefits decreasing from $64.6 billion to $42.5 billion.
The amount of savings would vary depending on the liability. (In general, because of the long–term nature of retirement liabilities, the state could probably use investment returns to pay for more of a retirement liability than a budgetary liability.) But, prefunding these liabilities could significantly reduce long–term costs. For this reason, we think that the idea of prefunding additional liabilities—including state worker leave, workers’ compensation, unclaimed property, and pollution remediation liabilities—merits legislative consideration. For some of these liabilities, there may be administrative challenges that would make prefunding difficult or impractical, but the potential savings may outweigh these challenges.
Going Forward, Pay for Operating Costs as They Accrue. In the future, we suggest establishing a goal of paying for all operating costs as they accrue. This means avoiding questionable actions used in the past to address budget shortfalls, such as payment deferrals and accounting maneuvers. This also means funding retirement benefits as employees earn them, rather than deferring costs for pension and retiree health benefits to future generations. And it means funding normal maintenance costs each year to avoid any further build–up of deferred maintenance.
Address Key Liabilities Without Intent to Incur Them Again. In our November 2013 report, The 2014–15 Budget: California’s Fiscal Outlook, we projected continued improvement in the state’s budgetary condition. While that improvement is dependent on a continued economic expansion and restraint in making ongoing spending commitments, we believe the state has an opportunity now and perhaps in the next few years to make significant progress in addressing the liabilities detailed in this report. Doing so would result in a significant improvement in the long–term fiscal health of the state. Inevitably, the state will face another economic or budgetary downturn. When such a downturn occurs, the state should avoid creating similar budgetary liabilities again. By building budget reserves when times are good, the state can place itself in a position where this goal is more realistic.
In general, the state has not paid for the liabilities in this report as costs accrued. In addition, these liabilities have a relationship with the General Fund. As such, the following types of liabilities are excluded from this report.
- Near–Term Liabilities. This report excludes “current” liabilities that can be characterized as normal operating expenses paid for in the year in which they accrue. For example, amounts owed to utilities for phone, Internet, or other services are excluded.
- Local Government Liabilities. The purpose of this report is to provide background on the state’s key liabilities. As such, this report excludes local government liabilities. For example, we exclude the portion of the California Public Employees’ Retirement System unfunded liability attributable to local governments for their pension programs.
- Leases and Other Contracts. The state has over 900 leases for 13 million square feet of state office space. In addition, the state has entered into contracts with various entities to provide services. Because of incomplete data concerning the state’s leases and contracts, we have excluded these items from this report. If an amount were listed, however, it would appear in the “Liabilities Being Addressed” section of this report because the state generally pays these costs as they accrue.
- Revenue Bonds. This report excludes revenue bonds because they are generally repaid from non–General Fund revenue sources. For example, general obligation bonds issued under the veterans’ home loan program are repaid using monthly payments from veterans. Because these payments have always been sufficient to service the bonds—meaning that the state has never incurred costs for the bonds—we exclude them from this report. Similarly, we exclude revenue bonds issued by the University of California and California State University because—in general—dedicated revenue streams at the universities repay these bonds.
- Interest and Similar Costs Not Included. This report does not attempt to quantify what the state will eventually pay to retire these liabilities. Instead, amounts listed in this report reflect point–in–time estimates of amounts owed. This is the standard way that liabilities are discussed in accounting. For example, this report reflects the principal owed on general obligation bonds but does not calculate future interest costs the state will incur to service the bonds. Similarly, amounts listed for retirement liabilities reflect estimated amounts that would be necessary to eliminate unfunded liabilities all at once, right now. Over the long term, therefore, total amounts to address these liabilities often will be multiple times the estimates listed in this report.
The California Public Employees’ Retirement System (CalPERS), a unit of state government, administers retirement programs—including pension and retiree health benefits—for state employees and judges. The California State Teachers’ Retirement System (CalSTRS), another state entity, administers pension benefits and other retirement programs for teachers and school administrative personnel. The University of California (UC) administers pension and retiree health programs for UC employees.
Background
Defined Benefit (DB) Pension Programs. A DB pension program (1) receives contributions from employees and employers, (2) invests those contributions, and (3) uses the contributions plus investment returns to provide a specific monthly pension benefit to retirees and their beneficiaries. (Some members designate beneficiaries that receive benefits from the member’s retirement account after the member is deceased.)
How Pension Payments Are Calculated. Employees earn—or accrue—their pension benefits at a specified rate per year of public service. When an employee retires, their accrual is multiplied by their final pay to determine the amount of their pension payment. (In some cases, that final pay may be based on the highest pay over 12 months of service, in other cases the highest pay over three years of service.) For example, an employee in a “2 percent at 60” pension plan accrues 2 percentage points per year of service at age 60 to be multiplied by their final salary at retirement. If that employee retired at age 60 with 25 years of service and a salary of $80,000, their payment would be 50 percent of $80,000, or $40,000 per year.
Pension Benefits Protected Under U.S. and California Constitutions. California courts have ruled for decades that pension benefits for current and past public employees are protected under the Contract Clauses of the U.S. and California Constitutions. As a result, these benefits can only be reduced in rare circumstances. Even then, employers are generally required to provide an offsetting advantage that tends to negate the savings of the benefit reduction. While local governments may be able to alter contracts during bankruptcy proceedings, Chapter 9 bankruptcy is unavailable to state governments and therefore generally is not thought to apply to the retirement liabilities listed in this report.
Benefits May Be Altered for Future Employees. While pension benefits for current and past public employees are protected under the U.S. and California Constitutions, future employees have not yet been offered benefits and therefore do not have this contractual right. For this reason, governments can change benefits for future employees without limitation.
Retiree Health Benefits. The state and UC provide medical, prescription drug, and dental benefits to retired employees. These benefits are often referred to as other post–employment benefits, or OPEB, but they are generally known as “retiree health benefits.”
Systems Use Actuaries to Assess System Financial Health. CalPERS, CalSTRS, and the UC Regents—like other pension systems—employ actuaries to assess the financial condition of their retirement programs. An actuarial valuation estimates the present value of a system’s liabilities and compares those with the value of assets on hand. In the course of producing a valuation, actuaries make many assumptions about various economic and demographic factors, including investment returns, mortality, future compensation, inflation, years of service, and retirement age. (The CalPERS and CalSTRS boards—along with the UC Regents—establish what assumptions will be used in their valuations.)
Unfunded Liabilities. In producing an estimate about the present value of a system’s assets and liabilities, an actuarial valuation determines whether a system has an unfunded liability. An unfunded liability exists when a system does not have enough assets to fund all or part of a future obligation to provide benefits to its members. Taken another way, an unfunded liability is the amount that would have to be set aside as of the date of the actuarial valuation and invested by the system to cover the future costs of all promised benefits earned by members as of the valuation date.
Causes of Unfunded Liabilities. Unfunded liabilities generally arise in two ways. First, they result when contributions to the system were less than the estimated cost of a promised benefit in a given year. This is referred to as a “normal cost deficit.” (The term “normal cost” refers to the amount actuaries estimate is necessary—combined with assumed future investment earnings—to pay the cost of pension benefits that employees earn in a given year.) In these situations, the entities contributing to the pension program are not paying for the benefits as they are earned, instead passing those costs on to future generations. When pension benefits are increased retroactively, as occurred in California about 15 years ago, this creates a situation in which past contributions were not enough to have paid for these benefits. A second way that unfunded liabilities arise is when future events differ from prior actuarial assumptions—for example, if retirees live longer than was expected during their service years or if investment returns do not meet assumptions.
Funded Ratios. A system’s unfunded liability estimate alone provides insufficient information about the condition of a pension system. Another estimate to consider is its funded ratio—the ratio of system assets to accrued benefit liabilities—because it provides additional context. Appendix Figure 1 displays historical funded ratios reported by CalPERS and CalSTRS. (A system with a funded ratio of 80 percent, for example, has enough assets for 80 percent of promised benefits. A system has an unfunded liability if its assets are less than 100 percent of its liabilities.) While one system may appear to be in a worse financial position than another because it has a larger unfunded liability (in dollar terms), it could be better funded if it has a higher ratio of assets to liabilities. Pension systems are very complex, however, and cannot be fully assessed by any one measure. For example, as shown in Appendix Figure 1, the DB programs managed by CalPERS (for state employees) and CalSTRS had similar funded ratios as of the end of 2012–13. Because of recent actions taken by the CalPERS board, the system aims to set contribution rates that will address its unfunded liability in around 30 years—that is, its funded ratio will reach 100 percent in 30 years if future events reflect actuarial assumptions. In contrast, over the same time period, CalSTRS is expected to deplete its assets—that is, its funded ratio will reach zero absent increased contributions from the state, districts, and teachers. Of the two systems, CalSTRS is clearly in the worse position.
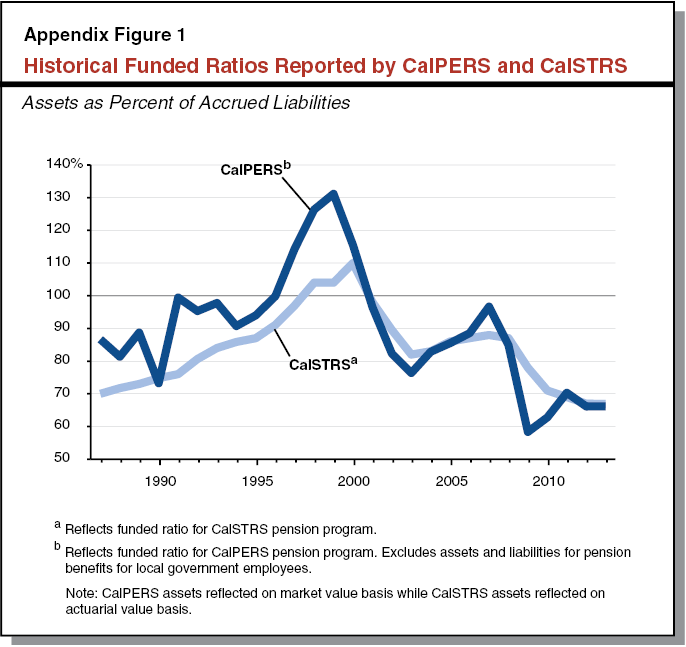
Unfunded Liabilities Would Change Using Different Assumptions. Actuarial estimates depend heavily on assumptions. If future events deviate from these assumptions, actual liabilities will differ from estimates in the valuation. For example, if retirees live longer (or shorter) than is assumed, unfunded liabilities would increase (or decrease) in future valuations, holding other factors constant. Probably the most debated actuarial assumption concerns future investment returns, often referred to as the “discount rate.” Both CalPERS and CalSTRS currently assume a future rate of return of 7.5 percent annually on their investments.
Importance of Investment Assumptions. In producing a valuation, actuaries make many assumptions about a host of economic and demographic factors, including future investment returns. Because investments compound over time—that is, returns are reinvested, allowing the earnings to also generate investment returns—changing the discount rate significantly affects the size of the unfunded liability. Appendix Figure 2 demonstrates the effect of reducing the investment return assumption on an initial investment of $1,000 from 7.5 percent to 5.5 percent. By year 20, assets under the 5.5 percent assumption are around one–third less than under the 7.5 percent assumption. By year 30, assets are reduced by nearly one–half. Reducing the discount rate from 7.5 percent to 5.5 percent would significantly affect the pension fund’s discounted estimates of their liabilities, and by extension their unfunded liabilities. The discount rate is therefore one of the most important assumptions made in an actuarial valuation.
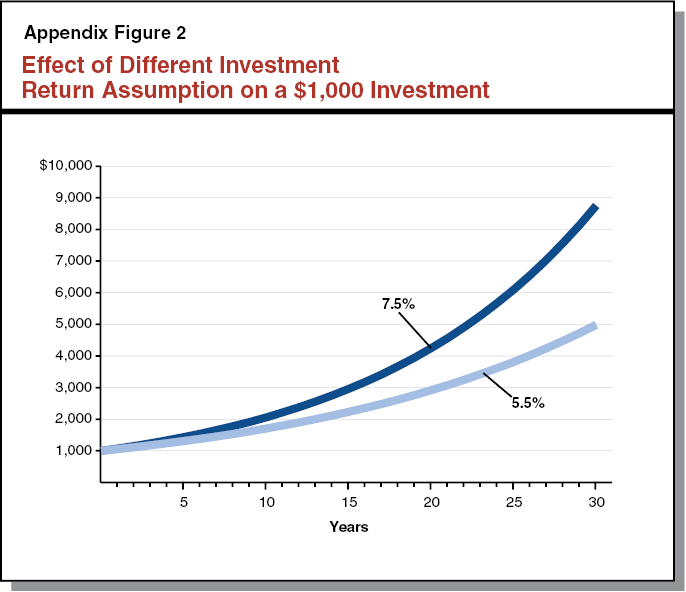
Discount Rate Subject to Much Debate. CalPERS and CalSTRS both assume that the future rate of return on their investments will be 7.5 percent. This means that their investment portfolio growth would average 7.5 percent per year. In practice, investment returns will be much greater than this in some years and much less (or even negative) in others, and that the returns from “good” investment years will have to pay for returns from “bad” investment years. Some observers contend that the assumed discount rate is optimistic and therefore should be lower. Because employer contributions to CalPERS are affected by the actuarial valuation, lowering the discount rate would not only increase the estimate of the unfunded liability, it would also increase the amount that the state would be required to pay for providing employees with pension benefits. (For example, reducing CalPERS’ discount rate from 7.5 percent to 6.5 percent would have resulted in the unfunded liability as of the end of 2011–12 increasing from $45.5 billion to $62.5 billion. This would have also increased employer rates from 21.1 percent of payroll to 31.3 percent of payroll in 2013–14.) Because CalPERS uses what critics characterize as an unreasonably high discount rate, these critics argue that the state does not pay the full cost of providing pension benefits to its employees. (In the case of CalSTRS, contributions to the system are set in statute and not directly influenced by the actuarial valuation, though lowering the discount rate would increase estimates of additional contributions necessary to fund that system.)
Our Estimates Reflect Systems’ Valuations of Liabilities. The estimates we use in this report generally are the estimates produced by the systems’ actuaries. This is principally because investment return assumptions of 7.5 percent for the CalPERS and CalSTRS DB programs discount rate appear in line with historical trends. For example, CalSTRS reports that its investment returns over the past 20 years have, on average, met their current assumption of 7.5 percent. That volatile period in asset markets, however, includes both the “dot–com bubble” of the late 1990s and the severe economic downturn of the late 2000s. In the future, asset markets may behave quite differently than they have in the past, making this an issue that could affect public finances in the future.
Recent Changes to Public Employee Retirement Benefits. Chapter 296, Statutes of 2012 (AB 340, Furutani), changed many aspects of public employee retirement programs. Taken as a whole, these actions reduced future state costs of providing DB pensions. In the case of the changes that affect employees who started service prior to January 1, 2013, the savings from the law have already begun to be reflected in actuarial valuations. Savings will materialize over several decades as post–2013 hires make up a larger share of the public workforce.