Overview of Human Services Budget. The Governor’s budget proposes $10.9 billion from the General Fund for human services programs—a 4.3 percent increase above 2014–15 estimated expenditures. For the most part, the year–over–year changes reflect the implementation of previously enacted policy changes as well as changes in caseload, utilization of services, and costs per unit of service, as opposed to new policy proposals. The Governor’s budget proposal for human services programs reflects significant fiscal uncertainty relating to federal actions in a number of programmatic areas. For example, the President’s recent executive action on immigration would have a highly uncertain fiscal impact on human services programs.
Programmatic and Spending Trends Since 2007–08. Our review of trends in the major human services programs since 2007–08 (the last budget developed before the recent recession) finds that total spending is up by 11 percent (in inflation–adjusted terms), with major changes in how human services programs are funded. Specifically, there has been an increasing reliance on federal funds and realignment revenues and less reliance on the General Fund. Caseloads are up in all major programs, cash assistance payments and some provider rates have fallen in real terms, and while funding for some program reductions made during recessionary times have been fully or partially restored, other program reductions continue today. In addition, the Legislature has made a select group of program augmentations since 2007–08 as well.
Uncertain Legal Status of Federal Labor Regulations Affecting In–Home Supportive Services (IHSS) Program and Department of Developmental Services (DDS). A federal court has blocked the implementation of new federal labor regulations (originally set to take effect on January 1, 2015) that would have required the payment of overtime compensation and other payments to home care workers in IHSS and DDS’s community program. This court decision has been appealed. The Legislature will need to account for this legal uncertainty in approving the IHSS and DDS budgets. To the extent funding budgeted in 2014–15 and 2015–16 to implement the federal regulations is no longer needed because the federal court’s decision is ultimately upheld on appeal, monies would be freed up for other legislative priorities.
Proposed Restoration of IHSS Service Hours Previously Reduced. The Governor’s budget proposes to use revenue from a restructured managed care organization tax to provide the nonfederal share of funding needed to restore service hours from the 7 percent reduction in hours enacted in 2013–14. We find the Governor’s overall concept to be a reasonable approach to allow for this funding restoration.
Developmental Center (DC) Closure Plans Needed. Federal and state policy promotes the integration of individuals with developmental disabilities into community settings. In furtherance of this policy, and supported by our analysis of the fiscal merits of transitioning DC residents to community settings, we recommend that the Legislature move torward closure of Fairview and Sonoma DCs.
Governor Proposes Next Steps in Addressing Program Deficiencies in Community Care Licensing (CCL). The Governor’s budget proposes a multiyear, multistage plan to reform the CCL program that oversees the licensing of child care, children’s residential, and adult and senior care facilities. This proposal builds on reforms enacted in the 2014–15 budget to address recent health and safety issues discovered at these CCL–licensed facilities. Overall, we find that the Governor’s proposal is responsive to the Legislature’s interest in decreasing the lengthy time interval (currently as long as five years) between required inspections. We think that increasing the inspection frequency for all facility types to at least once every three years—the first stage of the Governor’s proposal—is a reasonable first step. However, we think it is premature to approve the Governor’s proposal to further increase inspection frequencies in the subsequent stages of his plan until enforcement data is reviewed in an effort to target enforcement resources as cost–effectively as possible.
Continuum of Care Reform (CCR) Budget Proposal Should Be Justified in Context of Broader Reform Effort. The Governor’s budget proposes funding in 2015–16 to implement 2 of 19 recommendations of a working group established by the Legislature to recommend revisions to rates, services, and programs in the foster care system. The impetus for the reform effort is to further state law that requires that foster children be placed in the least restrictive, most family–like setting possible. While we think that the budget proposal appropriately focuses first on building capacity in home–based settings, we are unclear on how the proposed funding fits into the broader CCR implementation and how the funding would help achieve CCR objectives. We therefore recommend that the administration provide the needed justification at budget hearings.
California’s major human services programs provide a variety of benefits to its citizens. These include income maintenance for the aged, blind, or disabled; cash assistance and welfare–to–work services for low–income families with children; protecting children from abuse and neglect; providing home care workers who assist the aged and disabled in remaining in their own homes; collection of child support from noncustodial parents; and subsidized child care for low–income families.
Human services are administered at the state level by the Department of Social Services (DSS), DDS, Department of Child Support Services, and other California Health and Human Services Agency departments. The actual delivery of many services takes place at the local level and is typically carried out by 58 separate county welfare departments. A major exception is Supplemental Security Income/State Supplementary Payment (SSI/SSP), which is administered mainly by the U.S. Social Services Administration. In the case of DDS, community–based services (the type of services received by the vast majority of DDS consumers) are coordinated through 21 nonprofit organizations known as regional centers (RCs).
Recent Major Changes in Funding for Human Services Programs. As a result of realignment–related legislation in 2011 and 2013, the budget reflects shifts to counties of a significant amount of General Fund costs in human services programs. Specifically, as a result of 2011 legislation, the budget (beginning in 2011–12) reflects shifts to local realignment revenues of about $1.1 billion of General Fund costs in the California Work Opportunity and Responsibility to Kids (CalWORKs) program and about $1.6 billion in child welfare and adult protective services General Fund costs. As a result of the latter shift, the state’s role with respect to child welfare and adult protective services is largely one of oversight of county administration of these program areas.
Legislation enacted in 2013 shifted additional General Fund costs in the CalWORKs program to local realignment revenues that previously have been used to provide health services to indigent individuals. These realignment revenues have been freed up given that many indigent individuals are newly eligible for coverage in the state–funded Medi–Cal program. Specifically, the budget shifts $300 million in CalWORKs General Fund costs to these local realignment revenues in 2013–14, $725 million in 2014–15, and $698 million in 2015–16. The 2013 legislation additionally provided that the costs of specified ongoing increases to CalWORKs assistance payments will be shifted to revenues from the growth of existing local realignment revenues that otherwise would have supported other human services programs. We discuss the statutorily driven CalWORKs grant increases in greater detail later in the “CalWORKs” section in this report.
Overview of Human Services Budget Proposal. The Governor’s budget proposes expenditures of about $10.9 billion from the General Fund for human services programs in 2015–16. As shown in Figure 1, this reflects an increase of $444 million—or 4.3 percent—above revised General Fund expenditures in 2014–15.
Figure 1
Major Human Services Programs and Departments—Budget Summary
General Fund (Dollars in Millions)
|
|
2013–14
Actual
|
2014–15
Estimated
|
2015–16
Proposed
|
Change From 2014–15 to 2015–16
|
|
Amount
|
Percent
|
|
SSI/SSP
|
$2,772.6
|
$2,805.0
|
$2,834.0
|
$29.0
|
1.0%
|
|
Department of Developmental Services
|
2,801.0
|
3,098.1
|
3,298.8
|
200.7
|
6.5
|
|
CalWORKs
|
1,161.9
|
650.0a
|
663.2
|
13.2
|
2.0
|
|
In–Home Supportive Services
|
1,926.3
|
2,246.1
|
2,449.7
|
203.6
|
9.1
|
|
County Administration and Automation
|
674.5
|
843.6
|
842.2
|
–1.4
|
–0.2
|
|
Department of Child Support Services
|
304.6
|
313.6
|
313.6
|
—
|
—
|
|
Department of Rehabilitation
|
57.0
|
58.4
|
58.4
|
—
|
—
|
|
Department of Aging
|
31.5
|
32.3
|
30.4
|
–1.9
|
–5.9
|
|
All other social services (including state support)
|
253.0
|
415.9
|
416.2
|
0.3
|
—
|
|
Totals
|
$9,982.4
|
$10,463.0
|
$10,907.3
|
$444.3
|
4.3%
|
Summary of Major Budget Proposals and Changes. As shown in Figure 1, the budget reflects generally stable General Fund expenditures across a majority of human services programs, with relatively significant growth in DDS and IHSS expenditures being the exceptions.
The 6.5 percent growth ($202 million) in DDS General Fund expenditures is driven largely by caseload growth and higher utilization of community services. The year–over–year expenditure growth also reflects a new spending proposal for $18.1 million in 2015–16 to increase capacity in the secured treatment program at Porterville DC.
The 9.1 percent growth ($204 million) in IHSS General Fund expenditures largely reflects the annualized cost of complying with new federal labor regulations (currently unenforceable pursuant to a court order, as discussed later), caseload growth, and higher costs per service–hour as a result of wage increases. As also discussed below, the Governor’s budget proposes to restore IHSS hours that were eliminated as a result of the current 7 percent reduction in service hours initially enacted as a budget solution in a prior year. Funding for this restoration, however, is proposed to come from a restructured tax on managed care organizations, rather than from the General Fund.
It is important to note that the modest (2 percent) year–over–year net growth in CalWORKs General Fund expenditures masks a number of both cost increases and savings. On the cost front, the budget reflects increased costs for the full–year implementation of items adopted as part of the 2014–15 budget package, including the April 2015 grant increase (partially funded from the General Fund) and the extension of eligibility for drug felons. On the savings front, the budget reflects a projected decrease in caseload and the increased utilization of non–General Fund monies.
Budgetary Uncertainty Related to Federal Actions. The Governor’s budget proposal for human services programs reflects significant fiscal uncertainty relating to federal actions in a number of programmatic areas. We highlight these uncertainties in Figure 2 and later discuss some of the key ones in greater detail.
Figure 2
Human Services Budgetary Uncertainty Related to Federal Actions
|
Issue
|
Budgetary Uncertainty
|
|
Implementation of new federal labor regulations for In–Home Supportive Services (IHSS) and Department of Developmental Services (DDS)
|
The 2015–16 budget includes a combined total of $342 million General Fund in IHSS and DDS to make overtime and other required payments pursuant to new federal labor regulations. However, if a current lower federal court ruling invalidating the regulations is upheld, the state would realize General Fund savings.
|
|
Presidential executive action on immigration
|
If the President’s executive action takes effect, some undocumented immigrants may newly qualify for state human services programs, including IHSS and the Cash Assistance Program for Immigrants. The potential cost increase to the state’s human services programs resulting from this action is highly uncertain.
|
|
Federal funding of developmental centers (DCs)
|
The budget assumes that the state will retain federal Medicaid funding for DCs, despite DCs not meeting federal certification requirements. If the state does not make sufficient improvements to DCs, then a total of about $103 million in annual federal funding is at risk. Historically, lost federal funds for the DCs have been backfilled with General Fund monies.
|
|
Federal CalFresh administration funding target
|
The federal government typically pays 50 percent of CalFresh administrative costs. However, projected need for federal funds in 2014–15 and 2015–16 exceeds a federal funding maximum target. In the past, federal administrative funds from other states that spent below their respective targets were made available to California. To the extent that such funds are not available, as much as $270 million in additional General Fund spending would be required over the two years should the state backfill the lost federal funds.
|
|
Federal Title IV–E funding (foster care) disallowance
|
The federal government identified an instance of noncompliance with Title IV–E foster care regulations and has ordered the state to repay Title IV–E funds, with interest, that were disallowed because of the noncompliance. The state has appealed the disallowance, but has also set aside $50 million (General Fund) should the appeal be rejected. These set–aside dollars would become available for other purposes should the state’s appeal succeed.
|
Generally Varied Growth Through Most Recent Recession. While caseload grew for most of the state’s human services programs during the most recent recession, there was substantial variability in the growth rate across programs. This variability largely reflects the extent to which a program’s caseload is susceptible to economic fluctuations. (One key exception to this recessionary caseload growth is the state’s foster care caseload, which has declined since 2001 and through the recession. In part, this reflects the creation of the Kinship Guardian Assistance Payment program in 2000 that facilitates a permanent placement option for relative foster children outside of the foster care system.)
Both Caseload Growth and Declines Since Recession. Since the end of the most recent recession several years ago, caseloads in human services programs that are particularly sensitive to economic fluctuations—such as CalWORKs—have experienced year–over–year caseload declines as the economy improved. Other program areas—those that are less sensitive to economic fluctuations, such as DDS—have generally experienced caseload growth. We now turn more specifically to caseload trends in IHSS, DDS, and CalWORKs and the budget’s assumptions regarding caseload for these three program areas in 2015–16.
IHSS Caseload Projected to Grow Modestly in 2015–16. The budget projects the average monthly caseload for IHSS to be 462,648 in 2015–16—a 3.7 percent increase over the most recent estimate of 2014–15 caseload.
DDS Community Caseload Continues to Grow. The budget projects the average monthly DDS caseload in the community to be 288,317 in 2015–16—a 3.5 percent increase over estimated 2014–15 caseload. This caseload has grown steadily at similar percentage increases over each of the last several years, largely reflecting increased diagnoses of autism, the moratorium on the placement of consumers in state DCs, and general population growth.
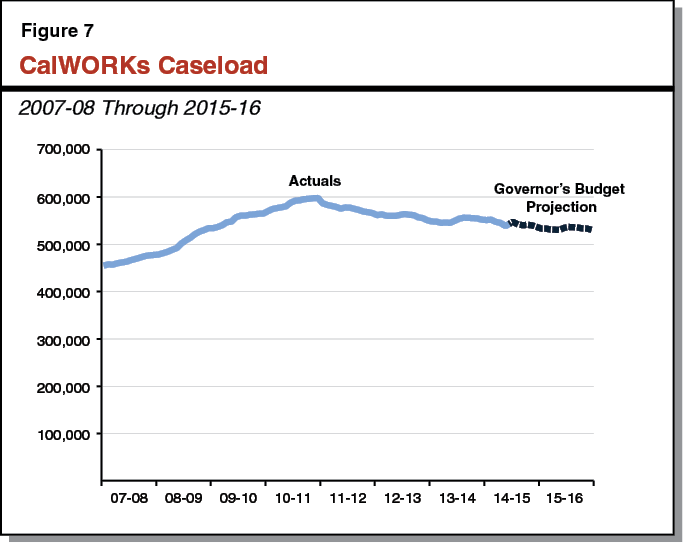
CalWORKs Caseload Continues to Decline. In the midst of the most recent recession, the CalWORKs caseload rose substantially and peaked at over 597,000 cases in June 2011. The caseload has been declining since that time due to enacted policy changes and an improving labor market. The budget assumes an average monthly CalWORKs caseload of 543,557 in 2014–15—a decline of 1.3 percent from the prior year. The year–over–year decline in caseload is projected to accelerate slightly to 1.9 percent in 2015–16, resulting in an average monthly caseload of 533,335. While caseload is declining, resulting in savings on cash assistance payments, the number of CalWORKs cases utilizing services is expected to modestly increase, partially offsetting cash assistance savings.
The Legislature has expressed significant recent interest in the issue of the level of the state’s spending in human services programs today compared to pre–recession levels (the 2007–08 state budget was the last budget developed before the recent recession). As with all areas of the budget, significant General Fund budget reductions were made in the human services policy area to help balance the budget during the recessionary years. This section is intended to provide information to the Legislature to be able to make a meaningful comparison between (1) the state’s spending and programmatic service/benefit levels in human services programs in the 2007–08 budget and (2) the level of spending and service/benefit levels for such programs proposed in the 2015–16 Governor’s Budget. For the state’s major human services programs, we discuss caseload trends, changes in how programs are funded, changes in eligibility and service/benefit levels, and other main drivers explaining the difference between 2007–08 and 2015–16 spending levels.
As shown in Figure 3, when all funding sources flowing through the state budget are considered (including federal funds), total spending in human services programs has grown by 25 percent between 2007–08 and the Governor’s 2015–16 budget proposal. After adjusting for inflation, the increase in spending is 11 percent.
Figure 3
The Human Services State Budget:
Pre–Recession Versus 2015–16 Proposal
(Dollars in Billions)
|
Fund Source
|
2007–08
Actual
|
2015–16
Proposed
|
Change From
2007–08 to 2015–16
|
|
Amount
|
Percent
|
|
General Fund
|
$12.0
|
$10.9
|
–$1.1
|
–9%
|
|
Federal fundsa
|
12.1
|
15.1
|
3.0
|
25
|
|
Realignment revenues
|
1.6
|
6.3
|
5.7
|
342
|
|
Other special funds
|
0.7
|
0.7
|
—b
|
2
|
|
Totals (All Funds)
|
$26.4
|
$33.0
|
$6.6
|
25%
|
Embedded in this total spending increase over the period are substantial changes in how human services programs are funded. Specifically, while General Fund spending has declined over this period, spending from federal funds and realignment revenues has increased substantially. To a significant extent, federal funds and realignment revenues are replacing what otherwise would have been General Fund expenditures, thereby driving down General Fund expenditures without a concomitant decrease in program benefit and service levels. (Realignment revenues are replacing General Fund expenditures in the child welfare services, adult protective services, and CalWORKs program areas.) As a result, General Fund spending on human services as a percentage of the total state General Fund budget decreased from 11.6 percent in 2007–08 to 9.6 percent in the 2015–16 budget proposal. Below, we provide a more in–depth comparison of pre–recession versus 2015–16 spending on a program–by–program basis, drilling down into how the caseload served, eligibility, benefit and service levels, and funding mix have changed over this period.
A benefit of the state–federal Medicaid program—known as Medi–Cal in California, IHSS provides in–home personal care and domestic services to low–income aged, blind, and disabled individuals.
Significant Expenditure Growth. In the period from 2007–08 to the budget proposed for 2015–16, IHSS expenditures have grown from $5 billion ($1.7 billion state funds) to $8.2 billion ($2.7 billion state funds), or an increase of 65 percent.
Caseload Growth. In the period from 2007–08 to the budget proposed for 2015–16, the IHSS caseload has grown from 400,156 individuals to an estimated 462,648 individuals, or an increase of 15.6 percent.
Service Hours From 7 Percent Reduction Proposed to Be Restored in 2015–16. Over the nine–year period from 2007–08 to 2015–16, IHSS recipients have experienced reductions in service hours. From 2010–11 to 2012–13, a 3.6 percent reduction in service hours was generally in effect, increasing to an 8 percent reduction in 2013–14, and ratcheting down to a 7 percent reduction in 2014–15. (We note that the 8 percent and 7 percent reductions were enacted in 2013 in relation to an IHSS settlement agreement that resolved two class–action lawsuits related to previously enacted IHSS budget reductions that had not taken effect.) The 2015–16 budget proposes to fully restore service hours from the 7 percent reduction.
Other Factors Explaining Growth in Spending. After accounting for inflation and caseload growth, the remaining significant growth in total spending between 2007–08 and 2015–16 reflects several factors, including the assumed implementation beginning in 2014–15 of new federal labor regulations (requiring the payment of overtime and the payment for previously uncompensated activities of IHSS providers), wage increases (both state–mandated minimum wage increases and wage increases negotiated at the county level), and higher average utilization of IHSS among recipients.
State Share of IHSS Costs Has Decreased Slightly. The IHSS program is funded through a combination of state funds, county realignment funds, and federal Medicaid funding. Beginning in 2011–12, the federal government began providing an enhanced reimbursement rate for a significant portion of the IHSS caseload, which has caused the federal share of costs to increase. In 2012–13, the Legislature enacted a county maintenance–of–effort (MOE) requirement, in which counties generally maintain their 2011–12 expenditure level for IHSS. The county MOE has caused the county share of IHSS costs to decrease. On net, the state share of IHSS costs has decreased slightly from 33.2 percent in 2007–08 to 32.5 percent in 2015–16.
The SSI/SSP program provides cash grants to low–income aged, blind, and disabled individuals. The state’s General Fund provides the SSP portion of the grant while federal funds pay for the SSI portion of the grant.
Modest Growth in Overall Program Spending. Total spending for SSI/SSP grants—including General Fund and federal expenditures (which are not passed through the state budget)—has increased by about $1.1 billion—or 12 percent—between 2007–08 and 2015–16. As this spending is less than the rate of inflation over this time period (roughly 14 percent), total spending has decreased slightly in real terms.
Modest Caseload Growth. In the period from 2007–08 to the budget proposed for 2015–16, the SSI/SSP caseload has grown from 1,235,932 individuals to an estimated 1,310,977 individuals, or an increase of 6.1 percent.
Decline in State–Funded Grant Levels. Historically, the state provided an annual cost–of–living adjustment (COLA) for the SSI/SSP grant. However, the state has not provided a COLA since June 2008 and no COLA is proposed for 2015–16. Further, over the period from 2007–08 to 2015–16, the state has significantly reduced the maximum SSP grant available for individuals and couples to the minimum allowed under federal law. We note that SSI/SSP recipients continue to receive a federally funded COLA for the SSI portion of the grant. In Figure 4, we display the maximum monthly SSI/SSP grant for individuals and couples in 2007–08, as compared to proposed grant levels for 2015–16. We also compare the grant levels in each of the two years to the federal poverty level (FPL) in that year (the FPL is adjusted annually for inflation). Reflecting SSP grant reductions and the suspension of the state COLA, the combined SSI/SSP maximum monthly grant for individuals and couples has declined significantly as a percentage of FPL over the nine–year period. After adjusting for inflation, the maximum combined SSI/SSP grant proposed for 2015–16 (1) for individuals represents roughly $76 (8.7 percent) less purchasing power than was provided in 2007–08 and (2) for couples represents roughly $190 (12.4 percent) less purchasing power than was provided in 2007–08.
Figure 4
SSI/SSP Maximum Monthly Grants Pre– and Post–Recession
|
|
2007–08
|
2015–16
Proposeda
|
|
Maximum Grant—Individuals
|
|
|
|
SSI
|
$637
|
$744
|
|
SSP
|
233
|
156
|
|
Totals
|
$870
|
$900
|
|
Percent of FPL
|
102.3%
|
91.8%
|
|
Maximum Grant—Couples
|
|
|
|
SSI
|
$956
|
$1,116
|
|
SSP
|
568
|
396
|
|
Totals
|
$1,524
|
$1,512
|
|
Percent of FPL
|
133.6%
|
113.9%
|
The DDS oversees the provision of services and supports for individuals with developmental disabilities. Community–based services are coordinated through 21 nonprofit organizations known as RCs.
Significant Expenditure Growth. In the period from 2007–08 to the budget proposed for 2015–16, DDS expenditures will have grown from $4.4 billion ($2.7 billion state funds) to an estimated $5.7 billion ($3.3 billion state funds), or an increase of 30.9 percent.
Significant Caseload Growth. In the period from 2007–08 to the budget proposed for 2015–16, the total DDS caseload has grown from 223,737 individuals to an estimated 289,327 individuals, or an increase of 29.3 percent.
Most Budget Solutions Implemented Since 2007–08 (and Earlier) Remain in Place. During the most recent period of budget deficits, the Legislature enacted numerous DDS budget reductions and cost savings measures in order to yield General Fund savings, such as rate restrictions for RC vendors, service changes, and reliance on increased federal funding. Rates paid to vendors established by statute or by the department have generally been frozen since 2003–04. Rates negotiated by the RCs for new vendors were limited beginning in 2008 to no higher than the median rate for that service. On top of the rate freezes and restrictions, temporary rate reductions were implemented broadly to RC vendors from 2009–10 through 2012–13, but these were completely lifted in 2013–14. In 2009–10, service reductions and eligibility restrictions were implemented in the Early Start program, which provides early intervention services to infants and toddlers under the age of three who have a developmental disability or delay(s). While the Early Start service reductions continue, the Early Start eligibility criteria were restored to the threshold in place prior to 2009 as of January 1, 2015. Also in 2009–10, the DDS suspended the availability of certain services, including social/recreation activities, camping services and associated travel, educational services for school–aged children, and certain nonmedical therapies. The Governor’s budget does not propose any restorations for these suspended services. Collectively, the Early Start service reductions and service suspensions that continue are estimated to create General Fund savings in the low tens of millions of dollars annually.
Figure 5 shows average spending per consumer over the period. While such spending has increased slightly in nominal terms, it has fallen by 9.5 percent once adjusted for inflation.
Figure 5
DDS Average Spending Per Consumer Pre– and Post–Recession
|
|
2007–08
|
2015–16 Proposed
|
|
Total funds (in millions)
|
$4,356
|
$5,699
|
|
Total caseload
|
223,737
|
289,327
|
|
Average spending per consumer
|
$19,467
|
$19,699
|
|
Average spending per consumer—adjusted for inflation
|
$19,467
|
$17,617
|
Federal Share of Costs Has Increased. The DDS is funded through a combination of state and federal funds. In 2007–08, 38 percent of total DDS costs were paid for by federal funds. In 2015–16, 42 percent of total DDS costs are proposed to be paid for by federal funds. This increase in federal funding is due primarily to the state’s efforts to increase federal Medicaid funding during the recent period of budget deficits.
CalWORKs provides cash grants and welfare–to–work services to families whose income is inadequate to meet their basic needs.
Total Expenditures Have Risen 11 Percent. From pre–recession levels in 2007–08, the Governor’s CalWORKs proposal for 2015–16 represents an increase in total spending (from all fund sources) of 11 percent—from $5.2 billion to $5.8 billion. As shown in Figure 6, total funding has increased slightly over this period for cash assistance, services, and county administration. Growth in services and administration has somewhat outpaced growth in cash assistance.
Figure 6
CalWORKs Funding Before and After Recession
|
|
2007–08 Actual
|
|
2015–16 Proposed
|
|
Funds
|
Share of Total
|
Funds
|
Share of Total
|
|
Spending by Purpose (Dollars in Millions)
|
|
|
|
|
|
|
Cash assistance
|
$3,006
|
58%
|
|
$3,242
|
56%
|
|
Services and county administration
|
2,031
|
39
|
|
2,348
|
41
|
|
Other
|
142
|
3
|
|
181
|
3
|
|
Total Funding
|
$5,179
|
100%
|
|
$5,771
|
100%
|
|
|
2007–08 Actual
|
|
2015–16 Proposed
|
|
Funds
|
Share of Total
|
Funds
|
Share of Total
|
|
Spending by Fund Source (Dollars in Millions)
|
|
|
|
|
|
|
Federal funds
|
$3,765
|
69%
|
|
$2,928
|
51%
|
|
State General Fund
|
1,319
|
29
|
|
663
|
11
|
|
County funds
|
95
|
2
|
|
2,180a
|
38
|
|
Total Funding
|
$5,179
|
100%
|
|
$5,771
|
100%
|
Significant Program Costs Shifted From General Fund to County Funds. As shown in Figure 6, the mix of funds supporting the CalWORKs program has changed significantly from 2007–08 to 2015–16. Over this period, the state has taken several actions to shift General Fund CalWORKs costs to counties, primarily through state–local realignment. Specifically, in 2011, the state provided dedicated revenues to counties to meet additional fiscal responsibilities in several areas. Of these new funds, $1.1 billion annually was directed to pay for an increased county share of existing CalWORKs grant costs, directly offsetting General Fund spending. In 2013, the state began redirecting realignment funds used by counties to provide indigent healthcare to instead pay for an additional county share of CalWORKs grant costs. The amount redirected each year corresponds to estimated county savings resulting from the shift of low–income individuals into Medi–Cal. This transfer, at an estimated $698 million in 2015–16, also directly offsets General Fund spending in CalWORKs. Finally, in 2013, the state also redirected future growth in certain other realignment funds to pay for the costs of future CalWORKs grant increases. These funds generally pay for new CalWORKs costs instead of directly offsetting existing General Fund costs, but will continue to increase the portion of CalWORKs supported by county funds over time.
Caseload Rose During Recession, Remains Above Pre–Recession Levels by 14 Percent. During 2007–08, an average of 465,951 families received CalWORKs assistance each month. As shown in Figure 7, during the recession, the monthly CalWORKs caseload reached nearly 600,000 (in June 2011) and has been declining since that time. The Governor’s budget assumes that the average monthly caseload during 2015–16 will be 533,335 families—14 percent higher than in 2007–08, but lower than the recession’s peak caseload.
Adult Eligibility for Aid Tightened. In general, adult eligibility for CalWORKs is time limited and able–bodied adults are subject to a work requirement. In July 2011, the lifetime maximum number of months that an adult could receive CalWORKs assistance was reduced from 60 to 48. This reduction in the amount of time over which an adult can receive CalWORKs assistance was one of the most important policy changes made to the program since 2007–08. It was estimated to save the state about $110 million when initially implemented (this savings amount would have declined slightly due to lower caseload today). There have also been major policy changes related to the work requirement that applies within the 48 months of assistance; however, these policy changes are not expected to create significant budgetary savings.
Grants Reduced, Then Partially Restored. In 2007–08, a family of three with no other income received a CalWORKs grant of $723 per month. Since 2007–08, CalWORKs grants have been both reduced and increased. Specifically, in 2009, grants were reduced by 4 percent and a statutory COLA that automatically adjusted grants for changes in inflation was eliminated. Grants were further reduced by 8 percent in 2011. Grants were later increased by 5 percent in 2014, and are scheduled to be increased by 5 percent again in April 2015. Both of these increases were provided through a new statutory mechanism that functions like a COLA, but bases automatic grant increases on availability of funds from a dedicated fund source rather than cost of living. The Governor’s proposal assumes no additional grant increase in 2015–16, such that the same family of three with no earned income would receive a grant of $704 per month—$19 (about 3 percent) lower than in 2007–08. After adjusting for inflation, the CalWORKs grant amount for this family proposed for 2015–16 represents roughly $115 (14 percent) less purchasing power than was provided in 2007–08. Because recent increases have not fully restored past reductions, and because the statutory COLA was eliminated, grants have also fallen as a percentage of FPL (a poverty threshold that is adjusted for inflation) between 2007–08 and 2015–16. Federally funded CalFresh food benefits (which CalWORKs families generally receive) are adjusted for inflation and have risen since 2007–08; however, combined CalWORKs and CalFresh food assistance have still fallen as a percentage of FPL from 2007–08 to 2015–16, as shown in Figure 8.
Figure 8
Monthly CalWORKs Grant and CalFresh Benefit Pre– and Post–Recessiona
|
|
2007–08
|
2015–16
Proposed
|
Change
|
|
Amount
|
Percent
|
|
Grant
|
$723
|
$704
|
–$19
|
–3%
|
|
CalFresh benefit
|
356
|
493
|
137
|
38
|
|
Totals
|
$1,079
|
$1,197
|
$118
|
11%
|
|
Grant as percent of FPL
|
51%
|
42%
|
|
|
|
Grant and CalFresh benefit as percent of FPL
|
75
|
71
|
|
|
Employment Services Funding Temporarily Reduced. . . Beginning in 2009–10 and continuing through the first half of 2012–13, the Legislature reduced county funding for CalWORKs services (initially by $420 million) and exempted certain CalWORKs families with young children from the program’s work requirement, thus reducing demand for services and allowing counties to manage the reduction. This reduction, and the associated exemption, was slowly phased out in 2013 and 2014. As formerly exempt recipients became subject to the work requirement, county funding for services was restored.
. . . Then Augmented With Early Engagement Strategies. The 2013–14 budget package included funding for three new strategies intended to better identify and address CalWORKs recipients’ barriers to employment early in their time on aid. These strategies included (1) ongoing funding to pay for additional subsidized employment opportunities for CalWORKs recipients, (2) the creation of the Family Stabilization Program within CalWORKs to provide intensive case management for families experiencing destabilizing crisis situations that interfere with their ability to meet the work requirement, and (3) the creation of a new online appraisal tool to comprehensively evaluate recipients as they enter the program to identify barriers to employment. This online appraisal tool is expected to be implemented statewide during 2015–16. The collective cost of these early engagement strategies in 2015–16 is about $140 million.
Other Program Reductions, Restorations, and Augmentations. Other relatively smaller CalWORKs reductions, restorations, and augmentations (each in the range of low to mid tens of millions of dollars) have taken place since 2007–08. For example, reimbursement rates for child care provided to certain CalWORKs families were reduced on an ongoing basis. The mechanism that allows CalWORKs families to keep a portion of their grant as their earnings increase was reduced and later restored. Case management services in Cal–Learn, a program within CalWORKs that helps pregnant and parenting teens complete high school, was eliminated and later restored. In 2014, a new Housing Support Program was created in CalWORKs, and CalWORKs eligibility will be expanded to individuals with prior drug felony convictions beginning in April 2015.
In summary, the main takeaways from our analysis of programmatic and spending trends in the major human services programs since 2007–08 are as follows:
- Spending Up, Funding Mix Changed. While total spending has gone up in real (inflation–adjusted) terms—by about 11 percent—there have been major changes in how programs are funded. Specifically, there has been an increasing reliance on federal funds and realignment revenues and less reliance on the General Fund. For the most part, these funding shifts have no affected program service levels.
- Caseloads Up. Caseloads have risen in all major human services programs since 2007–08, many at rates faster than the rate of growth of the state’s population. However, while some caseloads have grown steadily, the CalWORKs caseload—more closely tied to the state’s economy and labor market than other caseloads—reached a peak during the recession and has been declining since.
- Cash Assistance Payments and Some Provider Rates Have Fallen in Real Terms. The inflation–adjusted level of CalWORKs and SSI/SSP grants has fallen, reflecting both actual grant reductions (funding for which has not been fully restored) and the lack of COLAs in these two program areas for many years. Similarly, widespread rate freezes have applied to DDS vendors since 2003–04, meaning that these vendor rates have fallen in real terms.
- Some Programmatic Reductions Continue, but There Have Also Been Augmentations. In addition to reductions in cash assistance grant levels, there were a number of other programmatic reductions made during the recessionary period. While funding for many of these reductions has been fully or partially restored, several of the reductions continue today. For example, a number of DDS community services continue to be suspended today. On the other hand, there have also been a number of program augmentations since 2007–08. For example, the CalWORKs budget has been augmented to implement new strategies intended to better identify and address CalWORKs recipients’ barriers to employment early in their time on aid.
In 2013, the federal Department of Labor (DOL) issued revised regulations related to the Fair Labor Standards Act (FLSA) affecting the home care industry, resulting in impacts on the state’s IHSS program and DDS. Under these new labor regulations (originally set to take effect on January 1, 2015), the state is required to make the following changes to the IHSS program: (1) provide overtime compensation—at one–and–a–half times the regular pay rate—to IHSS providers for hours that exceed 40 in a work week, and (2) make payments for newly compensable work activities of IHSS providers, including wait time during medical appointments and commute time under certain circumstances. (We note that 2014 budget–related legislation generally restricts IHSS providers to working no more than 66 hours per week.) For DDS, the state is required to provide funding to enable home care vendors to provide overtime compensation to their employees. Please refer to the “Human Services Compliance With Federal Labor Regulations” analysis in The 2014–15 Budget: Analysis of the Human Services Budget for further background on the labor regulations.
The Case Management, Information and Payrolling System (CMIPS) II is the newly implemented IT system that stores IHSS case records, provides program data reports, and processes IHSS provider payments. In order to comply with the new federal labor regulations, CMIPS II system changes would be needed to process overtime compensation and payments for newly compensable work activities, and provide other needed capabilities. Most CMIPS II system changes have already been completed in preparation for the assumed implementation of the new federal labor regulations beginning January 1, 2015. The total estimated FLSA–related project cost is $37 million ($19 million General Fund) over 2014–15 and 2015–16.
The Governor’s budget updates 2014–15 estimated expenditures for FLSA–related costs in IHSS and DDS to a total of $459 million ($212 million General Fund). This is an increase of $48 million ($30 million General Fund) above the 2014–15 enacted budget appropriation, primarily due to adjustments for IHSS administrative costs at the county level and CMIPS II system changes. Below, we provide a breakdown of these costs.
Governor’s Budget Updates 2014–15 Estimated Expenditures for FLSA–Related IHSS Costs. The Governor’s budget updates 2014–15 estimated expenditures for FLSA–related IHSS costs, including a total of $439 million ($200 million General Fund) to fund the following: overtime compensation, newly compensable work activities, administrative costs at the county level, and CMIPS II system changes. We note that the total estimated cost for FLSA compliance also includes an administration proposal to provide work limit exceptions to certain parent providers of IHSS recipients at an estimated cost of $2 million ($985,000 General Fund) in 2014–15. This exception would allow certain parent providers to exceed the work limit of 66 hours per week.
Governor’s Budget Updates 2014–15 Estimated Expenditures for FLSA–Related DDS Costs. The Governor’s budget updates 2014–15 estimated expenditures for FLSA–related DDS costs, providing $21 million ($11 million General Fund) to increase the rates paid to vendors that provide in–home care to individuals with developmental disabilities. The additional funding is intended to enable home care vendors to provide overtime compensation to their employees.
The 2015–16 proposed budgets for IHSS and DDS provide a total of $758 million ($342 million General Fund) to annualize the cost of complying with the new labor regulations. Below, we provide a breakdown of these costs.
IHSS Budget Includes $717 Million ($319 Million General Fund). The 2015–16 proposed budget for IHSS annualizes the cost of complying with the new labor regulations, including a total of $717 million ($319 million General Fund). This amount includes about $1 million ($513,000 General Fund) for a total of eight positions—four new limited–term positions and the extension of four CMIPS II limited–term positions—at DSS to address workload related to implementation of the new federal labor regulations.
DDS Budget Includes $41 Million ($22 Million General Fund). The 2015–16 proposed budget for DDS annualizes the cost of complying with the new labor regulations, including $41 million ($22 million General Fund) to increase the rates paid to home care vendors to enable them to provide overtime compensation to their employees.
In Figure 9, we provide a breakdown of FLSA–related costs budgeted for IHSS and DDS in 2014–15 and 2015–16.
Figure 9
FLSA–Related Costs Budgeted for IHSS and DDS
(In Millions)
|
|
2014–15 Estimated
|
|
2015–16 Proposed
|
|
General Fund
|
Total Funds
|
General Fund
|
Total Funds
|
|
IHSS
|
|
|
|
|
|
|
Overtime compensation
|
$87.6
|
$200.8
|
|
$166.4
|
$385.2
|
|
Newly compensable work activities
|
69.7
|
152.2
|
|
146.2
|
319.1
|
|
Work limit exception for certain parent providers
|
1.0
|
2.1
|
|
2.0
|
4.4
|
|
Administrative costs at the county level
|
25.3
|
50.4
|
|
1.7
|
3.3
|
|
DSS staffing request
|
—
|
—
|
|
1.0
|
0.5
|
|
Subtotals
|
($183.6)
|
($405.6)
|
|
($317.3)
|
($712.5)
|
|
CMIPS II system changes
|
$16.7
|
$33.0
|
|
$2.0
|
$4.0
|
|
IHSS Totals
|
$200.3
|
$438.6
|
|
$319.3
|
$716.6
|
|
DDS
|
|
|
|
|
|
|
Rate increase for home care vendors
|
$11.3
|
$20.7
|
|
$22.4
|
$41.4
|
|
Grand Totals
|
$211.6
|
$459.3
|
|
$341.7
|
$758.0
|
In a lawsuit brought by associations of home care companies, a federal district court recently ruled that DOL overreached its rulemaking authority when it promulgated the revised FLSA regulations for the home care industry. Effectively, the court ruling invalidates the DOL’s new regulations, removing any requirement for the state to (1) provide funding for overtime compensation for IHSS and DDS, and (2) provide payments for wait and commute time for IHSS providers.
DOL Appeal Creates Fiscal Uncertainty for the State. At the time of this analysis, the DOL had appealed the federal court ruling. It is therefore uncertain as to whether the federal labor regulations will eventually go into effect, requiring the state to implement overtime compensation for IHSS and DDS, make the wait and commute time payments for IHSS, and complete the CMIPS II system changes needed to fully conform with the new regulations and related rules specified in 2014 budget–related legislation. It is our understanding that the appeal proceedings will occur on an expedited schedule. It is therefore possible that the court case could be resolved within 2014–15 or in the beginning of 2015–16, and—if DOL prevails—the state would be required to implement the payments.
State Implementation of Additional Payments Halted if Federal Regulations Are Deemed Ineffective. Budget–related legislation enacted in 2014 deletes state implementation of overtime compensation for IHSS and DDS as well as the wait and commute time payments for IHSS in the event that the federal labor regulations are deemed ineffective. Consistent with this statutory direction, both DSS and DDS halted the commencement of these payments related to the labor regulations (scheduled to have begun on January 1, 2015) in light of the federal court ruling. Further, the 2014 budget–related legislation for IHSS requires that the funding appropriated for FLSA–related costs remain within the IHSS budget. We address this aspect of the legislation below.
Legislature Can Use Freed–Up Funding as It Sees Fit. Given the invalidation of the federal labor regulations for now, the Legislature can use the 2014–15 funding appropriated for FLSA–related costs toward an alternative purpose. Although 2014 budget–related legislation requires the funding appropriated for FLSA–related IHSS costs to remain within the IHSS budget, the Legislature is free to enact new legislation specifying its intent to use the funding—about $184 million General Fund—for any purpose. We note that the $11 million General Fund from the updated 2014–15 DDS budget is also available for alternative purposes, and the Legislature could specify its intent on how to use the funding. Alternatively, if the Legislature does not take any action, there are two possible scenarios. First, these monies intended for FLSA–related purposes could remain unspent, with the funding reverting to the General Fund at the end of 2014–15, thereby building up the state’s General Fund reserve. As a second scenario, the departments could spend some or all of these funds on other purposes. This would reduce or eliminate the amount available for other legislative priorities.
Funds Appropriated in 2014–15. If the Legislature is concerned about the possibility that DSS and DDS could spend some or all of the 2014–15 funding appropriated for FLSA–related costs on other purposes, the Legislature would want to enact legislation specifically reverting these funds so that they would be available for any legislative priority.
Amounts Proposed for 2015–16. The uncertainty as to whether the federal labor regulations will be implemented in 2015–16 lead us to recommend that the Legislature wait until the May Revision before making a decision related to the 2015–16 FLSA–related appropriations for IHSS and DDS. Because of the expedited appeal filed by DOL, there is a fiscal risk that, if the court’s decision is overturned, the regulations could go into effect during 2015–16, requiring the state to provide overtime compensation and other payments for much of 2015–16. At the May Revision, we may know more about the timing of the fiscal risk associated with the court case. At that time, we would be in a better position to advise the Legislature on how much money, if any, should be appropriated or set aside for IHSS and DDS to meet possible FLSA–related costs in 2015–16.
The state had completed most of the CMIPS II system changes needed to process overtime compensation, provide wait and commute time payments to IHSS providers, and enforce related rules when the labor regulations were invalidated in federal court. Given DOL’s appeal of the court’s decision, the uncertainty as to whether the labor regulations will eventually be implemented raises questions about the department’s plans for CMIPS II system changes. We therefore recommend that the Legislature direct DSS to report at budget hearings on the proposed plan for CMIPS II, including the following specific issues.
- Plan for Period of Legal Uncertainty. We recommend that the department report at budget hearings on its plan for FLSA–related CMIPS II system changes—including the changes that have already been made and those that have not—during the current period of legal uncertainty while validity of the regulations is being challenged in the courts. This would help the Legislature to understand the feasibility of allowing CMIPS II changes to lie in a dormant state for an extended period of uncertainty.
- Fiscal Impact if Labor Regulations Remain Invalidated. We recommend that the department also report on the fiscal impact to the CMIPS II budget if the federal labor regulations were to remain invalidated upon resolution of the court case. We anticipate that there could be some costs associated with reversing FLSA–related system changes.
- Fiscal Impact if Labor Regulations Are Upheld. Finally, we recommend that the department assess the fiscal impact to the CMIPS II budget if the federal labor regulations were to be upheld upon resolution of the court case. We anticipate that there would be a change in when expenditures to complete FLSA–related CMIPS II system changes are incurred.
Ascertaining the information we describe would enable the Legislature to assess what, if any, CMIPS II budget adjustments are appropriate.
Given the uncertainty as to whether the labor regulations will eventually be implemented—and whether such implementation will occur in 2015–16—we recommend that the Legislature hold off on taking action related to the DSS staffing request that assumed the January 1, 2015 implementation of FLSA–related changes to the IHSS program and CMIPS II. We further recommend that the Legislature direct DSS to report at budget hearings on staffing implications if the regulations remain invalid in 2015–16.
Overview of IHSS. The IHSS program provides personal care and domestic services to low–income individuals to help them remain safely in their own homes and communities. In order to qualify for IHSS, a recipient must be aged, blind, or disabled and in most cases have income below the level necessary to qualify for SSI/SSP cash assistance. The recipients are eligible to receive up to 283 hours per month of assistance with tasks such as bathing, dressing, housework, and meal preparation. Social workers employed by county welfare departments conduct an in–home IHSS assessment of an individual’s needs in order to determine the amount and type of service hours to be provided. The average number of hours that will be provided to IHSS recipients is projected to be 94 hours per month in 2015–16. In most cases, the recipient is responsible for hiring and supervising a paid IHSS provider—oftentimes a family member or relative.
The IHSS Program Receives Federal Funds as a Medi–Cal Benefit. For nearly all IHSS recipients, the IHSS program is delivered as a benefit of the state–federal Medicaid health services program (known as Medi–Cal in California) for low–income populations. The IHSS program is subject to federal Medicaid rules, including the federal medical assistance percentage reimbursement rate for California of 50 percent of costs for most Medi–Cal recipients. For IHSS recipients who generally meet the state’s nursing facility clinical eligibility standards, the federal government provides an enhanced reimbursement rate of 56 percent referred to as Community First Choice Option (CFCO). Because of the large share of IHSS recipients eligible for CFCO—about 40 percent of the caseload—the average federal reimbursement rate for the IHSS program is 55 percent. The remaining nonfederal costs of the IHSS program are paid for by the state and counties, with the state assuming the majority of the nonfederal costs. (Under the federal Patient Protection and Affordable Care Act—also known as federal health care reform—about 20,000 individuals, or 4 percent of the IHSS caseload, are projected to receive IHSS as a result of the optional Medi–Cal expansion, with their costs fully paid for by the federal government in 2015–16.)
Counties’ Share of IHSS Costs Is Set in Statute. Budget–related legislation adopted in 2012–13 enacted a county MOE, in which counties generally maintain their 2011–12 expenditure level for IHSS—to be adjusted only for increases to IHSS providers’ wages (when negotiated at the county level through collective bargaining) and an annual inflation factor of 3.5 percent beginning in 2014–15. Under the county MOE financing structure, the state General Fund assumes all nonfederal IHSS costs above counties’ MOE expenditure levels. In 2015–16, the total county MOE is estimated to be about $1 billion, an increase of $35 million above the estimated county MOE for 2014–15. To the extent wage increases negotiated at the county level are implemented in the remainder of 2014–15 or in 2015–16, the county MOE will increase by a percentage share of the annual cost of those wage increases.
Year–to–Year Expenditure Comparison. The budget proposes $8.2 billion (all funds) for IHSS expenditures in 2015–16, which is a $1 billion, or 14.4 percent, net increase over estimated expenditures in 2014–15. General Fund expenditures for 2015–16 are proposed at $2.4 billion, a net increase of $204 million, or 9.1 percent, above the estimated expenditures in 2014–15. This net increase in General Fund expenditures incorporates the $35 million increase in the county MOE (which offsets General Fund expenditures). Below, we describe the major factors that explain the net increase.
- Increase in IHSS Basic Services Costs. The budget includes $300 million ($152 million General Fund) because of (1) caseload growth of 3.7 percent and (2) higher costs per hour due to the increase in the state–mandated hourly minimum wage from $9 to $10 beginning January 1, 2016. A total of 32 counties will be impacted by the minimum wage increase, at a cost of $68 million ($34 million General Fund). (Because the state enacted the minimum wage increase, the county MOE is not adjusted to reflect cost increases associated with the new minimum wage.)
- New Federal Labor Regulations Assumed to Be Effective. The budget also proposes a net increase of $307 million ($134 million General Fund) to reflect the annualized cost of complying with new federal labor regulations, including funding for: overtime compensation, newly compensable work activities, work limit exceptions for certain parent providers, and administrative costs at the county level. The budget was developed assuming that the regulations would take effect on January 1, 2015. However, a federal court recently invalidated the regulations, and the DOL has appealed the ruling. (Please refer to the “Federal Court Blocks New Federal Labor Regulations, Impacting IHSS and DDS” analysis earlier in this report for more detail on, and our analysis of, this issue.)
- CMIPS II. Offsetting the above increases, the budget includes reduced funding for CMIPS II of $53 million ($27 million General Fund) due to expected completion of: (1) system enhancements for blind and visually impaired IHSS recipients, (2) software upgrades and associated training, and (3) one–time system changes related to assumed implementation of the new federal labor regulations in 2014–15. The CMIPS II IT system stores IHSS case records, provides program data reports, and processes IHSS provider payments. (Please refer to the “Federal Court Blocks New Federal Labor Regulations, Impacting IHSS and DDS” section for more detail on, and our analysis of, CMIPS II system changes related to the new federal labor regulations.)
Proposed Restoration of Service Hours From 7 Percent Reduction. The budget proposes to use revenue from a restructured managed care organization (MCO) tax in the amount of $216 million to provide the nonfederal share of funding needed to restore service hours from the 7 percent reduction enacted in 2013–14. (The total cost to restore service hours from the 7 percent reduction is estimated to be $483 million in 2015–16.) The current 7 percent reduction relates to terms of an IHSS settlement agreement—adopted by the Legislature—that resolves two class–action lawsuits stemming from previously enacted budget reductions. The terms of the settlement agreement require the state to pursue a revenue source other than the General Fund for the purpose of restoring service hours from the 7 percent reduction. We generally find the Governor’s overall concept to be a reasonable approach for raising revenues needed to restore service hours from the 7 percent reduction. Please refer to the “MCO Tax Modification” analysis in the Medi–Cal section of The 2015–16 Budget: Analysis of the Health Budget for a more thorough discussion of the Governor’s MCO tax proposal.
Potential Costs in IHSS and Cash Assistance Program for Immigrants (CAPI) Related to President’s Immigration Actions. We note that the President’s recent executive actions on immigration could result in additional state costs for two human services programs—IHSS and CAPI (the state–funded cash assistance program for immigrants ineligible for SSI/SSP). If the actions are ultimately implemented at the federal level, then under existing law some undocumented immigrants may newly qualify for IHSS and/or CAPI fully paid for by the state. The potential fiscal impact of these actions on human services programs is highly uncertain. Please refer to the “President’s Executive Actions on Immigration” analysis in the Medi–Cal section of The 2015–16 Budget: Analysis of the Health Budget for more discussion of the President’s immigration actions, as they potentially relate to the state’s health and human services programs.
Caseload Growth. The Governor’s budget assumes the average monthly caseload for IHSS in 2015–16 will be 462,648, an increase of 3.7 percent compared to the revised estimate of the 2014–15 average monthly caseload. We have reviewed the caseload projections for IHSS and do not recommend any adjustments at this time. We note that the caseload estimates for 2014–15 and 2015–16 do not include the average monthly caseload associated with the optional Medi–Cal expansion (about 20,000 cases) or the relatively small but likely increase in IHSS recipients as a result of the Coordinated Care Initiative (CCI). The CCI integrates IHSS, and other long–term care services and supports, into managed care plans in seven counties statewide and requires managed care plans to provide care coordination services for new plan enrollees, potentially leading to an increase in IHSS use.
Staffing–Related Budget Requests. The budget is requesting additional staff resources for the following proposals:
- Staffing Request to Comply With New Federal Labor Regulations Assumed to Be Effective. The budget proposes about $1 million ($513,000 General Fund) for a total of eight positions—four new limited–term positions and the extension of four limited–term CMIPS II positions—to address administrative workload related to implementation of the new federal labor regulations. Please refer to our analysis earlier in this report “Federal Court Blocks New Federal Labor Regulations, Impacting IHSS and DDS” for more detail on, and our analysis of, this budget request.
- Staffing Request Related to IHSS in CCI Counties. The budget requests the extension of nine existing limited–term positions through 2016–17 to address workload associated with shifting IHSS to a managed care plan benefit in seven counties under CCI. We find that this budget proposal is justified on a workload basis.
Overview of DDS. The Lanterman Developmental Disabilities Services Act of 1969 (known as the Lanterman Act) forms the basis of the state’s commitment to provide individuals with developmental disabilities a variety of services and supports, which are overseen by DDS. The Lanterman Act defines a developmental disability as a “substantial disability” that starts before age 18 and is expected to continue indefinitely. The developmental disabilities for which an individual may be eligible to receive services under the Lanterman Act include: cerebral palsy, epilepsy, autism, intellectual disabilities, and other conditions closely related to intellectual disabilities that require similar treatment (such as a traumatic brain injury). The department works to ensure that individuals with developmental disabilities over the age of three have access to services and supports that sufficiently meet their needs, preferences, and goals in the least restrictive setting. For children under the age of three with a developmental disability or delay(s), the department administers early intervention services through the Early Start program. Unlike most other public human services or health services programs, services for the developmentally disabled are generally provided without any requirements that recipients demonstrate that they or their families do not have the financial means to pay for the services themselves. The department administers two main programs for eligible individuals (referred to as consumers), described in detail below.
Community Services Program. Community–based services are coordinated through 21 nonprofit organizations known as RCs, which assess eligibility and—through an interdisciplinary team—develop individual program plans (IPPs) for eligible consumers. The DDS provides RCs with an operations budget in order to conduct these activities. The department also provides RCs with a budget to purchase services from vendors for its consumers—estimated at 278,593 in 2014–15. These services and supports can include housing, activity and employment programs, in–home care, transportation, and other support services that assist individuals to live in the community. The centers purchase more than 100 different services on behalf of consumers. As the payer of last resort, RCs generally only pay for services if an individual does not have private health insurance or if the RC cannot refer an individual to so–called “generic” services such as (1) other state–administered health and human services programs for low–income persons or (2) services that are generally provided to all citizens at the local level by counties, cities, school districts, or other agencies. We note that the majority of consumers receiving services through the Community Services Program are enrolled in Medi–Cal, California’s federal–state Medicaid health program for low–income individuals. (For a description of the Medi–Cal program, please refer to the “Medi–Cal” section of The 2015–16 Budget: Analysis of the Health Budget.)
More than 99 percent of DDS consumers receive services under the Community Services Program. These consumers live in the community with their parents or other relatives, in their own houses or apartments, or in residential facilities or group homes designed to meet their needs. Less than 1 percent of DDS consumers live in state–operated institutions known as DCs, discussed below.
DCs Program. The DDS operates three 24–hour facilities known as DCs—Fairview DC in Orange County, Porterville DC in Tulare County, and Sonoma DC in Sonoma County—and one smaller leased community facility (Canyon Springs in Riverside County). Together, these facilities provide care and supervision to approximately 1,100 consumers in 2014–15. Each DC is licensed by the Department of Public Health (DPH), and certified by DPH on behalf of the federal Centers for Medicare and Medicaid Services (CMS), as skilled nursing facilities (SNFs), intermediate care facilities for the developmentally disabled (ICF–DDs), and general acute care hospitals.
The DCs are licensed and certified to provide a broad array of services based on each resident’s IPP, such as nursing services, assistance with activities of daily living, specialized rehabilitative services, individualized dietary services, and vocational or other day programs outside of the residential unit. The DCs must be certified in order to receive federal Medicaid funding, and the vast majority of DC residents are enrolled in Medi–Cal. Generally, for Medi–Cal enrollees living in DCs, the state bears roughly half the costs of their care and the federal government bears the remainder. Over the past 15 years, oversight entities such as DPH, CMS, and the United States Department of Justice have repeatedly identified problems at the DCs, including inadequate care, insufficient staffing, and inadequate reporting and investigation of instances of abuse and neglect. For more background on the history of problems identified at DCs, please refer to the “Department of Developmental Services” analysis in The 2013–14 Budget: Analysis of the Health and Human Services Budget.
Overall Budget Proposal. The budget proposes $5.7 billion (all funds) for DDS in 2015–16, which is a 4.5 percent net increase over estimated expenditures in 2014–15. General Fund expenditures for 2015–16 are proposed at $3.3 billion, a net increase of $201 million, or 6.5 percent, over estimated expenditures in 2014–15. This net increase in total expenditures generally reflects year–over–year increases in the budget for the Community Services Program, partially offset by decreasing costs in the DCs program budget.
2014–15 Adjustments Require Supplemental Appropriation. The revised 2014–15 DDS budget includes a number of adjustments that require a supplemental appropriation of $128 million General Fund ($102 million for the Community Services Program and $26 million for the DCs program), described further below.
2014–15 Adjustments. The revised 2014–15 budget for the Community Services Program includes several adjustments, requiring a supplemental appropriation of $102 million General Fund above the 2014–15 enacted budget appropriation to cover the following costs:
- Caseload Growth and Greater Utilization of Services. Increase of $111 million ($56 million General Fund) because of caseload growth and greater utilization of specialized adult residential facilities and supported living services.
- Unrealized Savings From Transferring Behavioral Health Treatment (BHT) Costs to Private Health Insurance. Increase of $44 million General Fund because of unrealized savings related to the transfer of BHT costs from RCs to private health insurance for individuals with autism who have private health insurance coverage. Chapter 650, Statutes of 2011 (SB 946, Steinberg), required private health insurance companies to provide BHT coverage to individuals with autism beginning July 1, 2012.
- New Federal Labor Regulations Assumed to Be Effective. Increase of $3.7 million ($1.9 million General Fund) to reflect an updated cost estimate for complying with new federal labor regulations originally set to take effect on January 1, 2015. Please refer to the “Federal Court Blocks New Federal Labor Regulations, Impacting IHSS and DDS” analysis earlier in this report for more detail on, and our analysis of, this issue.
We have reviewed these cost increases but are withholding our recommendation on this proposal, pending further information from the department on its estimated cost increase associated with greater utilization of services. We address this issue in greater detail later in this section.
2015–16 Community Services Program Budget. The budget proposes $5.1 billion (all funds) for the Community Services Program in 2015–16, which is a 6 percent net increase over estimated expenditures in 2014–15. Of this total, $615 million is proposed for RC operations expenditures and the remainder of $4.5 billion is for the purchase of services from RC vendors. General Fund expenditures are proposed at $3 billion, a net increase of $231 million, or 8.3 percent, above the estimated expenditures in 2014–15. This net increase reflects the following year–over–year budget changes.
- Caseload Growth and Greater Utilization of Services. Increase of $198 million ($181 million General Fund) because of caseload growth and greater utilization of specialized adult residential facilities and supported living services. We analyze these two components of the Governor’s proposal—caseload growth and greater utilization of services—later in this section.
- State–Mandated Hourly Minimum Wage Increase From $9 to $10. Increase of $64 million ($37 million General Fund) primarily for increasing the rates paid to certain RC vendors that employ workers currently earning less than $10 per hour. Chapter 351, Statutes of 2013 (AB 10, Alejo), will increase the state–mandated hourly minimum wage from $9 to $10 beginning January 1, 2016. We analyze this component of the Governor’s proposal later in this section.
- Paid Sick Days for Employees of RC Vendors. Increase of $25 million ($16 million General Fund) to provide funding to vendors that do not currently provide paid sick leave to their employees. Chapter 317, Statutes of 2014 (AB 1522, Gonzalez), requires employers to provide at least 24 hours (or three days) of sick leave per year to an employee. We analyze this component of the Governor’s proposal later in this section.
- One–Time Adjustment to RC Purchase of Services (POS) Budget. Decrease of $13 million General Fund to adjust the 2015–16 budget to account for a one–time augmentation of $13 million General Fund in 2014–15—used to implement recommendations from the Task Force on the Future of DCs.
- Annualizing Cost of New Federal Labor Regulations Assumed Effective. Increase of $21 million ($11 million General Fund) to annualize the cost of complying with new federal labor regulations originally set to take effect on January 1, 2015. Please refer to the “Federal Court Blocks New Federal Labor Regulations, Impacting IHSS and DDS” analysis earlier in this report for more detail on, and our analysis of, this issue.
2014–15 Adjustments for DCs Program Budget. The revised 2014–15 budget for the DCs program includes several adjustments, requiring a supplemental appropriation of $26 million General Fund above the 2014–15 enacted budget appropriation to cover the following costs:
- Expanding Capacity at Porterville DC for Incompetent to Stand Trial (IST) Admissions. Increase of $9 million General Fund to expand capacity within the secure treatment program (STP) of Porterville DC to accommodate an additional 32 beds for IST admissions. We note that a similar proposal to expand capacity for IST admissions is included in the budget for the Department of State Hospitals. Please refer to the “Department of State Hospitals” analysis in The 2015–16 Budget: Analysis of the Health Budget for more detail on, and our analysis of, this related proposal.
- Backfilling Withdrawn Federal Funding at Sonoma DC. Increase of $8.8 million General Fund is requested to backfill withdrawn federal funding for four ICF–DD residential units at Sonoma DC. The budget assumes federal funding for the four residential units will be restored no later than February 18, 2015.
- Implementation of Program Improvement Plans (PIPs) for Fairview and Porterville DCs. Increase of $12 million ($7.5 million General Fund) to fund ongoing improvements needed at Fairview and Porterville DCs in order to meet federal certification requirements for ICF–DD residential units.
We have reviewed these cost increases and find the supplemental appropriation request related to the DCs program to be reasonable.
2015–16 DCs Program Budget. The budget proposes $515 million (all funds) for the DCs program in 2015–16, which is an 8.5 percent net decrease below estimated expenditures in 2014–15. General Fund expenditures for 2015–16 are proposed at $280 million, a net decrease of $30 million, or 9.6 percent, below estimated expenditures in 2014–15. The major factors explaining the net decrease are:
- Completion of Lanterman DC Closure. Net decrease of $46 million ($24 million General Fund) related to the closure of Lanterman DC. The net decrease takes into account costs related to settling workers’ compensation claims and ensuring the successful transition of DC residents to the community, which are more than offset by savings from eliminating staff positions. The last resident transitioned to the community from Lanterman DC in December 2014. The budget proposes to transfer the Lanterman DC property to the California State University as of July 1, 2015.
- Annualizing Cost of Expanding Capacity at Porterville DC for IST Admissions. Increase of $9 million General Fund to annualize the cost of expanding capacity within the STP of Porterville DC to accommodate an additional 32 beds for IST admissions. We analyze this component of the Governor’s proposal later in this section.
- Staffing Reductions Due to Decreased DC Resident Population. Decrease of $12 million ($6.6 million General Fund) because of staffing reductions as the population of DCs declines (these staffing reductions exclude Lanterman DC, which is discussed separately above).
- Replacement of the Sonoma Creek Pump Station Intake System for Sonoma DC. Increase of $1.6 million General Fund to begin work related to replacing the pump station intake system at Sonoma Creek in order to ensure availability of the local water supply for Sonoma DC residents and staff. (Completing the replacement will cost an additional $2 million General Fund in 2017–18.)
Deferred Maintenance for DCs, Including Capital Outlay at Porterville DC. An increase of $7 million General Fund is budgeted separately from the department’s DC program budget for deferred maintenance projects within the DCs. Approximately $800,000 of these funds is proposed to conduct preliminary work related to a new fire alarm system at Porterville DC. (To complete the project will cost an additional $7.2 million General Fund over several years.) At the time of this analysis, the DDS is preparing a list of high–priority deferred maintenance issues to be addressed using the balance of the $7 million General Fund. Please refer to The 2015–16 Budget: The Governor’s General Fund Deferred Maintenance Proposal for more detail on, and our analysis of, the Governor’s deferred maintenance proposal.
Headquarters Budget Proposal. The budget proposes $43 million ($27 million General Fund) for headquarters operations expenditures, which is a 0.2 percent increase above the estimate of expenditures in 2014–15.
Community Caseload Has Steadily Grown in Recent Years. Between 2007–08 and 2014–15, the community caseload is projected to grow from 211,069 to an estimated 278,593—an average annual growth rate of 3.4 percent. The caseload trend is shown in Figure 10 and includes the combined total for consumers over the age of three as well as infants and toddlers enrolled in Early Start.
Figure 10
Community Caseload Growth Trends
|
|
Average Monthly Caseload
|
Increase From Prior Year
|
|
Consumers
|
Percent
|
|
2007–08
|
221,069
|
—
|
—
|
|
2008–09
|
231,451
|
10,382
|
4.7%
|
|
2009–10
|
233,294
|
1,843
|
0.8
|
|
2010–11
|
239,153
|
5,859
|
2.5
|
|
2011–12
|
247,674
|
8,521
|
3.6
|
|
2012–13
|
256,294
|
8,620
|
3.5
|
|
2013–14
|
265,216
|
8,922
|
3.5
|
|
2014–15a
|
278,593
|
13,377
|
5.0
|
|
|
Community Caseload Estimate Appears Reasonable. The Governor’s budget assumes the community caseload in 2015–16 will be 288,317, an increase of 9,724 consumers, or 3.5 percent, compared to the most recent estimate of the 2014–15 caseload. Based upon our review of recent community caseload data, we find the administration’s caseload estimate to be reasonable. If we receive additional information that causes us to change our overall assessment, we will provide the Legislature with an updated analysis at the May Revision.
DC Caseload Has Steadily Declined in Recent Years. Between 2007–08 and 2014–15, the DC population has declined from 2,668 to an estimated 1,116—an average annual decline of 11.6 percent. This decline is mostly attributable to the closure of Agnews and Lanterman DCs and the corresponding transition of DC consumers to community–based settings, which is consistent with federal and state policy to provide services to developmentally disabled individuals in integrated community settings. In addition, the moratorium on new admissions to DCs established in 2012–13 has contributed to the decline.
DC Caseload Estimate Appears Reasonable. The Governor’s budget assumes the DC caseload in 2015–16 will be 1,010, a decrease of 106 consumers, or 9.5 percent, compared to the most recent estimate of the 2014–15 caseload. Based upon our review of recent DC caseload data, we find the administration’s caseload estimate to be reasonable. If we receive additional information that causes us to change our overall assessment, we will provide the Legislature with an updated analysis at the May Revision.
Although we find the department’s community caseload estimates for 2014–15 and projections for 2015–16 to be reasonable, we have identified issues with the department’s estimate of costs associated with greater utilization of services. Specifically, we have reviewed the department’s cost estimates related to greater utilization of (1) specialized adult residential facilities (under the community care facilities POS category) and (2) supported living services (under the support services POS category). For these two categories, we find that the 2015–16 estimated costs proposed for General Fund expenditures that do not draw down federal Medicaid matching funds (known as non–matched General Fund) far outpace recent trends in cost growth. For community care facilities, the non–matched General Fund portion of expenditures is estimated to increase from $96 million for the 2014–15 enacted budget appropriation to $152 million for the 2015–16 proposal, an increase of $56 million (58.6 percent). Meanwhile, matched General Fund expenditures and federal reimbursements are estimated to hold relatively stable. For support services, the non–matched General Fund portion of expenditures is estimated to increase from $81 million for the 2014–15 enacted budget appropriation to $160 million for the 2015–16 proposal, an increase of $79 million (97.2 percent). Meanwhile, matched General Fund expenditures and federal reimbursements are estimated to experience relatively modest growth. The non–matched General Fund increases proposed for these two POS categories in 2015–16 deviate significantly from the cost growth trend over the last three fiscal years. At the time of this analysis, the department was unable to provide information on new factors that sufficiently explained the proposed increases for non–matched General Fund costs that deviate significantly from past trends.
Analyst’s Recommendation. We recommend that the Legislature direct the department to report at budget hearings on why non–matched General Fund expenditures are significantly increasing for community care facilities and support services and far outpacing the cost growth of expenditures that draw down federal matching funds.
Background. Two state–mandated policies, which begin implementation in 2015–16, impact workers employed by RC vendors: (1) an increase in the hourly minimum wage from $9 to $10 beginning January 1, 2016, pursuant to Chapter 351, and (2) the requirement to provide at least three paid sick days per year to employees beginning July 1, 2015, pursuant to Chapter 317. We note that DDS does not maintain data on the number of workers employed by RC vendors, their wages, or whether vendors provide paid sick leave to their employees.
Governor’s Budget Proposal Related to Minimum Wage Increase. The Governor’s budget proposes to increase the rates paid to certain vendors that employ workers who currently earn less than $10 per hour. Because DDS does not maintain data on the workers who will be impacted by this increase, the Governor’s budget proposes budget–related legislation—similar to the legislation enacted in 2014 for the increase in the minimum wage from $8 to $9—that would establish a process whereby vendors provide documentation to either DDS or the RC on the number of employees currently earning less than $10 per hour in order to receive an appropriate rate increase. The Governor’s budget assumes that seven types of RC vendors will receive a rate increase—community care facilities, day programs, habilitation services, transportation services, support services, in–home respite, and out–of–home respite—at an estimated cost of $62.3 million ($35 million General Fund) in 2015–16. We note that it is the intent of the department to enable vendors that provide services outside of these seven areas to also request a rate increase as a result of the minimum wage increase, if necessary. An additional $1.9 million ($1.6 million General Fund) is budgeted to provide a wage increase to $10 per hour for account clerks and secretaries under the core–staffing formula, which determines the RC operations budget. The exact cost of funding the minimum wage increase is uncertain, since there are no existing data available on impacted workers.
Governor’s Budget Proposal Related to Paid Sick Days. The Governor’s budget proposes to provide a rate increase to certain vendors that do not currently provide paid sick leave to their employees. Here again, DDS does not maintain data on the number of workers who will be impacted by the requirement of employers (including RC vendors) to provide at least three paid sick days per year. The Governor’s budget proposes budget–related legislation—similar to the legislation proposed for the minimum wage increase—that would establish a process whereby vendors provide documentation to either DDS or the RC on the number of employees that currently do not receive paid sick leave. The Governor’s budget assumes that nine types of RC vendors will receive a rate increase as a result of the paid sick leave requirement—these vendors include the seven vendor types assumed to be affected by the minimum wage increase as well as medical facilities and miscellaneous services—at an estimated cost of $25 million ($16 million General Fund) in 2015–16. Here again, the exact cost of funding the paid sick leave requirement is uncertain, since there are no existing data available on impacted workers.
Analyst’s Recommendation. We recommend that the Legislature approve the Governor’s proposed augmentations related to the minimum wage increase and the new paid sick leave requirement. We find the administration’s flexible approach of allowing impacted vendors to seek rate adjustments for the minimum wage increase and/or the paid sick leave requirement to be reasonable. However, because of the uncertainty related to the exact cost of funding the two proposals, we further recommend that the Legislature require a supplemental report from DDS—similar to the report to be provided for the 2014 minimum wage increase—on the actual General Fund cost for each of these proposals. This information would enable the Legislature to assess the degree to which the department’s estimating methodology needs to be revised in the event that similar policies are enacted in the future.
The California State Auditor recently completed an audit in January 2015 (after the Governor’s budget proposal for DDS had been developed) of the department’s Parental Fee Program, which assesses a monthly fee to parents of children with developmental disabilities—under the age of 18—who receive 24–hour out–of–home care. As of June 2014, about 550 children with developmental disabilities were receiving out–of–home care. In 2013–14, the Parental Fee Program billed $1.9 million and collected $1.2 million in fees. The Auditor found that the process used by DDS to assess parental fees is “riddled with unnecessary delays, lack of documentation, incorrect calculations, and inconsistent staff interpretations.” The Auditor made a number of recommendations to improve the efficiency, consistency, and transparency of the Parental Fee Program. The department has provided a written response to the Auditor’s report, saying it agrees with the majority of the recommendations in the audit and is committed to implementing the recommendations.
Analyst’s Recommendation. We recommend that the Legislature require DDS to report at budget hearings on its progress toward implementing the Auditor’s recommendations, and whether there are any budgetary implications associated with implementing the recommendations.
Background. Under state and federal law, all individuals who face criminal charges must be mentally competent to help in their defense, and individuals who are deemed IST have a right to receive training in order to potentially gain competency to stand trial for their alleged crime(s). A waiting list exists for individuals with developmental disabilities who have been deemed IST for charges related to a violent felony and/or a sex offense to receive competency training within the STP of Porterville DC. The STP serves individuals with developmental disabilities who have been involved with the criminal justice system, including individuals receiving competency training in order to stand trial for their alleged crime(s). At the time of this analysis, the IST waiting list for individuals with developmental disabilities awaiting the availability of competency training at Porterville DC includes 52 people, who have been in jail or juvenile hall for an average of 309 days. The courts have expressed concern that the long wait time is a potential violation of individuals’ due process rights.
Governor’s Budget Proposal Responds to IST Waitlist for Individuals With Developmental Disabilities. The Governor’s budget proposes to provide additional staff as well as operating expenses and equipment needed to expand capacity for IST admissions within the STP of Porterville DC by an additional 32 beds. An increase of $9 million General Fund above the 2014–15 enacted budget appropriation is proposed for 2014–15, with a total of $18 million General Fund proposed in 2015–16 to reflect the full–year cost of expanding capacity within the STP of Porterville DC.
Analyst’s Recommendation. We recommend that the Legislature approve the Governor’s budget proposal to expand capacity by 32 beds within the STP of Porterville DC. The nature of the charges brought against individuals with developmental disabilities on the IST waitlist combined with the need to expand capacity relatively quickly to address the long wait time for competency training lead us to find that the proposed expansion of capacity within the STP of Porterville DC is appropriate.
DCs Have Not Met Federal Certification Requirements. The DPH licenses health facilities and annually certifies them on behalf of CMS. Facilities must be certified in order to receive federal Medicaid funding. The three DCs—Fairview, Porterville, and Sonoma—have recently been found in surveys conducted by DPH to be out of compliance with federal certification requirements for ICF–DD residential units. The facilities were found to have some common deficiencies, including inconsistent treatment plans, residents who were not adequately protected from abuse or harm, and inconsistent implementation of policies generally related to residents’ health, safety, and rights. Generally, when a DC is found to be out of compliance with federal certification requirements, it must implement a PIP that involves the following steps: (1) an independent review conducted by outside experts who develop an action plan that identifies the “root cause” of deficiencies and proposes action items to prevent the deficiencies, (2) DPH approval of the action plan and implementation by the facility, and (3) a recertification survey by DPH. With the exception of four ICF–DD units at Sonoma DC—discussed immediately below—all DCs have retained federal Medicaid funding while they undergo the PIP process.
At Sonoma DC, Four ICF–DD Units Have Not Received Federal Funding. The DDS voluntarily withdrew four ICF–DD units at Sonoma DC from federal certification in January 2013 due to significant problems identified in these units. This action led to the loss of about $13 million in annual federal funding, which the state has backfilled with General Fund monies. Beginning in 2013–14, additional funding was provided to implement the PIP for Sonoma DC, which involved ongoing augmented staffing levels and other improvements. However, the 2014 DPH survey found that the remaining seven ICF–DD units at Sonoma DC—that had not previously lost federal funding—did not meet federal certification requirements. At the time of this analysis, Sonoma DC is preparing to meet federal certification requirements in a February 2015 survey in order to retain federal funding for the seven ICF–DD units and restore federal funding for the four ICF–DD units.
Governor’s Budget Implements PIPs at Fairview and Porterville DCs in Effort to Meet Federal Certification Requirements. In certification surveys conducted in 2013, DPH found that ICF–DD units at Fairview and Porterville DCs were out of compliance with federal certification requirements. At Fairview, all eight ICF–DD units, which receive an estimated total of $32 million in annual federal funding, were found to be out of compliance with federal certification requirements. At Porterville, all seven ICF–DD units in the general treatment area, which receive an estimated total of $28 million in federal funding, were found to be out of compliance with federal certification requirements. The Governor’s budget proposes an increase of $12 million ($7.5 million General Fund) above the 2014–15 enacted budget appropriation in 2014–15 to implement PIPs at Fairview and Porterville DCs, including ongoing augmented staffing levels and one–time staff training. The full–year ongoing cost of augmented staffing levels is proposed at $12 million ($6.5 million General Fund) in 2015–16. (We note that a technical budgeting error understates the General Fund cost in 2015–16 by $1.2 million in the DC estimate.) At the time of this analysis, DPH had begun its 2015 survey of Fairview DC. The DPH survey of Porterville DC is expected to occur soon.
All DCs at Risk of Losing Federal Funding. If the DCs do not meet certification requirements in 2015 DPH surveys, then DDS could lose as much as $90 million in annual federal Medicaid funding—in addition to the $13 million in withdrawn federal funding for the four units at Sonoma DC. In Figure 11, we provide a breakdown of federal funding at stake for ICF–DD units at each DC.
Figure 11
Estimated Federal Funding for ICF–DD Units at DCs in 2014–15
(Dollars in Millions)
|
DC
|
Number of
ICF–DD
Units
|
Annual Federal Funding
at Stakea
|
|
Fairview
|
8
|
$32
|
|
Porterville
|
7
|
28
|
|
Sonoma
|
7
|
30
|
|
Subtotals
|
(22)
|
($90)
|
|
Sonoma
|
4b
|
13
|
|
Totals
|
26
|
$103
|
Governor’s Budget Assumes Full Restoration and Retention of Federal Funding. The Governor’s budget assumes that federal funding for the four decertified ICF–DD units at Sonoma DC will be restored as of February 18, 2015. This outcome is contingent upon Sonoma DC successfully meeting federal certification requirements in a survey expected to occur prior to February 18th. The Governor’s budget also assumes that all other ICF–DD units at Sonoma, Fairview, and Porterville DCs will successfully meet federal certification requirements in 2015 DPH surveys and retain federal funding.
Analyst’s Recommendation. We recommend that the Legislature approve the Governor’s proposal to implement the PIPs for Fairview and Porterville DCs, as we find this funding to be an appropriate attempt to meet federal certification requirements and retain federal Medicaid funding for the facilities in 2015 DPH surveys. We note, however, that the ongoing funding provided by the PIPs may not necessarily lead to the DCs continuing to meet federal certification requirements in later–year DPH surveys. We address the long–term future of DCs in the analysis below.
In the following section, we provide background on the historical role that DCs have played in the state of California and recent efforts to close DCs, federal and state policy regarding the integration of individuals with developmental disabilities into community settings, and community living options provided by DDS. We then provide our analytical findings on the fiscal merits of transitioning DC residents to community settings. We conclude with a recommendation for the Legislature on how it could move toward closure of Fairview and Sonoma DCs.
Prior to Lanterman Act of 1969, DCs Were Only Out–of–Home Placement Option. The Lanterman Act of 1969 specifies the state’s intent to promote “community integration, independent, productive, and normal lives, and stable and healthy environments” for individuals with developmental disabilities. However, prior to the Lanterman Act, the state operated DCs as the primary out–of–home placement setting for individuals with developmental disabilities. The DCs were established as early as 1851 as state–run institutions for individuals with a wide–array of conditions, including developmental disabilities. At their peak in the late 1960s, the state housed about 13,000 individuals with developmental disabilities in eight DCs—large institutions stretching over hundreds of acres with more than 100 buildings or structures at each site, enabling the institutions to be self–sustaining and generally autonomous from neighboring communities. Beginning in the early 1970s, with the enactment of the Lanterman Act and establishment of RCs, the population of the DCs began to decline as community services and supports for individuals with developmental disabilities began to proliferate.
Today, DCs House Less Than 1 Percent of Total DDS Caseload. The state now operates three DCs—Fairview, Sonoma, and Porterville—and one smaller leased facility in Canyon Springs. The remaining DC residents—about 1,100 individuals—are more likely to have behaviors or medical needs that can be more challenging to serve in the community. A small portion of these 1,100 individuals—about 170 people—reside in the STP of Porterville DC, which serves individuals with developmental disabilities who have been involved in the criminal justice system. With the exception of units within the STP of Porterville DC, all units at DCs are eligible to receive federal Medicaid funding.
Agnews and Lanterman DCs Were Closed in the Last Decade. Since the early 2000s, the state has successfully closed Agnews DC—over the five–year period from 2004–05 to 2008–09—and Lanterman DC—over the six–year period from 2009–10 to 2014–15. Unlike the closure of Stockton and Camarillo DCs in the late 1990s, the closure of Agnews and Lanterman DCs were the first instances in which DDS sought to transition all DC residents to community settings over the course of several years. In Figure 12, we list the major closure activities over the roughly five years it has historically taken to close a DC and successfully transition consumers to the community. In order to begin the closure process for a DC, existing state law specifies that the department must submit a detailed closure plan to the Legislature no later than April 1 immediately prior to the fiscal year in which the plan begins implementation.
Figure 12
Major Activities DDS Undertakes to Close a DC
|
Pre–Closure Activities
- Announce Intention to Close DC
- Hold Initial Meetings With Stakeholders
- Hold Public Hearing on the DC Closure
- Submit Closure Plan to Legislature by April 1 Prior to Fiscal Year That Closure Will First Be Implemented
|
|
Year 1
- Continue Communication With Stakeholders (Ongoing Throughout Closure)
- Initiate Transition Planning for DC Residents, Including Individual Health Care Plans
- Track the Development of Community Homes for DC Residents.
- Communicate With RCs to Review Transition Status of DC Residents
|
|
Years 2 and 3
- Continue Transition Planning for DC Residents
- Transition DC Residents to Community Settings as Resources Become Available (Ongoing Throughout Closure)
- Continue Tracking the Development of Community Homes for DC Residents (Ongoing Throughout Closure)
- Continue Communication With RCs to Review Transition Status of DC Residents (Ongoing Throughout Closure)
|
|
Year 4
- Complete Transition Planning for Remaining DC Residents
|
|
Post–Closure Activities
- Operation of Outpatient Clinic to Ensure Continuity of Services for DC Residents Who Have Transitioned to Community Settings
- Facility Maintenance Until DC Is Transferred to Department of General Services as Surplus State Property
|
Almost All Residents of Agnews and Lanterman DCs Successfully Transitioned to Community Settings. In the case of Agnews DC, all but 20 of the 386 consumers residing at the DC at the time the closure process began in 2004–05 were successfully transitioned to the community. The 20 consumers who did not transition to the community were transferred to other DCs. In the case of Lanterman DC, all 401 consumers who were residing at the DC at the time the closure was announced in January 2010 were successfully transitioned to the community. Most Lanterman DC residents who transitioned to the community moved to a specialized residential facility for specific needs that are nonmedical in nature or an adult residential facility for persons with special health care needs—two residential options described further below. (We note that some residents of Agnews and Lanterman DCs passed away before they could transition to the community.)
Federal and State Policy Promotes Integrated Community Settings for Individuals With Developmental Disabilities. The federal Americans with Disabilities Act of 1990 and the Olmstead U.S. Supreme Court decision (1999) require the state to provide services and supports to individuals with developmental disabilities in the “most integrated setting appropriate to meet their needs.” At the state level, the Lanterman Act of 1969 first specified the state’s intent to provide services and supports to individuals with developmental disabilities in integrated community settings. In 2012–13, budget–related legislation imposed a moratorium on new admissions to DCs, with certain exceptions for individuals involved in the criminal justice system and consumers in acute crisis in need of short–term stabilization. In January 2014, the Task Force on the Future of DCs convened by the administration released a plan on the long–term future of DCs. The plan recognizes the need to reevaluate the role of DCs in light of the historical trend of individuals with developmental disabilities transitioning from institutional placements to community settings. The plan also recognizes the varying needs of existing DC residents and makes recommendations for improving community services and supports, while retaining state–operated facilities for individuals who are in acute crisis or involved in the criminal justice system.
Various Residential Options Are Available in the Community for Individuals With Developmental Disabilities. Individuals with developmental disabilities can live in a wide–array of residential options in the community, including homes and facilities that serve individuals with a greater or lesser acuity of needs—either medical needs or other needs, such as those related to challenging behaviors. Generally, the following six residential options serve individuals who have greater medical needs in that they provide continuous or intermittent nursing care: (1) adult residential facilities for persons with special health care needs, (2) SNFs, and (3) four types of ICF–DDs, including nursing and habilitative facilities that are typically single–family homes serving no more than six consumers.
Typically, for individuals who have needs that are nonmedical in nature of a lesser or greater acuity, the following residential options are available: (1) community care facilities, (2) specialized residential facilities, and (3) adult family homes. We note that two new models of care authorized by 2014 budget–related legislation include homes with enhanced behavioral supports and community crisis facilities. Generally, community homes or facilities serve four to six consumers in each residence. Finally, we note that consumers can receive supported living services in their own homes.
In Figure 13, we list all of the community living options that are being utilized by former Lanterman DC residents.
Figure 13
Community Living Options Used by Former Lanterman Developmental Center Residents
|
Residential Option
|
Former
Lanterman DC
Residents
|
|
Specialized residential facility
|
238
|
|
Adult residential facility for persons with special health care needs
|
61
|
|
Community care facility
|
21
|
|
ICF–DD–nursing
|
9
|
|
Long–term sub–acute facilitya
|
8
|
|
ICF–DD–habilitative
|
7
|
|
Supported living services
|
7
|
|
Family home/other
|
5
|
|
Adult family home
|
3
|
|
Total
|
359
|
Average Annual Spending Per Consumer in DCs Has Increased Over Time to More Than $500,000 in 2014–15. There are significant fixed costs to operating DCs, given their massive size and scope of provided services—from day programs to hospital care. In terms of facility maintenance, the department has deferred numerous upgrades and focused mostly on fire, life, and safety projects. Even these projects can cost millions of dollars because of the large physical size of the DCs. The fixed cost to run DCs primarily explains why the total average spending per DC consumer has grown as the population has declined—as displayed in Figure 14. Today, the average annual spending per DC consumer is estimated to be more than $500,000 (total funds). In calculating the average amount of annual spending per DC consumer, we have considered DC operating costs but not capital outlay investments made at the DCs. For DC residents—almost all of whom are Medi–Cal enrollees—the General Fund typically provides at least half the costs of their care and the federal government pays for the remainder.
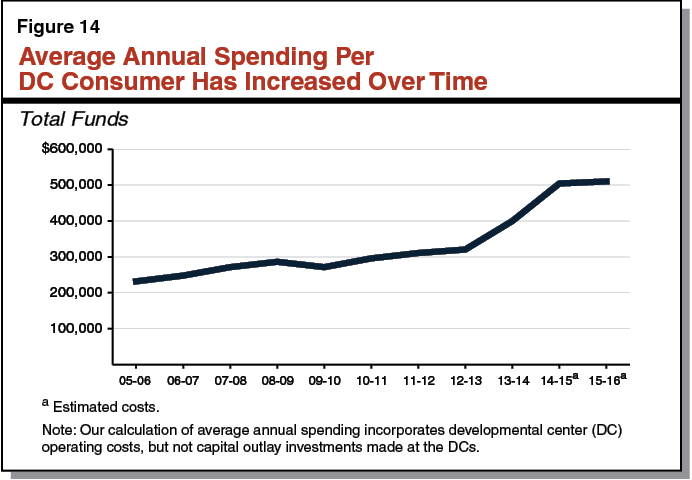
Average Annual Spending for Former Lanterman DC Residents Now Living in the Community Is Less. In order to compare the average annual spending per DC consumer to the average annual spending for similar consumers in the community, we have provided in Figure 15 the average annual spending for Lanterman DC residents who recently transitioned to the community. Because total annual costs for consumers vary significantly by residential option, we have provided the average annual cost per consumer by residence type, using expenditure data for former Lanterman DC residents who have been in the community for at least 12 months—179 of the total 359 consumers who transitioned from Lanterman DC. As Figure 15 shows, average annual spending per consumer varies greatly by residence type—from about $75,000 to $300,000 (total funds). However, in all cases, the average annual cost to provide care to a former Lanterman DC resident is far less expensive in a community setting than it would be in a DC. The total average spending displayed in Figure 15 is paid for with a combination of General Fund monies and federal Medicaid funding in almost all cases. The General Fund provides for roughly half the costs and the federal government pays for the remainder. We also note that the department incurs upfront development costs—fully paid for by the General Fund—when it establishes new residential options for DC residents transitioning to the community, including acquisition of a property, renovation to meet the needs of individuals with developmental disabilities, and provider start–up costs (such as staff training and supplies). For the Lanterman DC closure, the department reports that approximately $40 million General Fund was spent to develop 92 homes. There was not adequate information available to allocate these costs to the different types of residences shown in Figure 15. Even if these upfront development costs were to be incorporated into the average annual spending per consumer displayed in Figure 15, it would not fundamentally change our fiscal analysis that it is considerably more cost–effective to provide care to former Lanterman DC residents in community settings.
Figure 15
Average Annual Spending for Former Lanterman DC Residents in Community Settings
|
Residence Type
|
Average Annual
Spending Per Consumer
(Total Funds)a
|
Number of
Consumers
|
|
Supported Living Services
|
$301,178
|
3
|
- Typical services include adult day care, work programs, behavior analyst services, and transportation.
|
|
|
|
Specialized Residential Facility—Health
|
299,918
|
2
|
- Typically does not include other services.
|
|
|
|
Adult Residential Facility for Persons With Special Health Care Needs
|
245,774
|
14
|
- Typical services include day programs and supplemental staffing.
|
|
|
|
Specialized Residential Facility—Habilitation
|
180,926
|
152
|
- Typical services include community integration training programs, personal assistance, supplemental staffing, day programs, behavior management programs, and transportation.
|
|
|
|
Adult Family Home
|
165,674
|
2
|
- Typical services include transportation.
|
|
|
|
Adult Residential Facility
|
75,722
|
6
|
- Typical services include supplemental staffing, day programs, behavior management programs, and transportation.
|
|
|
In its plan for the long–term future of DCs, the Task Force on the Future of DCs convened by the administration recognized the need to maintain state–operated facilities for individuals in acute crisis or involved in the criminal justice system. We agree with the task force on the need to maintain state–operated facilities for individuals invovled in the criminal justice system and find that Porterville DC should continue to operate for this purpose. However, we find significant fiscal and policy justification for closing Fairview and Sonoma DCs and seeking to transition all residents in these facilities to community settings. On a fiscal basis, we find that providing services and supports to former DC residents in community settings is cost–effective. On policy grounds, the provision of services and supports in integrated community settings is consistent with federal and state policy. We therefore come to the conclusion that DDS should close both Fairview and Sonoma DCs within ten years. We would defer to the department’s judgment as to which DC should be closed first. We recognize that DDS may not be in a position to submit a closure plan for Fairview or Sonoma DC to the Legislature by April 1, 2015, as required under existing state law in order to begin closure activities in 2015–16. We therefore recommend that the Legislature require DDS to report at budget hearings on its long–term plan for Fairview and Sonoma DCs. Upon considering the department’s testimony at budget hearings, the Legislature may seek to enact legislation providing a closure timeline for Fairview and Sonoma DCs.
The Community Care Licensing (CCL) division within DSS oversees the licensing of various facilities that can be grouped into three broad categories: child care, children’s residential, and adult and senior care facilities. The division is also responsible for investigating any complaints lodged against these facilities and for conducting inspections of the facilities. The state monitors approximately 66,000 homes and facilities, which are estimated to have the capacity to serve over 1.3 million Californians. Additionally, DSS contracts with counties to license an additional 8,700 foster family homes and family child care homes.
CCL Staffing and Facility Monitoring. The roughly 66,000 homes and facilities statewide directly under the regulatory purview of CCL are primarily monitored and licensed by just over 460 licensing analysts. These licensing analysts are located in 25 regional offices throughout the state and are responsible for conducting annually over 24,000 inspections and 14,000 complaint investigations. Current practice is for CCL to conduct random inspections on at least 30 percent of all facilities annually, and law requires each facility to be visited no less than once every five years. Additionally, approximately 10 percent of facilities are required to be inspected annually as a requirement of federal funding or due to poor compliance history. Although the CCL has had difficulty meeting these time frames in the past, the division is generally meeting these time frames currently.
Past Budget Reductions Have Increased the Times Between Annual Visits. Prior to 2002–03, most facilities licensed by CCL were required to be visited annually. Visits were used to check for compliance with health and safety requirements designed to protect those in the care of CCL–licensed facilities. Budget–related legislation enacted in 2003 lengthened the intervals between visits for most facilities from one year to five years. Additionally, the legislation included “trigger” language that increased the percentage of annual random inspections—starting with 10 percent of facilities—based on the number of citations issued in the prior year.
CCL Now Relies Significantly on Complaints to Identify Noncompliance. The extended interval between visits has made CCL more reliant on complaints to identify health and safety violations. This means CCL is primarily identifying noncompliance after the fact—frequently as the result of a complaint where harm has already occurred, rather than identifying and addressing risks that may not have yet resulted in harm. The concern is that relying on complaints may be less effective at protecting the health and safety of clients than a system that detects and addresses issues proactively. Currently, CCL investigates over 14,000 complaints involving licensed care annually.
Recent Issues at Licensed Facilities Have Gained Attention. Recent health and safety incidents at licensed facilities have gained the attention of the media and the Legislature. These include incidents of neglect and abuse, as well as evidence in general of inconsistent and inadequate oversight, monitoring, and enforcement of licensing standards. In response to the health and safety issues discovered at facilities under the regulatory purview of CCL, the 2014–15 Governor’s Budget proposed and the Legislature approved a comprehensive plan to reform the CCL program. We now turn to an update of the status of the 2014–15 reforms to improve the CCL division.
2014–15 Budget Act Funds CCL Quality Enhancements. The 2014–15 spending plan funds the Governor’s proposal for quality enhancements and improvements in CCL. This includes 71.5 positions and $5.8 million General Fund to (1) create a more robust training program for licensing inspectors, (2) create a quality assurance unit that is trained to detect instances of systemic noncompliance, (3) centralize and make more efficient the application and complaint intake process, and (4) create some medical capacity at DSS to begin considering the increasing medical needs of those in assisted living facilities. The creation of the quality assurance unit was intended in part to address the historical lack of systematic enforcement data to help target enforcement resources to cases with the greatest likelihood of improving compliance. For instances when the license of a facility is suspended or revoked, budget–related legislation allows for the department to appoint a qualified temporary manager or receiver to: (1) assume responsibility of the operation of the facility and assist in bringing it into compliance, (2) facilitate the transfer of ownership of the facility to a new licensee, or (3) coordinate and oversee the transfer of clients to a new facility if the facility is closing. (Refer to our February 20, 2014 report, The 2014–15 Budget: Analysis of the Human Services Budget, for a comprehensive description of the 2014–15 CCL budget proposal that was ultimately approved by the Legislature.)
Status of 2014–15 Reforms. The DSS has filled the vast majority of positions authorized as part of the 2014–15 Budget Act for the CCL quality enhancements. Several components of the 2014–15 spending plan are now fully implemented, while in other cases the department is still hiring and training its staff in preparation for implementation. Specifically, the greatest advances have been made in the provision of more robust training for managers and licensing analysts and in establishing the statewide complaint hotline, which is now operational. While staffing resources for the quality assurance unit and centralized application processing have been hired, these staff are still undergoing training before the units become operational. On the other hand, the department has not yet filled the nurse practitioner position authorized to assist in the oversight of a population that is increasingly medically fragile.
Legislative Intent to Increase Inspection Frequency. The final 2014–15 budget package included statutory language specifying that it is the intent of the Legislature to, over time, increase the frequency of CCL–regulated facility inspections to annually for some or all facilities.
In response to the intent language noted above, the Governor’s budget proposes a multiyear, multistage plan to further reform the CCL program. The proposal includes an increase of 28.5 positions (13 two–year limited–term positions) and $3 million General Fund in 2015–16 to (1) hire and begin training staff in preparation for an increase in the frequency of inspections for all facility types beginning in 2016–17 and (2) make various other changes intended to strengthen enforcement capacity and improve the quality of care delivered at facilities under the regulatory purview of CCL. The proposed reforms would go into effect incrementally through 2018–19. The proposal includes a request for additional resources in budget years beyond 2015–16 to fully implement the proposal. When fully implemented, the proposal would add a total of 145 new permanent positions within DSS at a cost of $37.3 million General Fund. Below, we describe the main components of the proposal and provide our analysis and recommendations in conjunction with each component. Overall, we find the Governor’s proposed multiyear plan addresses legislative interest in increasing inspection frequency. However, we find it premature to approve the multiyear plan in totality—in particular the plan’s proposal to further increase inspection frequencies in future years—and recommend the Legislature approve only the first stage of the proposal at this time.
The Governor’s proposal would increase the frequency of inspections from at least once every five years to at least once every three years or more frequently depending on the facility type. To implement this component of the plan, the Governor requests a total of 133 positions, mostly licensing analysts. The Governor envisions hiring staff beginning in 2015–16 (with five positions) and incrementally through 2018–19 to correspond with the increased workload as the various stages of the proposal go into effect. Once fully implemented, child care facilities would be inspected every three years, children’s residential care facilities would be inspected every two years, and adult and senior care facilities would be inspected annually. The CCL division would continue to conduct random inspections on at least 30 percent of all facilities annually as is current practice. The changes to inspection frequency would go into effect in stages as follows:
- Stage 1 of Increased Inspection Frequency: Sets Inspection Frequency for All Facility Types to at Least Once Every Three Years. Beginning in January 2017, the inspection frequency for child care, children’s residential care, and adult and senior care facilities would be set at no less than once every three years.
- Stage 2 of Increased Inspection Frequency: Increases Inspection Frequency for Residential Care Facilities to at Least Once Every Two Years. Beginning January 2018, the inspection frequency for children’s residential care and adult and senior care facilities would increase to no less than once every two years. The child care facilities would continue with an at least once every three years inspection frequency.
- Stage 3 of Increased Inspection Frequency: Increases Inspection Frequency for Adult and Senior Care Facilities to at Least Annually. Beginning January 2019, adult and senior care facilities would be inspected at least annually. The children’s residential care facilities would continue with an at least once every two years inspection frequency.
Figure 16 compares current law to the Governor’s proposed inspection requirements by facility type and over time.
Figure 16
Inspection Frequency: Current Law and Governor’s Proposal, by Facility Type
|
Facility Type
|
Current Law
|
Governor’s Proposal
|
|
Stage 1:
January 2017
|
Stage 2:
January 2018
|
Stage 3:
January 2019
|
|
|
Inspections must occur at least once every. . .
|
|
Child care facilities
|
5 years
|
3 years
|
3 years (unchanged from stage 1)
|
3 years (unchanged from stage 1)
|
|
Children’s residential care facilities
|
5 years
|
3 years
|
2 years
|
2 years (unchanged from stage 2)
|
|
Adult and senior care facilities
|
5 years
|
3 years
|
2 years
|
1 year
|
Increasing Inspection Frequency Could Increase Ability to Discover Potential Threats to Residents Before Harm Occurs. Inspections that are more frequent could help overcome some of the recent health and safety incidents discovered at facilities under the regulatory purview of CCL, including incidents of neglect and abuse. Prolonged intervals between inspections allow noncompliance to occur and remain unaddressed, placing children, adults, and seniors at risk, while more frequent inspections could provide more consistent and adequate oversight and enforcement of licensing standards. There has been concern that five–year intervals between inspections are too lengthy and place vulnerable clients at risk. (Most states inspect such facilities more frequently than at least once every five years.) Although three–year inspection intervals seems like a reasonable minimum standard for inspection frequency moving forward, the optimal inspection interval is difficult to identify and likely varies among facilities.
Multiyear Plan Should Better Focus Additional Compliance Efforts in Manner That Maximizes Outcomes. We understand the Governor’s proposal to set inspection frequencies based on three very broad categories of facility type is driven in part by the degree of “informal” oversight available at each facility type. Informal oversight refers to the feedback clients or clients’ families can offer providers or state officials regarding realized or potential threats to health and safety at CCL–licensed facilities. On the basis that child care facilities receive the highest level of informal oversight through the flow of parents in and out of facilities on a daily basis, the administration is of the view that parents’ ability to identify risks and file complaints justifies the longer interval between inspections for this facility type. By comparison, the administration indicates adults and seniors are the most vulnerable as they receive the least amount of informal oversight and therefore require the most frequent inspections.
While the Governor’s approach has a certain appeal, it may not be the most cost–effective way to allocate enforcement resources based solely on facility type. For example, a child care center facing staffing challenges in a tight labor market may have chronic problems complying with health and safety standards while a Residential Care Facility for the Elderly (RCFE) facing fewer staffing challenges may have a longstanding history of providing a safe environment for its clients. In this example, the Governor’s proposal would require a cost–ineffective allocation of enforcement resources—annual inspections for the well–performing RCFE and inspections at three–year intervals for the poor–performing child care center.
Rather than setting inspection frequency based solely on broad facility type, as proposed by the Governor, we recommend that the choice of increased inspection frequencies (above the once every three years level) be based on data that target resources to individual facilities with the greatest likelihood of improving compliance. We note that lengthening inspection intervals (still no less than once every three years) for well–performing facilities—through a model that uses data to help the department target enforcement resources to cases with the greatest likelihood of compliance problems—creates the flexibility and capacity for licensing analysts to visit poor–performing facilities even more frequently than is proposed in the Governor’s plan. (In other words, annual inspections could be too infrequent for the chronically poor performers.)
We also believe that the proposal to increase inspection frequency beyond once every three years is premature. That is, the outcomes from recent reforms—just in the beginning stages—will need to be evaluated in order to assess the need for adjusting inspection frequency.
We therefore recommend the Legislature approve stage one of the Governor’s proposal, setting a minimum inspection frequency for all facility types to at least once every three years, while directing DSS to develop a data–driven model to determine the appropriate frequency of inspections for the future stages of the Governor’s plan. The data gathered through the new quality assurance unit, as well as the trends observed through the centralized application and statewide complaint hotline, could help determine how best to target enforcement resources in a cost–effective way for subsequent stages.
Requested Resources Based on Outdated Workload Study, Staffing Levels Necessary to Implement Plan Uncertain. The requested resources for the Governor’s multiyear plan are based on a 2001 workload study on licensing analysts. Yet the nature of a licensing analyst’s workload has changed considerably over the last 14 years. In some cases workload has increased, such as through the addition of new statutory responsibilities. On the other hand, the introduction of the Key Indicator Tool—a measurement tool that is designed to measure compliance with a small number of licensing standards to predict compliance with all of the remaining licensing standards—has reduced workload for licensing analysts. The net effect of these changes on licensing analysts’ workload is uncertain. Therefore, the 2001 study may no longer accurately reflect a licensing analyst’s workload. Only once a revised study is available would DSS be able to assess the actual level of staffing resources necessary to increase the frequency of inspections as proposed. The DSS has been working towards a revised workload study. While the study was originally expected to be completed by December 2014, it is now expected to be delayed by more than one year. Given that the final results from the workload study will not be available until after the conclusion of the 2015–16 budget process, we recommend approval of the requested first–stage resources based on the existing standards, as we think moving towards an increased level of inspection frequency for facilities beginning in 2016–17 is consistent with legislative intent. We note that the department may be able to update its requested resources at the May Revision based on preliminary findings from its revised workload study. Should such information be available, we recommend that it be presented to the Legislature at May Revision to enable it to evaluate whether any budget adjustments are appropriate. We also recommend that the Governor’s budget proposal in 2016–17 reflect the findings of the revised workload study and incorporate the budget adjustments necessary to conform to the study.
Additional Changes to Inspection Frequency Likely Necessary in Future Years to Comply With Federal Child Care and Development Block Grant (CCDBG) Requirements. The recent reauthorization of the federal CCDBG requires annual inspections of child care facilities as a requirement of continued federal funding to states. The administration is currently awaiting additional federal guidance on this, although no state action to conform to the federal law changes appears necessary in 2015–16.
As described above, CCL has experienced an increase in complaints since budget–related legislation lengthened the intervals between visits. The department indicates the increase in complaints—coupled with reductions in staff in recent years that have not been fully remedied by the elimination of furloughs, hiring of replacement staff, and the use of overtime—have created a complaint backlog. Point–in–time data from January 2015 show 2,450 complaints remained unresolved beyond the 90–day period CCL allots for investigating and addressing substantiated complaints. These are referred to as “overdue” complaints. Figure 17 provides a breakdown of open and overdue complaints by facility type as of January 2015. The Governor’s 2015–16 budget proposes 13 two–year limited–term licensing analyst positions to address the complaint backlog.
Figure 17
Community Care Licensing (CCL) Division’s Open and Overdue Complaints
January 2015
|
Facility Type
|
Total Open Complaints
|
Complaints Open Over 90 Daysa
|
|
Child care
|
550
|
65
|
|
Children’s residential care
|
1,615
|
820
|
|
Adult and senior care
|
2,505
|
1,565
|
|
Totals
|
4,670
|
2,450
|
Limited–Term Resources to Address Complaint Backlog Seems Reasonable. We find that the proposed positions would help (1) address the risk to clients that prolonged complaint investigations represent, (2) make programs current on addressing existing complaints, and (3) keep programs within the requirement to close complaint cases within 90 days going forward. The DSS has increasingly had to dedicate resources to responding to complaints driven in part by the decreased inspection frequency. This is a vicious cycle that is exacerbated over time so that DSS now has a backlog of complaints and reduced ability to complete inspections. Clearing the backlog would free resources to engage in proactive enforcement rather than responding to violations where harm may have already occurred. Once the backlog is cleared, we expect that recent changes to the CCL program and components of the 2015–16 budget proposal, if approved, would prevent a return of overdue complaints. The more frequent facility visits and expansion of resources that support providers between visits, such as the technical assistance unit, are likely to reduce the instances of noncompliance and therefore lead to a smaller number of complaints going forward. For these reasons, we recommend approval of the proposed use of limited–term positions to address the backlog in overdue complaints.
Historically, RCFEs have been considered differently from skilled nursing facilities (SNFs) because their purpose is to serve those with less acute medical needs than those who would qualify for SNF placement. However, as the state’s population has aged, and the general state policy goal of caring for people in the least restrictive setting has been emphasized, the role of the RCFEs has also changed to include those with more acute medical conditions. As a result, the CCL division has had to assess on a case–by–case basis whether residents can safely remain within a CCL–licensed facility rather than being cared for in a SNF. Currently, DSS contracts for this clinical expertise. The Governor’s 2015–16 budget proposes position authority for 1.5 nurse consultant positions to replace the use of contract staff for this purpose. The nurse consultants would be strategically located throughout the state so as to easily be deployed when licensing analysts need the assistance of medical experts.
Reasonable for State Staff to Assess Medical Needs of Clients. Ensuring that clients are appropriately treated is critical to the long–term health and wellness of clients. The use of contract staff was reasonable at an earlier time when there was only relatively infrequent and periodic need for medical expertise. However, as the population of CCL–licensed facilities has become more medically fragile, licensing investigators have had to increasingly leverage the medical expertise of the contract staff to assess the appropriate placement of clients. Since assessing the medical needs of clients has become an ongoing workload, there are benefits to developing in–house state expertise in this area. We therefore recommend approval of the proposed nurse consultant positions.
The Child Care Advocate Program (CCAP)—formerly the Child Care Ombudsman Program—was established in 1984 to provide information to the general public and parents on child care licensing standards and regulations. The program’s goal was to improve the level of engagement of client–families and advocates so as to ultimately enhance the quality of care delivered at child care facilities. The Technical Support Program (TSP) was established in 1992 to (1) assist residential care providers who were experiencing difficulty in complying with licensing standards and in achieving and maintaining compliance with licensing requirements, and (2) offer trainings to providers in specific areas where licensing analysts identified chronic noncompliance. Budget pressures in recent years reduced staffing for CCAP to two positions while eliminating TSP. The Governor’s 2015–16 budget proposes position authority to add two positions to CCAP and provide three positions for TSP to expand the availability of technical assistance to providers. These resources would be available to respond to compliance–related questions and requests from providers and the public–at–large.
Detection and Remediation of Compliance Problems Through Technical Assistance Could Be More Efficient Than Depending on Complaints. We find that the requested additional resources to provide more up–front guidance to providers (that is, prior to an enforcement action being taken) are a good investment. Focusing on detection and remediation of compliance problems through technical assistance to facilities could be a more efficient way to address compliance problems that relying on complaints. Providing a link between facilities and the public–at–large through the advocacy program could foster constructive engagement between clients and providers and help encourage compliance with standards. For these reasons, we recommend approval of the Governor’s budget proposal for five positons to expand CCAP and reestablish TSP.
The CCL division operates a training unit in Northern California that is responsible for training all new managers and licensing analysts at the time of hire. Additional training is provided as needed so that licensing inspectors remain current on regulatory requirements as statute changes. The division does not anticipate being able to absorb the increase in demand for training from the newly hired licensing analysts. In addition, the CCL division is interested in offering more robust ongoing training to licensing analysts based on special topics of relevance. The Governor’s 2015–16 budget proposes four positions to establish a new Southern California training unit and to extend ongoing training offerings to current managers and licensing analysts.
Expansion of Training Unit, Establishing Refresher Training Courses Seem Reasonable. We agree that additional resources are necessary to train the influx of new licensing analysts anticipated as the frequency of required visits increase for CCL–licensed facilities and that a more robust ongoing training program would be valuable. Establishing a Southern California unit would make trainers more readily available throughout the state to offer licensing inspectors tailored support at their respective regional offices. Additional trainings could also improve the consistency and adequacy of the enforcement of licensing standards. The quality assurance unit, statewide complaint hotline, and centralized application unit could be valuable sources of data to help identify areas where compliance may be most problematic and be a source of training topic ideas. For these reasons, we recommend approval of the Governor’s budget proposal for the Southern California training unit and expanded training offerings.
Overall, we find that the Governor’s proposal is responsive to the Legislature’s interest in decreasing the time interval between required inspections. Increasing the inspection frequency for all facility types to at least once every three years (the first stage of the Governor’s proposal) is a reasonable first step. However, future–year changes to further increase inspection frequencies should be based on the need for targeted inspections of the most problematic facilities as identified by data analysis rather than solely on broad facility type as proposed by the Governor. We are not recommending a reduction in resources for the department’s enforcement efforts. Rather, our recommended approach is intended to allocate enforcement resources more cost–effectively. The other components of this proposal build on the comprehensive reforms approved in 2014–15 and are a reasonable response to identified failings of CCL, including the recent health and safety issues uncovered in facilities licensed by CCL. Finally, we have concerns that the Governor’s request for staffing resources is based on an outdated workload study. To the extent possible, the approved level of staffing should reflect the findings from an updated workload study currently in progress.
Accordingly, we recommend that the Legislature:
- Approve stage one of the Governor’s proposal to ramp up the inspection frequency—setting a minimum inspection frequency for all facility types to at least once every three years beginning in 2016–17. Given that the final results from the workload study will not be available until after the conclusion of the 2015–16 budget process, we recommend approval of the first–stage resources based on the 2001 workload study as we think moving towards an increased level of inspection frequency for facilities beginning in 2016–17 is consistent with legislative intent. Should preliminary findings from the revised workload study be available by the May Revision, we recommend that these be provided to the Legislature to evaluate whether any budget adjustments are appropriate. (The first phase of the Governor’s proposal includes 57.5 managers and licensing analysts and various support positions across 2015–16 and 2016–17.)
- Reject the proposal to increase inspection frequency beyond stage one at this time.
- Direct DSS to develop a data–driven model to determine inspection frequency so that future stages of the Governor’s plan target inspections to individual facilities with the greatest likelihood of improving compliance.
- Approve the requested 13 two–year, limited–term positions and associated expenditure authority to address the backlog in overdue complaints.
- Approve the requested positon authority for 1.5 nurse consultant positions to provide medical expertise to licensing analysts.
- Approve the requested positon authority for five positons to expand CCAP and reestablish TSP.
- Approve the requested four positions and associated expenditure authority to establish a new Southern California training unit and to extend ongoing training offerings to current managers and licensing analysts.
The CalWORKs program was created in 1997 in response to 1996 federal welfare reform legislation that created the federal Temporary Assistance for Needy Families (TANF) program. CalWORKs provides cash grants and welfare–to–work services to families whose income is inadequate to meet their basic needs.
Cash Assistance. Grant amounts vary across the state and are adjusted for family size, income, and other factors. For example, a family of three in a high–cost county that has no other income currently receives a cash grant of $670 per month (equivalent to 40 percent of the FPL). A family in these circumstances would generally also be eligible for food assistance through the CalFresh program in the amount of $503 per month and health coverage through Medi–Cal.
Work Requirement and Time Limit. As a condition of receiving aid, able–bodied adults are generally subject to a work requirement, meaning that they must be employed or participate in specified activities—known as “welfare–to–work activities”—intended to lead to employment. CalWORKs cases that include individuals subject to the work requirement are entitled to receive services to help meet the requirement, including subsidized child care and reimbursement for transportation and certain other expenses. Adults who fail to comply with the work requirement without good cause are sanctioned by being removed from the calculation of their family’s monthly grant, resulting in decreased cash assistance (generally by about $130). Adults are also generally limited to a cumulative lifetime maximum of 48 months of assistance in CalWORKs. Adults that exhaust 48 months of cash assistance are similarly removed from the calculation of their family’s monthly grant, resulting in decreased cash assistance. (The family would continue to receive a reduced grant for children that remain eligible.)
Funding. CalWORKs is funded through a combination of California’s federal TANF block grant allocation ($3.7 billion annually), the state General Fund, and county funds (including significant amounts spent by counties as a result of state–local realignment). In order to receive its annual TANF allocation, the state is required to spend an MOE amount from state and local funds to provide services to families eligible for CalWORKs. In recent years, this MOE amount has been $2.9 billion. While the CalWORKs program makes up a majority of TANF and MOE spending, the TANF block grant is used to fund some programs in addition to CalWORKs, and some General Fund expenditures outside CalWORKs are counted toward the MOE requirement.
As shown in Figure 18, the Governor’s budget proposes $5.8 billion in total funding for the CalWORKs program in 2015–16, a net increase of $116 million (2 percent) over estimated current–year funding. This increase reflects the net effect of increased costs for cash grants, employment services, child care, and other program activities, offset by a small decrease in administrative costs. These year–over–year changes are largely the result of (1) reduced grant costs from a declining caseload, partially offset by expected increased utilization of employment services and child care, and (2) the implementation of program changes enacted in prior years, most significantly a 5 percent grant increase that is scheduled to take effect in April 2015, the cost of which will more than offset grant savings resulting from a declining caseload. Within the total funding amount, the Governor’s budget proposes $663 million in General Fund support for CalWORKs, an increase of $13 million (2 percent) above estimated current–year levels.
Figure 18
CalWORKs Budget Summary
All Funds (Dollars in Millions)
|
|
2014–15
Estimated
|
2015–16
Proposed
|
Change From 2014–15
|
|
Amount
|
Percent
|
|
Cash grants
|
$3,201
|
$3,242
|
$41
|
1%
|
|
Employment services
|
1,422
|
1,464
|
41
|
3
|
|
Stage 1 child care
|
330
|
362
|
32
|
10
|
|
Administration
|
533
|
523
|
–10
|
–2
|
|
Othera
|
170
|
181
|
12
|
7
|
|
Totals
|
$5,656
|
$5,771
|
$116
|
2%
|
The Governor’s 2015–16 CalWORKs budget proposal continues current–year policy and makes adjustments only to reflect costs and savings associated with changes in caseload and ongoing implementation of previously enacted policy changes. We find that the administration’s estimates are reasonable and consistent with current policy. The following sections review the administration’s caseload projections for CalWORKs and describe how implementation of some recent policy changes will affect the program’s budget.
Gradual CalWORKs Caseload Decline Expected to Continue During Budget Year. The CalWORKs caseload has been consistently declining since 2011–12 at an average rate of about 2 percent annually, primarily due to an improving labor market. The budget estimates that the average monthly number of CalWORKs cases in 2014–15 will be 543,557—1.3 percent lower than in the previous year. The average monthly number of cases is projected to further decline by 1.9 percent in 2015–16 to 533,335 cases. We find the administration’s total caseload estimate reasonable and consistent with our expectations of a long–term downward caseload trend as the labor market continues to improve.
Utilization of Supportive Services Expected to Increase. While the total CalWORKs caseload is estimated to decline in both 2014–15 and 2015–16, the number of cases utilizing employment services and subsidized child care is assumed by the budget to increase somewhat in both of these years. In 2014–15, increased utilization of these services is primarily the result of the ending of a prior policy that exempted certain CalWORKs cases with young children from the work requirement. Going forward, utilization may continue to increase. It is difficult to assess whether utilization will continue to increase in 2015–16 based on our review of available data. Additional data will be available to refine the estimate at the time of the May Revision and we will report to the Legislature at that time whether adjustments are warranted.
Governor’s Proposal Funds Full–Year Costs of Previously Approved Grant Increase. . . As part of the 2014–15 budget package, the Legislature approved a 5 percent CalWORKs grant increase that will take effect in April 2015. For a family of three in a high–cost county that has no other income, the amount of cash assistance received will increase to $704 per month (42 percent of FPL), while the statewide average grant is expected to rise to $507 per month during 2015–16. The administration estimates that the cost of providing this grant increase from April through June of 2015 is $44 million, with a full–year cost in 2015–16 of $175 million. Pursuant to state law, this increase is to be funded first with local funds allocated from the Child Poverty and Family Supplemental Support subaccount (hereafter “Child Poverty subaccount”), which is part of the 1991 realignment funding structure. The General Fund is required to pay for any shortfall when Child Poverty subaccount funds are insufficient. The Governor’s proposal estimates that $101 million in Child Poverty subaccount funds will be available to pay the cost of this increase in 2015–16, with the General Fund covering the remaining $73 million.
. . .And Does Not Assume Further Grant Increases Through Statutory Mechanism. Current law requires that CalWORKs grants be automatically increased in years when Child Poverty subaccount funds are sufficient to cover the cost of such an increase, as well as the ongoing cost of all previous increases provided from Child Poverty subaccount funds. The Governor’s proposal assumes that no automatic grant increase will be provided in 2015–16 since Child Poverty subaccount funds are insufficient to cover the ongoing cost of prior grant increases, including the April 2015 increase described above. We estimate that Child Poverty Subaccount funds will not be sufficient to provide an additional grant increase until 2017–18.
Some CalWORKs Recipients Will Reach 24–Month Time Limit During 2015. . . As part of the 2012–13 budget package, the Legislature enacted two significant changes to the CalWORKs work requirement. First, the state rules that specify which activities adult recipients may participate in were changed to provide greater flexibility to address their barriers to employment. Second, a new 24–month limit on adult eligibility for CalWORKs assistance under the more flexible work requirement was introduced. Once 24 months of assistance under the more flexible work requirement have been exhausted, adult recipients may continue to receive assistance (up to the maximum lifetime limit of 48 months), but must meet a relatively less flexible work requirement that closely mirrors the work requirement in federal TANF law. The federal work requirement places heavier emphasis on employment, as opposed to some other activities such as education, training, or mental health and/or substance abuse treatment. As noted above, recipients that fail to meet the applicable work requirement (either the flexible state requirement available for 24 months or the less flexible federal requirement that applies thereafter) are sanctioned by having their family’s grant reduced by the adult portion. Months counted toward the 24–month limit need not be consecutive, such that adults that participate in activities that meet the federal requirement in any given month will not have that month counted against their limit. A county may also extend the time available to participate under flexible state rules for 20 percent of cases that have passed the 24–month limit in that county. Some CalWORKs recipients will begin to reach the 24–month limit for the first time during 2015.
. . .But Impact on Recipients and State Budget Is Uncertain. Some CalWORKs recipients that reach the end of their 24 months of participation under the flexible state work requirement will successfully transition to meeting the federal requirement and will continue to be assisted. Others will fail to comply with the federal work requirement, resulting in reduced cash assistance for those cases and grant savings for the state. Based on very limited data, the Governor’s budget assumes that there will be no savings in 2014–15 from the 24–month time limit and $6.4 million (General Fund) in savings in 2015–16. This is equivalent to roughly 7,500 cases—a little over 1 percent of the total caseload—experiencing an ongoing reduction in cash assistance by the end of 2015–16 as a result of the 24–month time limit. More recent data that was not available at the time the administration’s estimates were developed suggests that there may be a limited number of cases (at most 1,200) that could reach the 24–month limit before the end of 2014–15 and have their cash assistance reduced. Additional data will be available at the time of the May Revision to improve estimates of the impact of the 24–month time limit on recipients and the CalWORKs budget.
Expanded Eligibility of Drug Felons Increases Costs. As part of the 2014–15 budget package, the Legislature provided CalWORKs eligibility to certain adults that had previously been ineligible due to prior drug–related felony convictions. This eligibility change is scheduled to be implemented in April 2015. The Governor’s budget estimates that costs to pay for increased cash assistance and services (including employment services and child care) for newly eligible adults in the final three months of 2014–15 will be $8.2 million (General Fund) and $23.2 million (General Fund) in 2015–16. Beginning in 2015–16, the budget assumes that a portion of newly eligible adults will begin working, resulting in offsetting grant savings. As a result, increased spending to provide eligibility to this population in 2015–16 will primarily pay for services.
Higher Child Care Reimbursement Rates Increase Child Care Costs. As part of the 2014–15 budget package, the Legislature increased the maximum amount by which providers of child care for CalWORKs recipients may be reimbursed, effective January 2015. This will increase costs in the broader CalWORKs child care system, which is funded partly in DSS (known as “Stage 1”) and partly in the California Department of Education (known as “Stage 2” and “Stage 3”). The Governor’s budget estimates that the cost to fund this rate increase in Stage 1 during the last half of 2014–15 will be $12.1 million (General Fund) and $25.6 million (General Fund) in 2015–16.
The state’s foster care system provides temporary out–of–home placement for children who have been removed from their homes due to abuse or neglect. The foster care system relies on a continuum of placement types, ranging from the homes of relatives to institutional group care settings. State law requires that foster children be placed in the least restrictive, most family–like setting possible. Concerns about a lack of availability of less–restrictive placements that are able to meet the sometimes significant needs of foster children have motivated efforts to identify new ways to provide services and supports that would allow for greater reliance on more family–like settings and less reliance on institutional group care settings. In January, DSS released a series of recommendations pursuant to legislative direction, collectively known as “continuum of care reform” (CCR), that are intended to address some of these concerns. In conjunction with the release of the CCR recommendations, the Governor’s budget proposal includes $9.6 million ($7 million General Fund) to begin implementation of the recommendations. In this analysis, we describe the existing foster care system and the concerns that motivated the development of the CCR recommendations, provide a high–level overview of the recommendations, describe the Governor’s budget proposal, and identify some issues that will likely play a key role as the budget proposal is considered in the context of broader CCR implementation.
State Is Accountable to Federal Government for Foster Care Outcomes. The federal government provides funding to states to pay for a portion of foster care primarily through Title IV–E of the Social Security Act. In connection with this funding, the federal government enacts laws and policies that require state compliance. Some of these requirements relate to the allowable use of federal Title IV–E funds. Others relate to child well–being outcomes and standards against which the state’s performance is evaluated. States that fail to meet federal standards are required to enter into corrective action plans and can be assessed financial penalties for continued noncompliance. In areas not directly governed by federal law, the state has some flexibility. For example, the state has some discretion to determine the amount of payments that are received by different placement types to care for foster children. The state’s structure for paying foster care providers will be discussed in greater detail later. The state also has flexibility to delegate the direct administration of foster care to counties, which it has chosen to do.
Counties Implement State Policy, With Some Local Flexibility. Under the supervision of the state, county child welfare agencies are directly responsible for administering the foster care system, including finding temporary placements and finding permanent adoptive parents or guardians for children who cannot be safely reunified with their families. In addition to county welfare agencies, county probation agencies perform case management (including placement services) for foster children who are also involved with the juvenile justice system. The state provides counties some flexibility in how they operate their local programs, and therefore there is some variation in administration and services offered across the state. For example, counties have the discretion to provide supplemental payments to foster families that care for children that have special behavioral or medical needs. This aspect of the foster care system will be discussed later in greater detail.
Realignment Transferred Fiscal Responsibility for Foster Care to Counties. Prior to 2011–12, the state and counties shared the nonfederal costs of administering the foster care system. In 2011, the state enacted legislation known as the 2011 realignment, which transferred nonfederal funding responsibility for foster care and dedicated a portion of the state sales tax (in lieu of General Fund dollars) to the counties. Under 2011 realignment, counties bear the fiscal risk of administering foster care. This means that if costs in the program increase from year to year, counties are generally required to pay the full nonfederal portion of these increased costs. (Generally, counties would also receive the full nonfederal share of any savings in the event that program costs fall from year to year.) Additionally, legislation enacting 2011 realignment provided that counties are not required to implement any changes in state policy that increase overall program costs by instituting a higher level of service than what was required at the time 2011 realignment was enacted, unless the state provides funding to cover these increased costs. Proposition 30, approved by voters in November 2012, placed similar language in the State Constitution. This requirement means that the state generally must compensate counties for any changes in state policy that increase the costs of administering foster care.
When finding a temporary placement for a foster child, counties have a variety of placement options to choose from. The four primary placement options are described below. Figure 19 shows the distribution of foster care placements across these options.
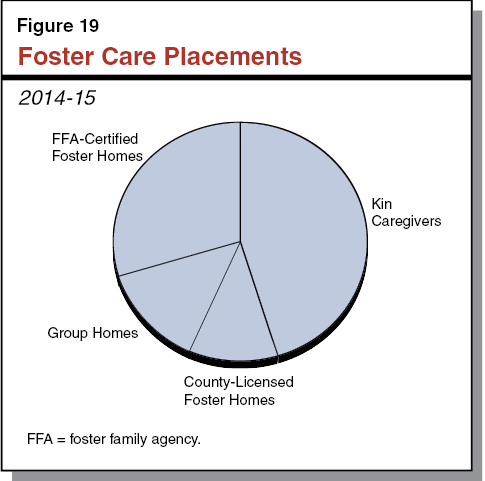
Kinship Care. Kinship care refers to when a foster child is placed with a relative for care and supervision. Under federal and state policy, kinship care is generally preferred over other foster care placement types, as it is the least restrictive, most family–like option. Currently, about 45 percent of children in foster care are placed with kin caregivers.
County–Licensed Foster Family Homes (FFHs). Foster parents can be licensed by counties to provide temporary care and supervision for foster children in their homes. If a suitable relative placement cannot be found, a foster child may be placed in such a county–licensed FFH by the county. Counties are generally responsible for the recruitment of FFH caregivers. Currently, about 11 percent of children in foster care were placed in a county–licensed FFH setting.
Foster Family Agency (FFA)–Certified Foster Homes. FFAs are private, nonprofit agencies defined under state law that recruit foster parents to provide care and supervision for foster children, generally those with elevated needs relative to children placed with county–licensed FFHs. Because of their elevated needs, these foster children would otherwise be at risk for group home placement. The FFAs provide more services to the foster parents and more frequent home visits than counties provide to county–licensed FFHs. Currently, about 30 percent of children in foster care were placed in foster homes through an FFA.
Group Homes. Group homes, sometimes referred to as congregate care placements, provide 24–hour care, supervision, and services to foster children with significant emotional or behavioral problems that require a more restrictive environment than a foster home. Group homes vary in size, services provided, and level of supervision provided by group home staff. Group homes are the most restrictive and least family–like placement type (excluding foster children supervised by probation agencies), and therefore are generally the least preferred option for placement. Currently, about 13 percent of children in foster care were placed in a group home.
Most Family–Based Placements Receive Same Basic Rate for Care and Supervision. As shown in Figure 20, family–based placements—including kin caregivers that are eligible for federal foster care payments, county–licensed FFHs, and FFA–certified foster homes—all receive the same monthly payment in compensation for the monthly costs of care and supervision, such as food, shelter, clothing, and other expenses the household incurs to care for the child. This monthly payment is sometimes referred to as the “basic rate.” The basic rate is adjusted annually to reflect changes in cost of living.
Figure 20
Monthly Foster Care Provider Rates
Rate Per Child, by Placement Type, 2014–15
|
Rate Type
|
Kin Caregivers
|
|
County–
Licensed
FFH
|
FFA–Certified Foster Homes
|
Group Homes
|
|
Eligible for Federal Foster Care Payments
|
Not Eligible for Federal Foster Care Payments
|
|
Basic rate (care and supervision)
|
$670 – $838
|
$369a
|
|
$670 – $838
|
$670 – $838
|
$2,332 – $9,879b
|
|
Specialized care increment?
|
Yes
|
No
|
|
Yes
|
No
|
No
|
|
Child increment?c
|
No
|
No
|
|
No
|
$189
|
No
|
|
Administration and social work rate?
|
No
|
No
|
|
No
|
$868 – $968
|
No
|
Under Current Law, Certain Kin Caregivers May Not Receive Basic Rate. One notable exception to family–based placements receiving the basic rate is when a kin caregiver placement is not eligible for Title IV–E federal funding. (Eligibility for federal foster care funding is determined by the circumstances of the family from which the foster child is removed, not the foster care provider with whom they are placed.) Under current state law, nonrelative foster care placements (for example, a placement with a county–licensed FFH) that are ineligible for federal funding receive the basic rate, paid for with nonfederal funds. In lieu of the basic rate, kin caregiver placements that are not eligible for federal funding receive a cash grant through the CalWORKs program that is significantly less than the basic rate. Roughly a quarter of kin placements are estimated to be receiving a CalWORKs grant in place of the basic rate.
Recently Enacted Approved Relative Caregiver (ARC) Funding Option Program Provides Basic Rate to All Kin Caregivers at County Option. In 2014, the Legislature created the ARC Funding Option Program, which provides state funds to counties that choose to pay all kin caregivers the basic rate, regardless of eligibility for federal foster care payments. To protect the state from the risk of future growth in costs due to caseload changes, but to also avoid requiring counties to provide a higher level of service without compensation (which is not permissible under 2011 realignment), the program was made optional. As such, counties that choose to participate may use the appropriated General Fund dollars to provide increased payments to kin caregivers, but are responsible for any additional costs that may result in the future from changes in the affected caseload. Counties that choose to implement the ARC Funding Option Program have the flexibility to opt out at a later date. Currently, no counties have formally opted into the program, although most have expressed preliminary interest in participating. As a result, different kin caregiver placements continue to receive different payments based on whether or not the placement is eligible for federal funding.
County–Licensed FFHs and Some Kin Caregivers Additionally May Receive Specialized Care Increment at County Option. Most counties have a “specialized care increment” system that provides supplemental payments, in addition to the basic rate, to foster homes that are caring for a foster child with significant health or behavioral needs. County–licensed FFHs and kin caregiver placements that are eligible for federal foster care payments may receive a specialized care increment. (Kin caregiver placements that are not eligible for federal foster care payments may not, even if a county opts into the ARC Funding Option Program.) Not all counties provide a specialized care increment, and the amount of supplemental payments provided varies across counties that do—ranging from less than $100 to more than $1,000 monthly.
FFA–Certified Foster Families Receive Services, Treatment, and Child Increment. The FFAs receive a monthly rate that consists of different components, including an administration rate, a social worker rate, a child increment rate, and the basic rate. The basic rate, as noted above, is adjusted annually to reflect changes in cost of living. The other components of the FFA rate were reduced by 10 percent in 2009 in order to achieve General Fund savings and have not been increased since that time. At a minimum, the child increment, which is intended to reflect the elevated needs of foster children placed in FFA certified homes, and the basic rate are required to be passed through to foster parents. The social work and administration components of the FFA rate are typically retained by the FFA to provide services and treatment to certified foster families. Available services and treatment vary across FFAs, but could include additional social worker visits to the home, therapy, or in some cases mental health treatment.
Group Homes Receive Rates Based on Rate Classification Level (RCL) System, Provide Intensive Services and Treatment. Group homes receive standard monthly rates based on the RCL system that are generally much higher than rates provided for family–based placements. For example, the RCL system features 14 rate levels that in 2014–15 range from $2,322 per month for level 1 to $9,879 per month for level 14. A provider’s rate level is primarily determined by the qualifications of its staff and the number of staff hours that it proposes to provide children placed in its facility. Available services and treatments vary across group homes and may include counseling and mental health treatment.
Research Suggests That Prolonged Group Home Placement Can Be Detrimental for Most Foster Children. Research suggests that, while there are circumstances in which group home placement is warranted, for the majority of foster children, sustained group home placement is associated with negative outcomes, including increased later involvement with the criminal justice system, increased rates of reentry into foster care, and lower educational achievement. The DSS estimates that more than two–thirds of children placed in group homes remain there longer than two years.
Group Homes Are More Costly Than Other Placement Types. As noted above, group home placements cost significantly more than other family–based placement options. Continued placement of foster children in group home settings when they could successfully be served in family–based settings may not only be less effective, but also a less efficient use of foster care resources.
Concerns About Adequacy of Family–Based Placements. Reducing reliance on group home placements has been a priority for the state for some time. One major challenge to reducing reliance on group home placements is having an adequate supply of family–based placements, particularly those capable of caring for children whose elevated needs make them at risk for group home placement. In recent years, counties have reported a shortage of county–licensed FFHs, particularly in high–need areas of the state. Additionally, as discussed above, services and supports to enable family–based placements to care for children at risk for group home placement are not available to all family–based placement types. Ensuring the adequacy of family–based placements is a key consideration if reliance on group home placements is to be further reduced.
Budget Legislation Called for Stakeholder Workgroup. In connection with the 2012–13 Budget Act, DSS was required to establish a stakeholder workgroup to recommend revisions to rates, services, and programs in the foster care system, focusing attention, at a minimum, on services and programs provided by group homes and FFAs. The Legislature specified that the workgroup consider, among other things, (1) how assessment processes could be structured to match a foster child’s characteristics to the appropriate placement setting, (2) how providing services more comprehensively could improve foster child outcomes, (3) how these services could be better provided in family–like settings, and (4) how quality evaluations and rate–setting systems could be used to improve the quality of placements. The Legislature required that DSS submit recommended revisions for the Legislature’s consideration by October 2014.
The DSS convened a stakeholder workgroup pursuant to this legislation in 2012. Workgroup discussions continued through the following three years. In January 2015, concurrent with the release of the Governor’s budget proposal, DSS released California’s Child Welfare Continuum of Care Reform, a report that features 19 recommendations based on workgroup discussions. The main objective of the recommendations is to improve the experience and outcomes of children and youth in foster care by (1) improving assessments of children and families to make better initial placement decisions, (2) emphasizing family–based placements by providing appropriate services and supports, (3) changing the goals of group home placements, and (4) increasing transparency and accountability for child outcomes. The report’s specific recommendations fall into a few general areas as discussed below. The following description includes major aspects of the CCR recommendations, but is not intended to be a comprehensive summary.
Recommendation on Assessments. Counties are currently required to use assessments when initially placing a foster child. Under the CCR recommendations, counties would be required to use assessments with standard features and would use the assessment to make placement decisions with the help of a “child and family team” consisting of the child, the child’s family, and social workers.
Residential Treatment Recommendations. Under the CCR recommendations, placements in lower–level group homes (specifically those with RCL one through nine) would be discontinued, and children currently placed in such group homes would be transitioned to family–based placements. Higher–level group homes would continue to be available as a placement option when children cannot safely be placed in a family–based setting, but would be refocused as “short–term residential treatment centers,” or STRTCs. The STRTCs would provide short–term, intensive therapeutic treatment and services based on more comprehensive assessments and specific care plans developed for each child that would explicitly address how the child would be transitioned to a family–based setting as quickly and appropriately as possible.
Home–Based Family Care Recommendations. To increase the capacity of family–based placements to care for children formerly in group home placements, services and supports would be more broadly available for family–based placements than under the current system. FFAs would be required to provide a more extensive set of core services to the foster families that they certify. Additionally, counties would be able to contract with FFAs to provide the same services to other foster families, including county–licensed FFHs and kin caregivers. Counties would also have the option to become licensed as FFAs and provide services to county–licensed FFHs and kin caregivers directly. Finally, the CCR recommendations would strengthen recruitment of foster families and increase training requirements to improve quality.
Fiscal Recommendations. The CCR recommendations envision some significant changes to the way payments are provided to STRTCs (formerly group homes) and FFAs. Under the recommendations, the RCL system would be replaced with a single, statewide STRTC rate. While a specific rate methodology for STRTCs is not identified in the recommendations, the new STRTC rate would likely be higher for many current group home providers due to increased requirements. For FFAs, the rate structure would be revised to recognize a distinction between FFAs that provide treatment and which are required to provide core services (as noted above) and FFAs that primarily focus on recruiting foster parents but do not provide treatment services. To account for expanded core services required to be provided by FFAs, the recommendations would increase the social worker component of the FFA rate.
Performance Measures and Outcomes Recommendations. In order to improve transparency and accountability in the foster care system, the recommendations would establish a series of performance measures and evaluate STRTCs and FFAs using these measures. Proposed performance measures would focus on outcomes including child safety, stability of placements, child health, and educational support. Data from these performance measures would be made publicly available to promote accountability. Additionally, a survey instrument would be designed to obtain feedback directly from foster children and families on the effectiveness of placements.
Full implementation of the recommendations in the CCR report would be a multiyear effort. For the 2015–16 budget, the Governor proposes funding to begin implementation of two of the report’s recommendations, as described below. Specifically, the proposal includes $3.8 million ($2.8 million General Fund) for counties to increase outreach, recruitment, and support for foster parents, and $5.8 million ($4.2 million General Fund) to increase the social worker component of the FFA rate by 15 percent, for a total of $9.6 million ($7 million General Fund). Overall, the Governor’s proposal would focus initial CCR implementation on building capacity in family–based placements before implementing other recommendations that would reduce group home placements. Because of 2011 realignment, the budget proposal does not assume counties will contribute funding and provides the full nonfederal share of costs from the General Fund.
Recommendations Broadly Consistent With Legislative Intent. . . We find that the CCR recommendations are broadly consistent with legislative intent. The recommendations address key issues raised by the Legislature, including changes to improve initial assessment, changes to the types of services provided and the placements in which they are provided to allow for greater emphasis on family–based settings, and increased evaluation of foster care placements to promote accountability and improve placement quality. Taken together, the CCR recommendations represent a significant policy shift for the state’s foster care system.
. . .Many Details Yet to Be Determined. At the present time, the CCR recommendations lack many key details necessary for implementation. Most notably, the recommendations provide little detail on specifically how the rates for STRTCs and FFAs would be structured to achieve CCR objectives. The administration has indicated that it intends to release a legislative package that would outline in broad terms how the CCR recommendations would be implemented. It will be important for the Legislature to consider the Governor’s overall plan as it makes decisions in the budget process.
Implementation of CCR Recommendations Complicated by Realignment. Whatever plan is ultimately agreed on, implementation of the CCR recommendations will be complicated by realignment. It is likely that changes in rates paid to FFAs and STRTCs, as well as new responsibilities for counties contemplated in the recommendations, will result in some new, possibly significant, county costs. Counties could choose to implement the CCR recommendations, but would not be required pursuant to the Constitution to do so unless the state provides funding for any increased costs. In the recent past, the state has been reluctant to expose the General Fund to new cost pressures in realigned programs, and has preferred to place caps on General Fund spending for policy changes in these programs and make implementation of such policy changes optional. This approach was used in enacting the ARC Funding Option Program as discussed previously. It is unclear at this time how the CCR recommendations would be implemented. If an approach similar to that taken with the ARC Funding Option Program is taken with the CCR recommendations, this will raise additional policy questions for the Legislature to address.
If the state were to require implementation of the CCR recommendations and provide General Fund dollars to reimburse counties for new costs, it is likely that counties would realize some savings as foster children are transitioned from more costly group home placements to less costly family–based placements. It seems reasonable that such savings could be used to offset state costs for CCR implementation, reducing the state’s ongoing contribution to CCR implementation or even making it temporary. However, the specifics of how the long–term implementation of the CCR recommendations would be financed is unclear, both because little detail has been provided on how rates would be restructured and how broader CCR implementation would be sequenced, and because the provisions of 2011 realignment have not been tested in this way before.
Appropriate to Focus First on Building Capacity in Home–Based Settings. . . We think the focus of the CCR budget proposal on beginning CCR implementation with increasing capacity in family–based settings makes sense. Given concerns about insufficient numbers of county foster homes, it will be important to ensure that, when new restrictions are placed on length of stay in group home placements, there are enough family–based placements available to care for children transitioning from group home placements and that these family–based placements have access to services and supports necessary to meet these children’s needs.
. . .But Unclear How Proposed Funding Will Achieve CCR Objectives in the Context of Broader Reform Implementation. The administration has so far provided little detail on how the funding proposed as part of the budget fits into the broader CCR implementation and how the funding would help achieve CCR objectives. Specifically, the administration does not have a specific proposal for how the $3.8 million for foster parent outreach, recruitment, and support would be used and what outcomes would be expected once these funds were spent. It is also unclear how this funding would be distributed and whether all counties would have access to these funds. If the proposed funding amount was distributed equally among all 58 counties, each would receive roughly $66,000 (for a half year). As this funding is not tied to specific outcomes related to broader CCR implementation, it is difficult to assess whether the amount proposed is appropriate to meet CCR objectives.
Similarly, no clear rationale has been given for why the appropriate level of FFA social worker rate increase is 15 percent. The proposed increase is not tied to any new FFA responsibilities or core services as envisioned in the CCR recommendations. Instead, the increase appears to be intended to allow FFAs to better meet existing expectations under current law. Given past reductions in the FFA rate, increasing FFA rates to a level that is adequate to meet current expectations until higher expectations are put in place as part of broader CCR implementation may have merit. However, we believe that such an increase, if it were provided, should be considered in the context of a broader CCR implementation plan that would outline what additional rate increases, if any, would be provided in the future to compensate for higher levels of service.
Recommend DSS Justify Budget Proposal in Context of Broader Implementation Plan at Budget Hearings. Given the lack of detail on how the proposed funding will fit into broader CCR implementation and how it will help meet CCR objectives, it is difficult to evaluate the merits of the budget proposal. We recommend that the Legislature require DSS to justify the budget proposal in the context of broader CCR implementation at budget hearings. Ultimately, any funding approved as part of the 2015–16 budget should be consistent with timelines and priorities developed through deliberations on the forthcoming legislative package. The following are key questions and issues for the Legislature’s consideration through this process:
- How Will the Implementation of the CCR Recommendations Address Challenges Associated With Realignment? Key questions related to realignment include: Would the state provide funding to make implementation of CCR recommendations mandatory? To what extent would any county savings from reduced group home placements be used to offset state costs of implementing the CCR recommendations? How would these savings be determined?
- How Will Funding Proposed for County Foster Parent Recruitment and Support Be Allocated and Used? Key questions relating to proposed funding for county foster parent recruitment and support include: Would the proposed funding be available to all counties? What specific county activities will the proposed funding pay for? What outcomes are expected from these activities? How will these outcomes be evaluated?
- What Is the Rationale for the Proposed Level of FFA Social Worker Rate Increase? Key questions relating to the proposed FFA social worker rate increase include: What level of rate increase would be required to allow FFAs to adequately meet current law expectations? What are the new expectations and core services that FFAs would be required to perform under the CCR recommendations? What additional amount of rate increase would be required to allow FFAs to meet new expectations under the CCR recommendations?