In this report, we analyze the Governor’s Proposition 98 budget package for schools and community colleges. In the first section, we provide background on public schools in California. (We provide background information on community colleges in our forthcoming Higher Education Budget Analysis.) In the second section, we provide background on Proposition 98 and the calculation of the minimum funding guarantee for schools and community colleges. We next describe and assess the Governor’s estimates of the minimum guarantee and his corresponding Proposition 98 spending package. In the remaining sections of the report, we describe and assess the Governor’s specific Proposition 98 proposals.
K–12 Education in Context
This section provides a profile of the state’s K–12 public education system. We present information on California’s students, school districts, funding, teachers, various program aspects, and student performance. (While 9 percent of California’s school–age children attend private schools, most of the available summary data—and therefore most of what we discuss in this section—are limited to the students who attend the state’s public schools.) When such data are available, we provide perspective on how California’s K–12 system compares to those of other states. Throughout this section, we cite the most recent data available from government sources. In some cases—particularly for national comparison data, which typically takes years to compile—this information may be several years old.
California Has More K–12 Students Than Any Other State. In 2013–14, California’s public schools enrolled 6.2 million students, representing 13 percent of all public school students in the nation. About two–thirds of these students were in grades kindergarten through eight, with one–third attending high school. These enrollment levels include nearly 1 million (11 percent) more students compared to 20 years ago. Statewide enrollment grew rapidly between 1993–94 and 2003–04, averaging 2 percent growth each year. Over the past decade, however, student enrollment has been relatively steady, with enrollment in 2013–14 about 1 percent below the 2004–05 level.
Almost Six in Ten California Students Are From Low–Income Families. In 2011–12, 59 percent of California’s public school students were eligible to receive a free or reduced price school meal. States frequently use this measure as an indicator of student poverty. Qualifying students come from families earning no more than 185 percent of the federal poverty level—$44,000 annually for a family of four. California’s rate of free or reduced price meal eligibility is slightly above the nationwide rate.
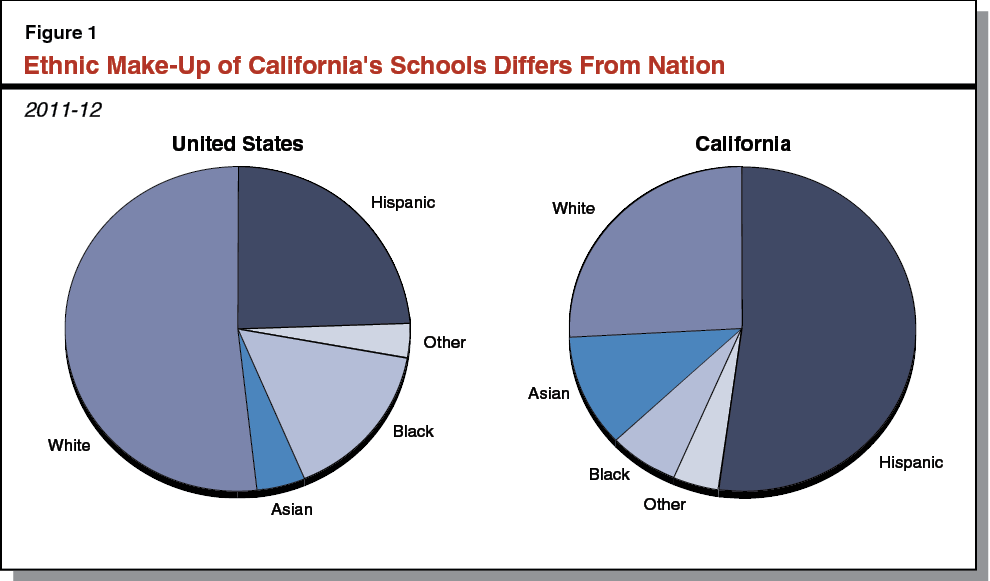
Half of California Students Are Hispanic. As shown in Figure 1, the ethnic make–up of California’s students is notably distinct from the nationwide picture. While slightly more than half (52 percent) of American students are white and about one–quarter are of Hispanic origin, in California those percentages are flipped. Asian students make up a slightly larger percentage of students in California (11 percent compared to 5 percent nationwide), while California schools serve proportionally fewer black students (7 percent compared to 16 percent nationwide).
Nearly One–Quarter of California Students Are English Learners (ELs). In 2013–14, 23 percent (1.4 million) of California students were classified as ELs—a higher proportion than in any other state. One out of every three EL students in the nation attends school in California. Even more California students, however—almost 2.7 million students overall—speak a primary language other than English at home. Whereas about half of these students are classified as ELs, the remainder are considered Fluent English Proficient. California students come from families speaking over 60 different languages, although the vast majority (79 percent) speak Spanish, with Vietnamese as the next most common language (3 percent).
One in Ten California Students Identified With a Disability Affecting Their Education. In 2013–14, about 635,000, or roughly 10 percent of K–12 students in the state, were diagnosed with a disability that affects their educational attainment. Pursuant to federal law, schools must provide these students with special education services. California identifies a smaller proportion of students for special education compared to most other states. (The national identification rate is about 11 percent of K–12 public school enrollment.) Specific learning disabilities—including dyslexia—are the most common diagnoses requiring special education services (affecting about 4 percent of the state’s K–12 students), followed by speech and language impairments. While the overall prevalence of students with autism and chronic health problems still is relatively rare (each affecting about 1 percent of all California public school students), the number of students diagnosed with these disabilities has increased notably over the last decade.
Size of California School Districts Varies Dramatically. As shown in Figure 2, California’s nearly 1,000 school districts vary greatly in size. Almost three–quarters of all California school districts serve fewer than 5,000 students. Combined, these 678 districts serve just 16 percent of all students in the state. Moreover, about one–quarter of the state’s districts contain only a single school. At the other extreme, 12 very large districts with over 40,000 students educate about one–fifth of all students in the state, with one district—Los Angeles Unified—representing about 10 percent of all students. Seven of the state’s counties contain only a single school district, while Los Angeles County contains 80 discrete districts.
Figure 2
California School Districts Vary Greatly in Size
2013–14
|
District Sizea
|
Number of Districts
|
Percent of All Districts
|
Total
Studentsa
|
Percent of All Studentsa
|
|
6 to 300
|
237
|
25%
|
29,758
|
1%
|
|
301 to 2,500
|
310
|
33
|
344,027
|
6
|
|
2,501 to 5,000
|
131
|
14
|
471,410
|
9
|
|
5,001 to 10,000
|
120
|
13
|
890,314
|
16
|
|
10,001 to 40,000
|
134
|
14
|
2,598,223
|
47
|
|
40,000+
|
12
|
1
|
1,167,871
|
21
|
|
Totals
|
944
|
100%
|
5,501,603
|
100%
|
Charter Schools Represent Fast–Growing Sector of California’s K–12 School System. An increasing share of California students attend charter schools instead of traditional district–operated schools. Publicly funded charter schools are similar to traditional schools in many ways—they must employ state–certified teachers, and they must teach and assess students based on the same state academic standards. Because they are not subject to certain laws and regulations, however, they have more flexibility over the design of their education program. While overall statewide K–12 enrollment has been relatively flat, the number of students attending charter schools has more than tripled over the past decade, growing at an average rate of 12 percent each year. In 2013–14, charter schools served nearly 500,000 students at more than 1,100 schools, representing about 8 percent of the statewide student population.
About One in Ten California High School Students Attend an Alternative School at Some Point. While the majority of California students attend traditional school district or charter schools, some students require a different educational environment. Students attending alternative schools typically have been chronically truant, are significantly behind in high school credits, or have been expelled or incarcerated. Alternative schools (including community day schools, county community schools, continuation high schools, and juvenile court schools) are operated by both school districts and county offices of education (COEs). (The district–run alternative schools generally serve the students with less severe challenges, such as students with minor behavioral or academic issues.) Alternative schools typically are used as short–term placements, with students often attending for less than a year.
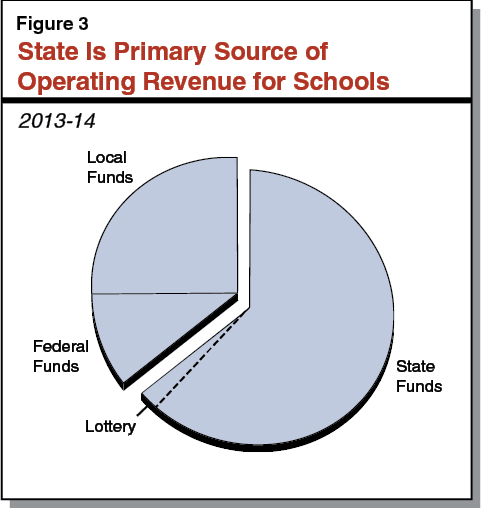
State Is Primary Source of Operating Revenue for Schools. In 2013–14, school districts received $73 billion in total funding from all sources. As shown in Figure 3, the largest share of school funding comes from the state, with smaller shares coming from local sources (primarily from local property tax revenue) and the federal government. These proportions differ from many other states, where local property tax revenues cover a much larger share of school funding. (Unlike many other states, California’s State Constitution limits local property tax rates.) Additionally, in contrast to many other states, most school districts’ overall funding levels are not affected by how much local property tax revenue they receive. This is because California generally uses local property tax revenue as an offset for state General Fund spending. (That is, if a district receives more local property tax revenue in a given year, the state reduces the district’s General Fund support by a like amount.)
State Per–Pupil Funding in 2014–15 Slightly Below Pre–Recession Level. The 2014–15 Budget Act provided schools with $8,931 per student. This is roughly $300 below the 2007–08 pre–recession level adjusted for inflation. (Under the Governor’s budget, the 2015–16 per–pupil funding level is about $200 above the inflation–adjusted 2007–08 level.)
Most Funding Is Allocated Through the Local Control Funding Formula (LCFF). In 2013–14, the state allocated 87 percent of K–12 education funding (state General Fund and local property tax revenue) through LCFF. School districts and charter schools may use LCFF funds for any educational purpose, though they must use a portion of these funds for increasing or improving services for EL and low–income students. (We discuss LCFF in more detail later in this report.) In addition to LCFF funds, the state provides funding for various categorical programs, the largest being special education. (Categorical programs restrict funding for specified purposes.)
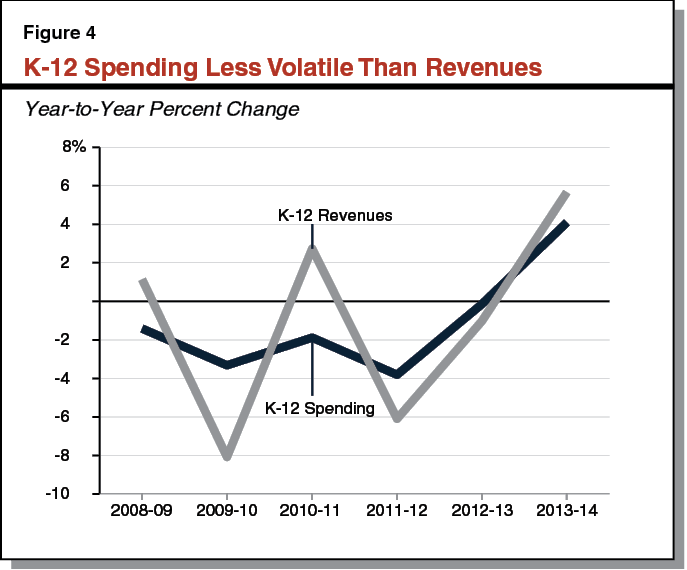
Over Past Seven Years, Revenues More Volatile Than Spending. As shown in Figure 4, changes in school district revenues have been more volatile than their expenditures. In 2009–10, when school district revenues decreased by 8 percent, their spending decreased by only 3 percent. In 2013–14, district revenues increased almost 6 percent, but their spending increased by only 4 percent. These data suggest school districts adjust spending somewhat gradually in response to decreases and increases in revenues. Rather than make drastic cuts in 2009–10, districts were more likely to make modest reductions and use their reserves to fund their programs. Districts continued to make more modest reductions until revenues increased considerably in 2013–14.
California Per–Pupil Spending Ranks Below Two–Thirds of States. Based on data from 2011–12, California ranked 36th in per–pupil spending among the 50 states and District of Columbia. In 2007–08, prior to the most recent recession, California ranked 23rd in per–pupil spending. The decrease in ranking is primarily due to the reductions the state made during the recession. (Because of the state’s progressive income tax rate structure, California’s revenues are highly sensitive to changes in the economy and financial markets. California’s budget was therefore more severely affected by the recession compared to most other states.) Given California has made significant increases in K–12 funding over the past three years, its ranking likely will increase as newer data become available.
If Adjusted for Cost of Employment, California Drops in the Rankings. Some organizations produce rankings of state per–pupil spending with adjustments for regional costs. In these rankings, California typically ranks much lower. In one recent ranking, for example, California ranked 45th in per–pupil spending. The adjustments in these rankings are primarily intended to control for the variation in wages across the country, with average wages higher in California.
California Teachers Have Roughly the Same Levels of Education and Experience as Teachers in Other States. As shown in Figure 5, the education and experience levels of California’s teacher workforce are somewhat reflective of national trends. In both California and across the nation, about 60 percent of teachers have been teaching for at least ten years, and a relatively small proportion (9 percent) are new teachers with fewer than three years of experience. About 4 in 10 teachers possess a bachelor’s degree, and more than half possess either a master’s degree or advanced graduate work.
Figure 5
California Has Smaller but Better Paid Teacher Workforce Than Nation
2011–12a
|
|
California
|
United States
|
|
Overall
|
|
|
|
Total Number
|
268,689
|
3,103,263
|
|
Student/Teacher Ratio
|
23.4
|
16.0
|
|
Experience
|
|
|
|
Less than 3 years
|
9%
|
9%
|
|
3 to 9 years
|
29
|
33
|
|
10 to 20 years
|
42
|
36
|
|
More than 20 years
|
19
|
21
|
|
Education
|
|
|
|
Less than Bachelor’s
|
5%
|
4%
|
|
Bachelor’s Degree
|
43
|
40
|
|
Master’s Degree
|
39
|
48
|
|
Education Specialist or Doctorate
|
13
|
9
|
|
Salary
|
|
|
|
Average Teacher Salaryb
|
$62,010
|
$46,340
|
|
Median Salary, All Bachelor’s Degree Holdersc
|
53,033
|
49,157
|
|
Salary by Years of Experienceb
|
|
|
|
2 or fewer years
|
$47,310
|
$38,330
|
|
6 to 10 years years
|
58,570
|
44,040
|
|
More than 20 years
|
73,980
|
56,620
|
California’s Teacher Salaries Higher Than Most Other States. Figure 5 also shows that California’s teachers earn more than their peers across the nation at all levels of experience. In 2011–12, California’s average salary for a teacher holding a bachelor’s degree ranked highest in the nation. As shown, the difference in average salary between California and the rest of the nation is greater for teachers (almost $16,000) than for all bachelor’s degree holders (almost $4,000). This suggests that the higher teacher salaries are based on additional factors besides a higher cost of living in California.
California Has Relatively Fewer Teachers, Relatively Larger Class Sizes. While California’s teachers are better paid than the rest of the nation, the state employs comparatively fewer of them. As shown in Figure 5, on average California teachers are responsible for 23.4 students, compared to the national average ratio of 16 students for each teacher. Moreover, in 2011–12 California ranked tenth in the nation for largest average elementary class sizes (21.5 students, compared to the national average of 20) and had the largest average secondary class sizes in the country (30 students, compared to the national average of 23.4).
Like Most States, California’s Instruction Now Based on Common Core State Standards. In 2010, California adopted the Common Core State Standards (with the addition of a few California–specific standards) as the new foundation for what students should know and be able to do in English–language arts and mathematics from kindergarten through twelfth grade. California has had academic content standards for over 15 years, but the new standards are designed to be better at preparing students for college and career. California schools are in the process of implementing the new standards by modifying curriculum, conducting professional development for staff, and purchasing new instructional materials. Forty three other states also have adopted and are implementing the Common Core State Standards. (In addition to the new standards for English–language arts and mathematics, California recently adopted the nationally developed Next Generation Science Standards. The state also maintains state–specific content standards in other academic areas, including history–social science, world languages, career technical education, and visual and performing arts.)
Students With Disabilities Frequently Receive Special Education Services in Separate Settings. Pursuant to federal law, California schools develop individualized education plans for students with identified disabilities affecting their education. In addition to extra academic supports in a classroom setting, these plans sometimes include other special education services such as language, occupational, and behavioral therapies. Compared to many other states, California more frequently educates students with disabilities in separate classrooms or settings. In 2011, only about half of the state’s students with disabilities spent the vast majority of their instructional time in regular classrooms, compared to the national average of about 60 percent.
Schools Provide Additional Academic Services Based on Student Needs. Besides special education, California schools also provide different types of academic services for students with specific needs. For example, EL students typically receive instruction to help them learn English. In 2011–12, 70 percent of the state’s EL students received English Language Development services and/or Specially Designed Academic Instruction in English. An additional 23 percent received support to learn English along with instruction or support in their primary language. California schools also provide a number of supplemental academic services to students who are struggling academically, including tutoring and academic counseling as well as after school and summer school programs.
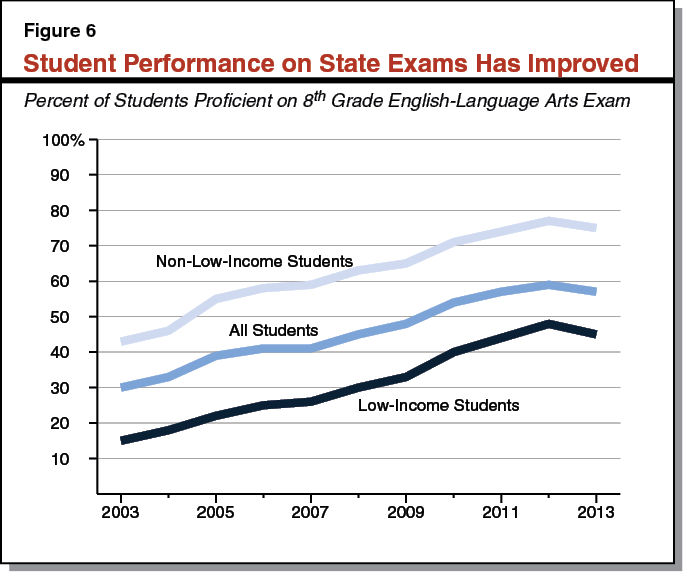
Student Performance on State Exams Has Improved. Student performance on the California Standards Tests (CSTs) has improved significantly over the past 10 years. As Figure 6 shows, the percentage of students scoring advanced or proficient on the eighth grade English–language arts exam has almost doubled—from 30 percent to 57 percent—in the past 10 years. Performance has improved at similar rates for both low–income and non–low–income students. Student performance also has improved at similar rates on mathematics exams and in English–language arts at other grade levels. The CSTs were based on the academic content standards adopted by California in 1997. Beginning in spring 2015, assessments in mathematics and English–language arts will be based on the Common Core State Standards. These assessments were developed by the Smarter Balanced Assessment Consortium, which includes 21 states. (As part of the transition to the new exams, California suspended the CSTs in spring 2014. Thus, no performance data is available for 2014.)
California Ranks Near Bottom on National Tests. Figure 7 shows California’s ranking on the National Assessment of Educational Progress, a federal assessment conducted nationwide. As the figure shows, California performs near the bottom in tests of reading and mathematics for fourth and eighth grades. Although the performance of non–low–income students tends to rank somewhat higher than that of low–income students, both groups perform lower than their peers in other states. California’s performance compared to other states has not changed significantly in the past 10 years. In addition to having lower performance compared to other states, California also has among the largest “achievement gaps”—the difference between the scores of low–income and non–low–income students. In fourth grade reading, for example, California’s achievement gap is ranked 45th in the country. (That is, 44 states have achievement gaps that are smaller than California.)
Figure 7
California Ranks Near Bottom on National Testsa
California’s Ranking Among 50 States and District of Columbia
|
|
All
Students
|
Low–Income Students
|
Non–Low–Income Students
|
Achievement
Gapb
|
|
4th Grade
|
|
|
|
|
|
Reading
|
46
|
48
|
38
|
45
|
|
Mathematics
|
46
|
49
|
42
|
43
|
|
8th Grade
|
|
|
|
|
|
Reading
|
41
|
42
|
29
|
45
|
|
Mathematics
|
44
|
47
|
38
|
43
|
Eight in Ten Students Graduate High School Within Four Years. Of the cohort of students that entered ninth grade in the 2009–10 school year, 80.4 percent graduated within four years, 11.4 percent dropped out of school, and 7.4 percent returned to school for a fifth year. Less than 1 percent of students completed their high school education after four years having received either a High School Equivalency Certificate (if they passed the General Educational Development Test) or a special education certificate of completion.
Increasing Share of Graduates Meet University Eligibility Requirements. In 2013, 39 percent of California students graduated high school having completed the coursework required to be eligible for admission to the University of California and California State University. This proportion has been gradually increasing over the last 20 years. In 1993, only 33 percent of California high school graduates met eligibility requirements for the state’s public universities.
California Students’ College Attendance Rates About the Same as National Average. Federal data from 2010 show that 62 percent of California high school graduates attend college (including community colleges and other institutions that offer an associate’s degree). This compares to 63 percent nationwide. College–going rates have declined somewhat since 2008, both nationally (1 percent) and, to an even greater degree, in California (nearly 4 percent).
Proposition 98 Sets Minimum Funding Level for Schools and Community Colleges. State budgeting for schools and community colleges is governed largely by Proposition 98, passed by voters in 1988. The measure, modified by Proposition 111 in 1990, establishes a minimum funding requirement for schools and community colleges, commonly referred to as the minimum guarantee. Both state General Fund and local property tax revenue apply toward meeting the minimum guarantee.
Various Inputs Determine Applicable “Test.” As described in Figure 8, the minimum guarantee is determined by one of three tests set forth in the State Constitution. These tests are based on several inputs, including changes in K–12 attendance, local property tax revenue, per capita personal income, and per capita General Fund revenue. The applicable test that sets the minimum guarantee is triggered automatically depending on these inputs. For 21 of the past 27 years, Test 2 or Test 3 has been the applicable test. In these years, the minimum guarantee builds upon the level of funding provided the prior year. Since the inputs are not finalized until several years after the close of the fiscal year, the applicable test can fluctuate and the minimum guarantee can change significantly from the level initially assumed in the budget.
Figure 8
Minimum Guarantee Determined by One of Three Tests
|
|
|
Test 1—Share of General Fund. Provides roughly 40 percent of state General Fund revenue to K–14 education. The guarantee has been determined using this test 4 of the last 27 years.
|
|
Test 2—Growth in Per Capita Personal Income. Adjusts prior–year Proposition 98 funding for changes in K–12 attendance and per capita personal income. The guarantee has been determined using this test 13 of the last 27 years.
|
|
Test 3—Growth in General Fund Revenues. Adjusts prior–year Proposition 98 funding for changes in K–12 attendance and per capita General Fund revenue. Generally, this test is operative when General Fund revenue grows more slowly than per capita personal income. The guarantee has been determined using this test 8 of the last 27 years.
|
State Can Provide More or Less Than Minimum Guarantee. Although the applicable Proposition 98 test is determined by the various inputs, the state need not always provide funding at the level required by the minimum guarantee. During the economic boom that prevailed in the late 1990’s, for example, the state for several years provided more funding than was required by the minimum guarantee. Alternatively, in 2004–05 and 2010–11, the state applied a provision of Proposition 98 allowing for the suspension of the minimum guarantee upon a two–thirds vote of each house of the Legislature. When the state suspends the minimum guarantee, it can provide a lower level of funding but creates an out–year obligation to restore K–14 funding in later years (described below).
State Creates “Maintenance Factor” Obligation in Certain Years. Proposition 111 allows the state to provide less funding than the Test 2 level if Test 3 is operative or the minimum guarantee is suspended. In these years, the state creates a maintenance factor obligation, which is equal to the difference between the higher Test 2 level and the amount of funding actually provided. Moving forward, the maintenance factor obligation is adjusted annually for changes in K–12 attendance and per capita personal income. The state has carried an outstanding maintenance factor in 20 of the past 25 years, including an estimated $2.6 billion at the end of 2014–15.
Maintenance Factor Payments Based on Growth in General Fund Revenue. When an outstanding maintenance factor obligation exists, the Constitution requires the state to make additional payments until the obligation has been paid off. These additional payments are made when state revenue is growing more quickly than per capita personal income, with the exact amount determined by formula. When state revenue grows very quickly, larger payments are made and the obligation is paid off in a shorter time. The additional funding provided by the maintenance factor payments increases the minimum guarantee on an ongoing basis. Until all maintenance factor is paid off, however, the state generates savings each year compared with the higher level of funding otherwise required.
Recent Application of Maintenance Factor Payments Has Made Minimum Guarantee Extremely Sensitive in Certain Years to Changes in General Fund Revenue. Though the principle underlying maintenance factor is straightforward—the state must increase Proposition 98 funding more quickly in good years to make up for reductions in leaner years—there has been contention over how the state is to make maintenance factor payments in Test 1 years with strong revenue growth. In 2012–13, the state chose to make maintenance factor payments “on top” of the Test 1 level. That is, the minimum guarantee was calculated as the sum of the Test 1 level and the maintenance factor payment required by formula. Such an approach causes the minimum guarantee to be very sensitive to changes in General Fund revenue, with the guarantee changing virtually dollar for dollar with General Fund revenue. As a rule of thumb, the Test 1 amount increases by 40 cents for every additional dollar in General Fund revenue, while the maintenance factor payment increases by roughly 50 cents. As a result, nearly every new dollar of revenue must go towards meeting the higher minimum guarantee.
Application Has Ratcheted Up Minimum Guarantee Billions of Dollars. The state’s approach directly affected the minimum guarantee in 2011–12, 2012–13, and 2014–15. Under an alternative maintenance factor approach that we describe in our report, The 2012–13 Budget: Proposition 98 Maintenance Factor: An Analysis of the Governor’s Treatment, the minimum guarantee remains sensitive to changes in General Fund revenue but not as sensitive as the state’s recent application. As a result of its approach the past few years, we estimate the 2014–15 minimum guarantee is over $2 billion higher than it would have been under the alternative approach.
“Spike Protection” Limits Ongoing Effect of Large Revenue Increases. Another provision of Proposition 98 prevents the minimum guarantee from growing too quickly during years when growth in state General Fund revenue is particularly strong. In Test 1 years when the minimum guarantee increases at a much faster rate than per capita personal income, spike protection excludes a portion of Proposition 98 funding from the calculation of the minimum guarantee in the subsequent year. Specifically, once the Test 1 level exceeds the Test 2 level by more than 1.5 percent of state General Fund revenue, some of the excess funding is excluded from the calculation of the minimum guarantee the following year.
Legislature Determines How to Allocate Proposition 98 Funding. Upon determining the amount of total Proposition 98 funding to provide, the Legislature decides how to spend the associated funds. Historically, the Legislature has provided about 89 percent of funding to schools and 11 percent to community colleges. Within these two allocations, funds are further divided into one of two basic purposes—general (or unrestricted) purposes and categorical (or restricted) purposes. The state allocates general purpose funding to schools through LCFF and to community colleges through apportionments.
As part of its budget package, the administration has updated its estimates of the minimum guarantee for 2013–14, 2014–15, and 2015–16. The first part of this section describes the key factors driving these changes and the associated General Fund costs. The second section analyzes how further changes in state revenue could affect the minimum guarantee.
Minimum Guarantee Up $371 Million. As shown in Figure 9, the administration’s revised estimate of the 2013–14 minimum guarantee is $58.7 billion, a $371 million increase from the June 2014 estimate. The largest contributing factor is a $361 million increase in General Fund revenue, which increases the minimum guarantee by about $200 million. The administration also has revised its estimate of K–12 attendance upward 0.17 percent, increasing the minimum guarantee by an additional $100 million. The remaining increase is explained by various minor changes in other inputs affecting Proposition 98, including revised estimates of state population and small changes to the minimum guarantee in earlier years. Though Test 3 remains the applicable test, the increase in the minimum guarantee reduces the amount of new maintenance factor created. Whereas the state had estimated in June 2014 that $458 million in maintenance factor would be created, the Governor now estimates only $241 million is created.
Figure 9
Increase in 2013–14 and 2014–15 Minimum Guarantees
(In Millions)
|
|
2013–14
|
|
2014–15
|
|
June 2014 Estimate
|
January 2015 Estimate
|
Change
|
June 2014 Estimate
|
January 2015
Estimate
|
Change
|
|
Minimum Guarantee
|
|
|
|
|
|
|
|
|
General Fund
|
$42,731
|
$42,824
|
$94
|
|
$44,462
|
$46,648
|
$2,186
|
|
Local property tax
|
15,572
|
15,849
|
277
|
|
16,397
|
16,505
|
108
|
|
Totals
|
$58,302
|
$58,673
|
$371
|
|
$60,859
|
$63,153
|
$2,294
|
Higher Local Property Tax Estimates Mitigate Increase in General Fund Costs. Though the minimum guarantee is up $371 million in 2013–14, Proposition 98 General Fund costs increase only $94 million, with local property tax revenue increasing $277 million. (Because Test 3 is the applicable test in 2013–14, increases in local property tax revenue offset General Fund costs.) Figure 10 shows how the various components of local property tax revenue have changed in 2013–14 and 2014–15. Of the increase in local property tax revenue in 2013–14, $155 million is related to the dissolution of redevelopment agencies (RDAs). (The legislation that dissolved RDAs provided for a gradual shift of local revenue back to schools and local governments that will increase over time as RDA–related debt is repaid. It also provided for the sale of assets owned by the former RDAs, with proceeds distributed to schools and local governments. Of the $155 million increase, $111 million relates to the ongoing shift and $44 million relates to the sale of assets.) In addition, the Governor revises his estimate of “excess tax revenue” downward by $115 million, which in turn increases the amount of local revenue that offsets Proposition 98 General Fund costs. (Excess tax revenue reflects local revenue that some school districts, COEs, and community colleges receive beyond their general purpose funding levels set by the state. This excess revenue is excluded from the calculation of Proposition 98.) These two increases in local revenue are offset by a minor adjustment to base property tax revenue.
Figure 10
Increases in 2013–14 and 2014–15 Proposition 98 Property Tax Revenue Estimates
Based on Governor’s Budget (In Millions)
|
|
2013–14
|
|
2014–15
|
|
June
2014
Estimate
|
January
2015
Estimate
|
Change
|
June
2014
Estimate
|
January
2015
Estimate
|
Change
|
|
Local Property Tax Components
|
|
|
|
|
|
|
|
|
Base property tax revenue
|
$15,437
|
$15,443
|
$6
|
|
$16,401
|
$16,443
|
$42
|
|
Ongoing RDA revenue shift
|
800
|
911
|
111
|
|
743
|
824
|
81
|
|
Sale of RDA assets
|
274
|
318
|
44
|
|
42
|
67
|
25
|
|
Excess tax revenuea
|
–939
|
–824
|
115
|
|
–789
|
–829
|
–40
|
|
Totals
|
$15,572
|
$15,849
|
$277
|
|
$16,397
|
$16,505
|
$108
|
Minimum Guarantee Up $2.3 Billion. As shown in Figure 9, the administration’s revised estimate of the 2014–15 minimum guarantee is $63.2 billion, a $2.3 billion increase from the June 2014 estimate. About $2.2 billion of this increase is attributable to General Fund revenue being $2.5 billion higher than previously assumed. Test 1 remains the applicable test in 2014–15. As described earlier, General Fund revenue increases yield a near dollar–for–dollar effect on the minimum guarantee in 2014–15 because of the state’s approach to paying maintenance factor in Test 1 years. The remainder of the increase is a result of local property tax revenue being higher than June 2014 estimates. Given 2014–15 is a Test 1 year, increases in most components of property tax revenue result in an increase in the minimum guarantee and greater total funding for schools and community colleges. (The exception is the sale of RDA assets, as the state’s practice has been to rebench the minimum guarantee to account for changes in these proceeds.) The Governor also updates his estimate of the amount of maintenance factor paid, from $2.6 billion in June 2014 to $3.8 billion. Under the Governor’s budget, the state would end 2014–15 with $2.6 billion in outstanding maintenance factor.
General Fund Covers Bulk of Increase in Minimum Guarantee. Of the $2.3 billion increase in the minimum guarantee, $2.2 billion is covered by state General Fund and $108 million by local property tax revenue. As shown in Figure 10, the largest local property tax adjustment is $81 million for higher–than–expected ongoing revenue shifted from former RDAs. Also, the sale of former RDA assets and the corresponding shift of one–time proceeds to schools and community colleges are $25 million higher than expected last June. Small adjustments to base local property tax revenue and excess tax estimates account for the remainder of the revision.
Minimum Guarantee Up $4.9 Billion Over 2014–15 Budget Act Level. As Figure 11 shows, the administration estimates the minimum guarantee will be $65.7 billion in 2015–16. This is $2.6 billion (4 percent) above the revised 2014–15 guarantee and $4.9 billion (8 percent) above the 2014–15 Budget Act level. Because Test 2 is the applicable test in 2015–16, the guarantee is affected primarily by the higher minimum guarantee in 2014–15 and growth in per capita personal income (2.9 percent). (Though changes in K–12 attendance also affect the calculation, the Governor projects attendance to be virtually flat from 2014–15 to 2015–16.) Since the Governor projects state revenue will grow more quickly than per capita personal income, the budget also includes a $725 million maintenance factor payment in 2015–16. This payment would leave the state with $1.9 billion in outstanding maintenance factor at the end of 2015–16.
Figure 11
Proposition 98 Funding
Dollars in Millions)
|
|
2013–14
Revised
|
2014–15
Revised
|
2015–16 Proposed
|
Change From 2014–15
|
|
Amount
|
Percent
|
|
Preschool
|
$507
|
$664
|
$657
|
–$8
|
–1%
|
|
K–12 Education
|
|
|
|
|
|
|
General Fund
|
$38,005
|
$41,322
|
$41,280
|
–$43
|
—
|
|
Local property tax revenue
|
13,671
|
14,184
|
16,068
|
1,885
|
13
|
|
Subtotals
|
($51,675)
|
($55,506)
|
($57,348)
|
($1,842)
|
(3%)
|
|
California Community Colleges
|
|
|
|
|
|
|
General Fund
|
$4,235
|
$4,581
|
$5,002
|
$421
|
9%
|
|
Local property tax revenue
|
2,178
|
2,321
|
2,628
|
307
|
13
|
|
Subtotals
|
($6,413)
|
($6,902)
|
($7,630)
|
($728)
|
(11%)
|
|
Other Agencies
|
$78
|
$80
|
$80
|
—
|
—
|
|
Totals
|
$58,673
|
$63,153
|
$65,716
|
$2,563
|
4%
|
|
General Fund
|
$42,824
|
$46,648
|
$47,019
|
$371
|
1%
|
|
Local property tax revenue
|
15,849
|
16,505
|
18,697
|
2,192
|
13
|
Increases in Minimum Guarantee Largely Covered by Higher Local Property Tax Revenue. Though the minimum guarantee grows by $2.6 billion from revised 2014–15 estimates to 2015–16, state General Fund spending grows by only $371 million (1 percent), as local property tax revenue increases by $2.2 billion (13 percent) over the revised 2014–15 estimates. As shown in Figure 12, this large increase in local revenue mainly results from the following three factors.
Figure 12
Proposition 98 Property Tax Revenue Estimates
Based on Governor’s Budget (Dollars in Millions)
|
|
2013–14
Revised
|
2014–15
Revised
|
2015–16
Estimated
|
Change From 2014–15
|
|
Amount
|
Percent
|
|
Local Property Tax Components
|
|
|
|
|
|
|
Base property tax revenue
|
$15,443
|
$16,443
|
$17,257
|
$813
|
5.0%
|
|
End of “triple flip”
|
—
|
—
|
1,228
|
1,228
|
—
|
|
Ongoing RDA revenue shift
|
911
|
824
|
977
|
153
|
18.6
|
|
Sale of RDA assets
|
318
|
67
|
72
|
5
|
7.5
|
|
Excess tax revenuea
|
–824
|
–829
|
–837
|
–8
|
–1.0
|
|
Totals
|
$15,849
|
$16,505
|
$18,697
|
$2,192
|
13.3%
|
- Phase–Out of “Triple Flip” ($1.2 Billion). The largest factor driving the increase is the end of the triple flip. Under this complex financing mechanism, the state (1) redirected local sales tax revenue to pay off the state’s Economic Recovery Bonds (approved by voters in 2004 to help close the state budget deficit), (2) backfilled cities and counties with property tax revenue shifted from schools and community colleges, and (3) backfilled schools and community colleges with state General Fund revenue. The Governor’s budget assumes the state retires the Economic Recovery Bonds after the first three months of the fiscal year, resulting in $1.2 billion flowing back to K–14 education in 2015–16. (The state will receive the full benefit of the phase–out—about $1.6 billion—in 2016–17.)
- Growth in Underlying Property Tax Revenue ($813 Million). The Governor’s budget assumes that base local property tax revenue (which consists primarily of the 1 percent tax levied on the value of residential and commercial property) grows by 5.0 percent in 2015–16. This increase reflects a lower growth rate than 2014–15 but remains about the same as the historic growth level.
- Increase in RDA–Related Revenue ($158 Million). The Governor’s budget assumes that total revenue related to the dissolution of RDAs increases by $158 million, including $153 million related to the ongoing RDA revenue shift and $5 million related to the sale of RDA assets. Total K–14 revenue attributable to the dissolution of RDAs is projected to reach about $1 billion in 2015–16.
If Revenue in 2014–15 Increases, Most Will Go to Proposition 98. As described earlier, the minimum guarantee in 2014–15 is highly sensitive to changes in state General Fund revenue, with a near dollar–for–dollar effect on Proposition 98 funding. Recent economic and state tax data suggest that, barring a sustained stock market drop before June, 2014–15 General Fund revenue could exceed the administration’s estimates by $1 billion to $2 billion. Given that such a large share of additional General Fund revenue in 2014–15 would be required to go to Proposition 98, the Legislature could begin considering how it might allocate such a large, year–end funding increase to schools and community colleges. (This strong relationship between revenue and the minimum guarantee holds in 2014–15 until the state pays down all remaining maintenance factor. We estimate revenues would need to increase $4.4 billion above the Governor’s estimates for the state to retire all outstanding maintenance factor. Above that threshold, the minimum guarantee would increase only 40 cents for every $1 increase in state General Fund revenue.)
If 2014–15 Minimum Guarantee Increases, 2015–16 Minimum Guarantee Also Increases. Because Test 2 or Test 3 is likely to be operative in 2015–16, the 2015–16 minimum guarantee very likely will build off the prior–year Proposition 98 funding level. That is, any increase in the 2014–15 minimum guarantee likely will increase the 2015–16 guarantee. The state’s obligation to fund Proposition 98 at this higher level would remain even if the increase in 2014–15 were the result of a temporary stock market surge or other one–time revenue. For example, if the state were to experience a $2 billion revenue spike in 2014–15, with none of the revenue increase sustained in 2015–16, the minimum guarantee would increase by about $1.9 billion in 2014–15 and $1.3 billion in 2015–16. Over the two–year period, the state would need to provide an additional $3.2 billion in funding with only $2 billion in additional revenue, thereby straining the rest of the state budget. Even if the additional revenue were sustained in 2015–16, the state still would be required to dedicate virtually all new funding to Proposition 98. For example, if revenue were to increase by $2 billion in 2014–15 and $2 billion in 2015–16, the minimum guarantee would increase by about $1.9 billion in 2014–15 and $2 billion in 2015–16. Over the two–year period, the state would need to provide $3.9 billion of the $4 billion to Proposition 98. (In addition, to the extent these revenue increases were associated with capital gains, they could increase the state reserve and debt funding requirements established by Proposition 2.) These examples illustrate that additional revenue in 2014–15 would have a very favorable effect on schools and community colleges but not on other parts of the budget.
If 2014–15 Minimum Guarantee Rises More Than $2.3 Billion, Spike Protection Reduces Effect on 2015–16 Minimum Guarantee. The year–to–year dynamics between 2014–15 and 2015–16 change once a certain 2014–15 guarantee threshold is met. Specifically, if the 2014–15 minimum guarantee rises by more than $2.3 billion above the Governor’s budget level, the spike protection provisions of Proposition 98 become operative. As a result, a large portion of the funding exceeding the $2.3 billion threshold is not included in the calculation of the 2015–16 minimum guarantee. That is, though the spike protection provision does not cap the amount by which Proposition 98 may increase in 2014–15, it reduces the amount of that increase that would be used to determine the minimum guarantee in 2015–16. This provision effectively limits the adverse effect on the rest of the budget resulting from a revenue spike in 2014–15 and the corresponding ongoing growth in the minimum guarantee.
Statutory Supplement Contributes to Higher Minimum Guarantee in 2015–16 Under Certain Conditions. Though the Governor anticipates Test 2 will be the applicable test in 2015–16, additional one–time revenue in 2014–15 could reduce the year–year growth rate in 2015–16 and make Test 3 operative. Under Test 3, statute requires the state to make a supplemental appropriation to ensure the minimum guarantee grows at least as quickly as the rest of the state budget. (The exact amount is controlled by formula but never exceeds the amount needed to bring the minimum guarantee back to the Test 2 funding level.) For example, if revenue were to spike by $4 billion in 2014–15, with none of the revenue sustained in 2015–16, the state would be required to provide a $1.1 billion supplement in 2015–16. The relatively large size of the supplement is related to an interaction with the end of the triple flip. Specifically, the end of the triple flip frees–up $1.2 billion in General Fund revenue, causing growth in non–Proposition 98 General Fund spending to appear relatively larger than growth in the minimum guarantee. As a result, the size of the supplement is more than twice what it would have been had the triple flip ended in a different year.
Deposits in State School Reserve Remain Unlikely in Near Term. Proposition 2, approved by voters in the November 2014 election, established a new state–level school funding reserve. The state must make deposits into this reserve when certain conditions are met. Among these conditions, Test 1 must be the applicable Proposition 98 test and the state must have paid off all maintenance factor created before 2014–15. The interaction between these two requirements makes deposits unlikely in the near term. For example, if the state does experience a one–time revenue spike in 2014–15, it might pay off its maintenance factor obligation more quickly. Making a large payment, however, would increase the ongoing Proposition 98 funding level and make Test 1 less likely to be operative in the future. Alternatively, if state revenue does not increase above the Governor’s estimates, the state could be at least a few years away from paying off all pre–existing maintenance factor. Since state deposits into the new school account are unlikely in the near term, limits on local district reserves linked to these deposits also likely would not take effect in the near term. (In anticipation of the limits applying in future years, some districts, however, may begin changing their behavior in the near term.)
The Governor’s budget includes a number of new spending proposals. The first part of this section summarizes these proposals and the second part provides our assessment of the Governor’s overall spending package.
Governor’s Budget Package Includes $7.8 Billion in New Proposition 98 Funding. The Governor’s budget includes a total of $7.8 billion in additional funding related to increases in the Proposition 98 minimum guarantee. From an accounting perspective, $371 million is attributable to 2013–14, $2.3 billion is attributable to 2014–15, $4.9 billion is attributable to 2015–16, and $256 million is attributable to earlier years. (The $256 million allocation consists of a settle–up payment related to meeting the Proposition 98 minimum guarantee for 2006–07 and 2009–10.) Schools and community colleges, however, will receive all of this funding in 2015–16. Below, we describe the major spending proposals associated with each fiscal year.
Higher 2013–14 Spending. Corresponding to the increase in the minimum guarantee, the Governor’s package contains $371 million in higher Proposition 98 spending in 2013–14. This amount consists of $301 million for mandate backlog payments ($221 million for schools and $80 million for community colleges) and $70 million to cover net higher costs from various LCFF and CCC apportionment adjustments.
Higher 2014–15 Spending. As shown at the top of Figure 13, the Governor’s package contains $2.3 billion in higher Proposition 98 spending in 2014–15, also corresponding to the estimated increase in the 2014–15 minimum guarantee. As required by trailer legislation enacted last year, the Governor designates $992 million to eliminate all remaining deferrals. The Governor also proposes $975 million to pay down more of the mandate backlog and $48 million in one–time funding to continue the Career Technical Education Pathways Initiative for one additional year. The Governor also makes various technical adjustments, most of which relate to updating estimates of LCFF and CCC apportionment costs.
Figure 13
Proposition 98 Spending Changes
(In Millions)
|
2014–15 Budget Act Spending Level
|
$60,859
|
|
Technical Adjustments
|
$279
|
|
K–12 Education
|
|
|
Pay down deferrals (one time)
|
$897
|
|
Pay down mandate backlog (one time)
|
829
|
|
Subtotal
|
($1,726)
|
|
California Community Colleges
|
|
|
Pay down mandate backlog (one time)
|
$146
|
|
Pay down deferrals (one–time)
|
94
|
|
Provide funding for CTE Pathways Initiative (one time)
|
48
|
|
Subtotal
|
($288)
|
|
Total Changes
|
$2,294
|
|
2014–15 Revised Spending Level
|
$63,153
|
|
Technical Adjustments
|
|
|
Remove prior–year, one–time payments
|
–$3,503
|
|
Adjust energy efficiency funds
|
15
|
|
Annualize funding for 4,000 new preschool slots
|
15
|
|
Make other adjustments
|
166
|
|
Subtotal
|
(–$3,307)
|
|
K–12 Education
|
|
|
Fund LCFF increase for school districts
|
$4,048
|
|
Fund Internet infrastructure grants (one time)
|
100
|
|
Provide K–12 COLA for select programs
|
71
|
|
Increase funding for the Charter School Facility Grant Program
|
50
|
|
Subtotal
|
($4,270)
|
|
Workforce Education and Training
|
|
|
Fund adult education consortia
|
$500
|
|
Fund career technical education grants (one time)
|
250
|
|
Fund certain noncredit courses at credit rate
|
49
|
|
Fund new apprenticeships in high–demand occupations
|
15
|
|
Increase funding for established apprenticeships
|
14
|
|
Subtotal
|
($828)
|
|
California Community Colleges
|
|
|
Augment student support programs
|
$200
|
|
Augment CCC funding (to be specified in May Revision)a
|
170
|
|
Pay down mandate backlog (one time)
|
125
|
|
Provide apportionment increase (above growth and COLA)
|
125
|
|
Fund 2 percent enrollment growth
|
107
|
|
Provide 1.58 percent COLA for apportionments
|
92
|
|
Remove enrollment stability funding
|
–47
|
|
Subtotal
|
($772)
|
|
Total Changes
|
$2,563
|
|
2015–16 Proposed Spending Level
|
$65,716
|
Higher 2015–16 Spending. As shown in Figure 13, the Governor’s budget for 2015–16 increases Proposition 98 spending by $4.9 billion from the 2014–15 Budget Act level. Though the Governor proposes a number of augmentations, he dedicates the bulk of new spending to: (1) LCFF implementation, (2) a package of workforce education and training initiatives, and (3) community college apportionments. In 2015–16, the Governor also dedicates $125 million to almost entirely eliminate the CCC mandates backlog. (Altogether, across all three fiscal years, the Governor’s package includes a total of $1.5 billion to reduce the state’s outstanding mandate backlog.)
Plan Also Pays Off Emergency Repair Program Obligation. The Governor’s budget includes $273 million for the last payment toward the Emergency Repair Program. Statute requires the state to provide a total of $800 million to school districts for emergency facility repairs, and the state has provided $527 million to date. (Of the $273 million, $163 million comes from a settle–up payment and $110 million comes from unspent prior–year Proposition 98 funds. The Governor uses the remainder of the $256 million settle–up payment for mandates, which is reflected in the amounts referenced above.)
Overall, Per–Pupil Funding Increases Significantly. Overall, the Governor’s plan increases Proposition 98 K–12 funding from the revised 2014–15 level of $9,263 to $9,571 in 2015–16—an increase of $308 (3.3 percent). Comparable funding for the community colleges also increases, from the revised 2014–15 level of $6,066 per full–time equivalent (FTE) student in to $6,574 per FTE student in 2015–16—an increase of $508 (8.4 percent).
Governor’s Spending Priorities Generally Consistent With Legislature’s Priorities. The Governor’s major proposals are consistent with many of the Legislature’s spending priorities over the past few years. Most notably, both the Governor and Legislature have given top priority to new ongoing school funding for implementing the LCFF. The Governor and the Legislature also have worked together over the past few years to enact certain changes to adult education and have tasked agency staff to recommend additional improvements moving forward. Furthermore, as discussed below, both the Governor and the Legislature have placed a high priority on paying down outstanding obligations.
Proposed Budget Makes Notable Progress Toward Retiring Education Obligations. The Governor’s budget package would allow the state to make substantial progress toward retiring its existing obligations to schools and community colleges. By paying down all remaining deferrals, the state would return to the statutory payment schedule for the first time since 2000–01. For schools and community colleges, this would improve cash flow and reduce reliance on short–term borrowing. The Governor’s plan also would make notable progress toward retiring the mandate backlog. We believe the Governor’s emphasis on paying off existing obligations is a sensible approach, particularly while state revenue remains strong.
Devoting Some 2015–16 Funding for One–Time Purposes Provides Cushion if Revenue Declines in Future Years. Though we anticipate the state’s moderate economic growth will continue in the near term, the minimum guarantee could decrease in 2016–17 or future years if stock market prices were to drop or growth in the economy and personal income were to decline. Even a modest slowdown could reduce the 2016–17 minimum guarantee below the Governor’s proposed 2015–16 spending level. Were the Legislature to commit all 2015–16 funds for ongoing purposes, a decline in 2016–17 likely would require reductions to ongoing programs, potentially reversing progress the state has made in recent years toward fully implementing LCFF. The Governor’s budget partially mitigates the risks associated with this scenario by dedicating $475 million of the increase in 2015–16 to one–time purposes. If the minimum guarantee were to decrease by no more than this amount in 2016–17, the Legislature could avoid the need to reduce ongoing programs. To provide a larger cushion in the event of a 2016–17 decline, the Legislature may want to consider dedicating a larger amount of 2015–16 spending for one–time activities.
Estimate of General Fund Community College Apportionment Costs Too High. We identified a technical issue in the Governor’s budget relating to community college apportionments (which are funded through a combination of state General Fund and local property tax revenue). Specifically, the state share of community college apportionment costs is over–budgeted by $170 million. The administration is aware of the issue and intends to have a proposal in May that would spend the available funds on other community college activities. The Legislature, however, could allocate the funds for any Proposition 98 purpose.
The largest proposal in the Governor’s budget is a $4 billion augmentation for implementation of LCFF. Below, we discuss the enactment of the LCFF and the main components of the formula. We then describe and assess the Governor’s proposal.
State Enacts New School Funding Formula in 2013–14. Legislation enacted as part of the 2013–14 budget package made major changes to the way the state allocates funding to school districts and charter schools. Previously, the state distributed school funding through revenue limits (general purpose grants) and more than 40 state categorical programs. The funding provided through categorical programs constrained districts’ spending choices—providing restricted state dollars that districts could use for only certain activities. The state replaced the historical revenue limit and categorical funding system with a student–oriented, formula–based funding system known as LCFF.
Formula Based on Student and District Characteristics. As displayed in Figure 14, LCFF provides districts and charter schools with base funding tied to four grade spans; supplemental funding for English learner, low–income, and foster youth (EL/LI) students; and concentration funding for districts with relatively high proportions of EL/LI students. Generally, the base rates increase for higher grades in recognition of the greater costs of education at higher levels—for example, providing career technical education in high school. (The K–3 rate is higher to support class size reduction in those grades.) Under the LCFF system, differences in districts’ and charter schools’ funding levels are based on their student characteristics.
Figure 14
Per–Student Funding Under LCFF
|
Grade Spans
|
Base Ratesa
|
Supplemental Fundingb
|
Concentration Fundingc
|
|
K–3
|
$7,741
|
$1,548
|
$3,870
|
|
4–6
|
7,116
|
1,423
|
3,558
|
|
7–8
|
7,328
|
1,466
|
3,664
|
|
9–12
|
8,711
|
1,742
|
4,356
|
An Illustration of Two Districts’ LCFF Calculations. Figure 15 shows the LCFF calculation for two equally sized elementary school districts. Both districts generate the same amount of base funding given they serve the same number of students in the K–3 and 4–6 grade spans. Though they have the same attendance by grade span, District A has a notably higher share of EL/LI students compared to District B. As a result, District A generates more supplemental funding than the other district. Unlike District B, District A also generates concentration funding given its share of EL/LI students exceeds the 55 percent threshold. Given the difference in student demographics, District A receives a total of $426,000 more than the other district.
Figure 15
Illustration of LCFF Calculation for Two Elementary Districtsa
|
|
District A
|
District B
|
|
Attendance
|
|
|
|
K–3
|
100 students
|
100 students
|
|
4–6
|
120 students
|
120 students
|
|
EL/LI percentageb
|
91%
|
50%
|
|
Grade span funding
|
$1,628,000
|
$1,628,000
|
|
Supplemental funding
|
$296,000
|
$163,000
|
|
Concentration funding
|
$293,000
|
—
|
|
Totals
|
$2,217,000
|
$1,791,000
|
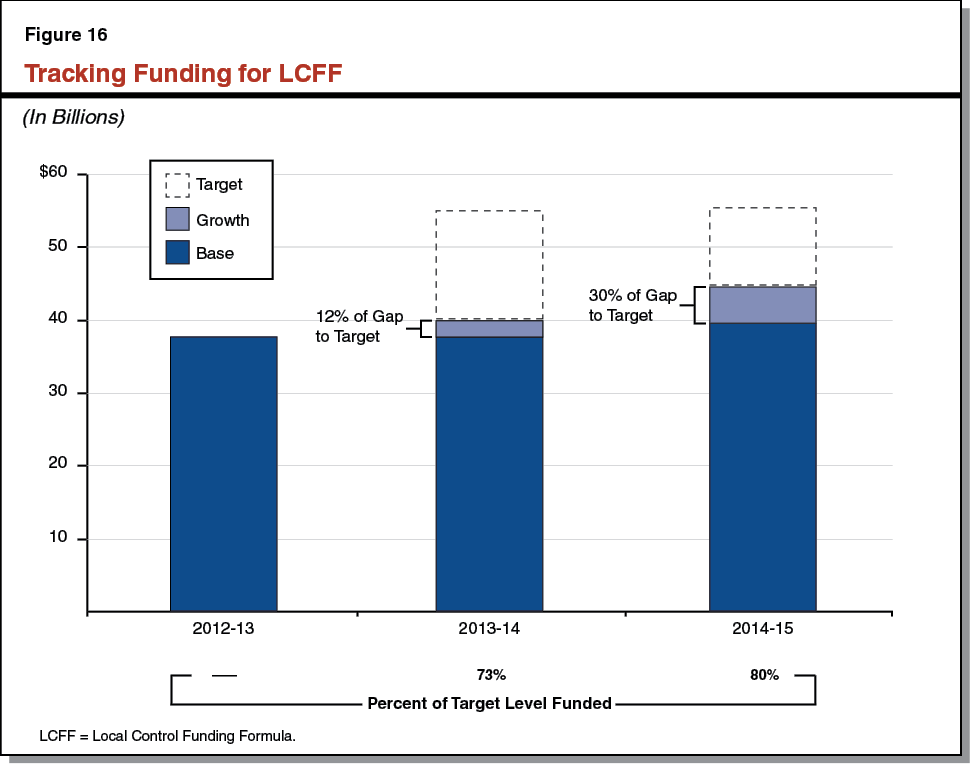
Implementation Expected to Take a Number of Years. The new system is much more costly than the prior system. At the time of enactment, fully implementing LCFF was estimated to cost $18 billion more than the 2012–13 K–12 spending level. Based on projections of growth in Proposition 98 funding, the administration estimated that the state would reach full implementation in 2020–21. Each year the total cost of the new system changes due to (1) increasing the base rates by COLA and (2) changes in attendance and student demographics. As displayed in Figure 16, over the past two years, the state has provided $6.8 billion towards implementing the formula. For 2014–15, statewide funding for LCFF is estimated to be 80 percent of the full implementation cost.
Districts Have Discretion Over Use of Funds. LCFF funding is largely considered general purpose, which districts can use at their discretion. For supplemental and concentration funding, however, statute requires districts to demonstrate that they “increase or improve” services for EL/LI students in proportion to the increase in funding generated by the students. As required by statute, the State Board of Education developed a formula to link the proportional increase in funding with increase in services, but districts have no explicit requirement to spend a certain amount on EL/LI services. (Given legislative interest the past few years, the nearby box describes the information available on EL/LI students under the new system.)
Since the enactment of the Local Control Funding Formula (LCFF), legislators have expressed interest in learning more about how English Learners and low–income (EL/LI) students are faring under the new system. Below, we discuss what is known to date about EL/LI funding, spending, services, and performance.
Considerable Funding Provided for EL/LI Students. One frequently asked question is how much funding the state is providing for EL/LI students under the new funding system. If LCFF had been fully implemented in 2014–15, the state would have provided districts with $35 billion (out of a total of $58 billion in LCFF funding) on behalf of EL/LI students. In 2014–15, the state is providing total funding sufficient to cover only 80 percent of full implementation costs. If one assumes all components of the formula are being phased in at the same rate (that is, base, supplemental, and concentration funding all are 80 percent funded on a statewide basis), then districts received $28 billion (out of a total $46 billion in LCFF funding) for EL/LI students—$21 billion base funding, $4 billion supplemental funding, and $3 billion concentration funding.
Unknown How Much Districts Are Spending in Total on EL/LI Students. Another frequently asked question relates to the total amount districts are spending to educate EL/LI students. Currently, the state cannot answer this question, largely because statute does not require districts to measure or report their EL/LI–specific expenditures. The state does not require this specific type of reporting because it would be difficult, complex, and problematic for districts to undertake. For example, would the state want to require districts to pro–rate each of their teachers’ time to measure contact with EL/LI students versus other students? The state does collect districts’ expenditure data through a system called the “Standardized Account Code Structure,” but the system currently is not designed to capture the type of data needed to isolate total EL/LI expenditures.
Districts’ Supplemental Expenditures Also Unknown. Even if total EL/LI expenditures are not available, some legislators have wondered if the state has data on supplemental expenditures for EL/LI students. Although districts receive separate base, supplemental, and concentration funding, the state does not define base versus supplemental expenditures. Making this distinction is difficult. For example, are smaller class sizes a supplemental service? Are counseling services for all students a supplemental expenditure? Under the new system, the state also does not require districts to use their supplemental and concentration funding exclusively for EL/LI students or require districts to report what expenditures those pots of funding support. For all of these reasons, the Standardized Account Code Structure neither differentiates between the subcomponents of the LCFF (base, supplement, and concentration) nor collects data on supplemental expenditures. Districts’ Local Control and Accountability Plans (LCAPs) contain some supplemental expenditure data, but this information is based on districts’ local definitions of supplemental expenditures and the state does not aggregate the information. (Prior to LCFF, districts received restricted Economic Impact Aid funds—funds that could be used only for EL and low–performing students and had to be used in prescribed ways. Given the associated rules were much more restrictive, districts were able to track their Economic Impact Aid spending through the Standardized Account Code Structure, which contained codes specific to funding source and expenditure activity.)
Information on EL/LI Services Available but Not Compiled and Reported Statewide. Another common question relates to what services EL/LI students are receiving under the new system compared to the former system. Under the new system, statute requires districts to describe the services they will provide EL/LI students in their LCAPs. Based on our review of 50 district LCAPs, districts largely are pursuing similar types of services as those provided under Economic Impact Aid, although perhaps at greater levels. Professional development for teachers and purchasing supplemental materials continue to be among the most common overarching strategies for serving EL/LI students. Though data on services are available through LCAPs, the state is not compiling the data contained in the local plans into a central data repository. As a result, it does not have ready access to statewide data on all districts’ EL/LI services.
In Future Years, State Could Use Performance Data to Identify Successful Strategies for Serving EL/LI Students. Once the state has a number of years of student performance data, it will be better positioned to assess the impact of the new system on EL/LI students. The state has long considered how best to serve EL/LI students. The LCFF itself was a recognition the state wanted to do more to help EL/LI students improve their academic performance. Given the overarching goal of LCFF to help students improve, the state likely will want to examine EL/LI performance data carefully. Down the road, were the state to find that some districts’ EL/LI students are performing much better than other districts’ EL/LI students (even under a system that provides all districts the same amount for these students), it could examine differences in services to determine if some instructional approaches and practices are more effective.
Provides $4 Billion for District and Charter School LCFF Increases. Consistent with the prior two years, the Governor’s largest proposed programmatic augmentation in 2015–16 is for LCFF. The Governor’s budget provides $4 billion (9 percent) increase from 2014–15—bringing total LCFF funding to $51 billion. The Governor estimates the additional funding would close 32 percent of the remaining gap to target funding levels. We estimate the proposed 2015–16 LCFF funding level would be approximately 85 percent of the statewide full implementation cost.
Allows Regional Occupational Centers and Programs (ROCPs) and Adult Education Maintenance–of–Effort (MOE) Provisions to Expire. Under LCFF statute, districts were required to spend no less in 2013–14 and 2014–15 than they did in 2012–13 on ROCPs and adult education. Consistent with statute, the Governor’s proposal allows these MOEs to expire. Almost all ROCP funding flowed to districts and COEs. As a result, districts and COEs will have discretion over how to spend funds previously reserved for ROCPs. Three ROCP joint powers agencies received a total of $444,000 directly from the state and additional funding from participating districts in their regions. With the expiration of the MOE, these ROCPs will no longer receive direct state funding and the participating districts may choose to change the level of funding they pass through to the ROCPs in 2015–16. (As we discuss later in this report, the Governor’s budget includes several other workforce development proposals that provide additional funding for career technical education.)
Shifts Home–to–School Transportation Funding From Joint Powers Agencies to Member Districts. In 2012–13, eight joint powers agencies received a total of $13.7 million directly from the state to provide transportation services to about 70 districts. Implementing statute continued funding these joint powers agencies for 2013–14 and 2014–15. Consistent with statute, the Governor’s proposal allows this funding to expire at the end of 2014–15. Starting in 2015–16, the Governor proposes apportioning the funding that had gone to the joint powers agencies among their member districts. Each joint powers agency would determine the amount of funding to apportion to each of its member districts. These amounts would be added on top of the member districts’ LCFF funding allocations and would need to continue being spent on transportation services (as is the case with all other districts’ former Home–to–School Transportation allocations). Given the proposal shifts the $13.7 million from the former joint power agencies to their member districts, it has no effect on total transportation costs.
Makes Adjustments for Growth in Attendance. The Governor’s budget adjusts LCFF funding to account for slight upward revisions in attendance estimates for 2013–14 and 2014–15, as well as for projected attendance in 2015–16. For 2013–14, the administration estimates attendance growth will be 0.32 percent higher than assumed at the time of the 2014–15 Budget Act. (The California Department of Education released final 2013–14 LCFF apportionment data in late June 2014, after the 2014–15 budget plan was adopted.) These updated estimates of attendance increase 2013–14 LCFF costs by $116 million. For 2014–15, the administration estimates attendance growth will be 0.55 percent higher than assumed at the time of the 2014–15 Budget Act. These updated estimates of attendance increase LCFF costs by $222 million. For 2015–16, the Governor anticipates district attendance will decline and charter attendance will increase, causing a net decline in attendance of 0.01 percent from the revised 2014–15 level. Because statute allows districts with declining enrollment to receive their prior–year funding level (under a one–year hold harmless provision), the savings from districts’ declining enrollment is only $6.8 million. The increase in charter attendance results in $59.5 million higher costs. The net cost due to changes in attendance is $52.7 million.
Package of LCFF–Related Proposals Reasonable. We do not have concerns with the LCFF–related proposals discussed in this section. The Governor’s proposal to dedicate the bulk of any additional ongoing school funding to LCFF is consistent with the past two years of implementation and supports reaching the target funding levels as quickly as possible. We also think the Governor’s ADA adjustments are reasonable, as they are based on the best available data. The Governor’s proposal to allow the ROCP and adult education MOEs to expire is consistent with the statutory intent of initially easing transition to the new funding system while subsequently giving districts greater discretion over the use of their LCFF funding. The Governor’s proposal to shift school transportation funding from joint powers agencies to their member districts would treat all districts receiving transportation funding similarly regardless of how they previously had provided their transportation services.
In this section, we describe how the state calculates school districts’ LCFF allotments during the LCFF transition period and explain how that affects the amount of local property tax revenue that counts as Proposition 98 spending. We then describe how the Governor’s budget accounts for these issues. As the Governor’s approach not only systematically understates the additional local property tax revenue under LCFF, but also creates the potential for exceeding the minimum guarantee on an ongoing basis, we provide the Legislature an alternative approach for accounting for local property tax revenue. The alternative is less sensitive to changes in property tax estimates and avoids the potential of Proposition 98 spending increasing above budgeted levels.
During Transition, Most Districts Receive State Funding to Close Their “Gaps.” Most school districts’ current LCFF funding levels are below their ultimate LCFF statutory funding targets. Over the next several years, the state plans to ramp up these districts’ funding levels until the targets are reached. (As described earlier in this report, LCFF is much more costly than the previous funding system. Currently, most districts receive 75 percent to 90 percent of their funding targets.) During this transition period, these districts receive additional state funding based on their “gaps”—the difference between their prior–year LCFF allotment and their target funding levels. Each year, the state closes the same percentage of each district’s gap based on a General Fund appropriation for LCFF. This appropriation counts towards the total LCFF cost. The LCFF, in turn, is the largest component of Proposition 98 spending each year. To date, the state has decided to make a General Fund appropriation for LCFF that is sufficient to meet (but not exceed) the estimated Proposition 98 minimum guarantee for that year.
Some Districts Do Not Receive State Gap Funding Because of High Local Property Tax Revenue. Though the vast majority of districts receive state gap funding because they do not have sufficient local property tax revenue to reach their annual LCFF allotments, about 1 in every 10 districts have sufficient local property tax revenue to meet or exceed their LCFF allotments. These districts are known as basic aid districts. State policy allows these districts to keep this “excess” local property tax revenue and spend it for any educational purpose. Of the 108 basic aid districts in the state, all have property tax revenues in excess of their current LCFF allotments and 79 of them now have property tax revenues in excess of the their ultimate LCFF funding targets.
For a Basic Aid District, the State Assumes a Hypothetical Funding Gap and Closes It Using Property Tax Revenue. Though all basic aid districts’ local property tax revenue currently is sufficient to fill their LCFF allotments for the year, the state nonetheless assumes these districts have a hypothetical funding gap. (Why the state is taking this approach is unclear.) When the state provides a General Fund appropriation to close other districts’ gaps, it simultaneously counts more of a basic aid district’s local property tax revenue as LCFF spending. This accounting practice has no effect on a basic aid district’s total revenue. At the state level, the accounting practice, however, increases the amount of local property tax revenue that counts toward the minimum guarantee (and reduces the amount of local revenue deemed excess by that amount). This has the effect of increasing total Proposition 98 LCFF spending beyond the anticipated LCFF General Fund appropriation. Because the state has not been taking the additional property tax revenue into account when estimating the cost of LCFF and setting its Proposition 98 spending level, the state unintentionally can spend in excess of the minimum guarantee.
Illustration of How Calculation Works. Figure 17 illustrates how the state treats a basic aid district’s local property tax revenue for purposes of calculating the cost of LCFF. For the prior year, the state considers all local property tax revenue up to the district’s calculated LCFF allotment as part of the LCFF cost. Moving forward, as the state provides additional gap funding for other districts, it counts more of the basic aid district’s local property tax revenue toward LCFF. (The excess does not necessarily become smaller year over year because property values likely are increasing, thereby increasing total property tax revenue for the district.)
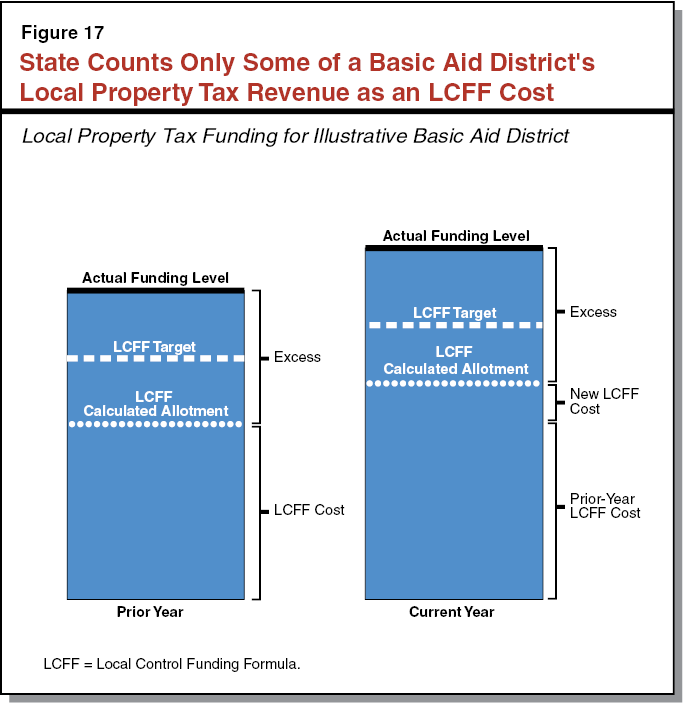
State Not Accounting for Increased Local Property Tax Revenue That Begins Counting Toward Guarantee. To date, the state has not included the additional property tax revenue from basic aid districts’ increased allotments as a Proposition 98 cost at the time of budget enactment. In 2013–14 (the first year of LCFF implementation), the state allocated $2.1 billion General Fund for the purpose of closing districts’ LCFF gaps. At the time, the state failed to recognize the additional local property tax revenue generated by basic aid districts’ transition funding allotments, which increased total LCFF spending beyond budgeted amounts. In making school district apportionments, CDE determined that $80 million in local property tax revenue that previously was considered excess was to begin counting toward basic aid districts’ LCFF allotments. As a result, the overall cost of LCFF in 2013–14 came in $80 million higher than budgeted (in excess of the $2.1 billion General Fund LCFF appropriation). This in turn increased total Proposition 98 spending, which, all else constant, would have resulted in spending exceeding the minimum guarantee. (As explained earlier in this report, the 2013–14 guarantee has since been revised upward, so the additional Proposition 98 spending could be accommodated within the higher guarantee.)
LCFF Cost Affects Proposition 98 Spending and Minimum Guarantee. Accurately estimating the cost of LCFF is critical due to its impact on Proposition 98 spending and, by extension, the minimum guarantee and the rest of the budget. If the state underestimates LCFF cost, total Proposition 98 spending eventually will increase automatically. This could result in spending more than the minimum guarantee, result in less for the state reserve or rest of state budget, and affect ongoing school costs moving forward (as the higher base spending level will affect the calculation of the minimum guarantee the subsequent year).
Administration Recognizes Increased LCFF Cost Due to Local Property Tax Revenue. For 2013–14, the administration has revised its estimate of LCFF cost upward by $80 million to account for the basic aid revenue shift reported by CDE (described earlier). For 2014–15 and 2015–16, the administration assumes an additional $90 million in property tax revenues each year will count toward the total LCFF cost. Under the Governor’s budget, the total increase in the amount of basic aid districts’ local property tax revenue counting toward the minimum guarantee would reach $260 million in 2015–16 (see Figure 18).
Figure 18
Comparing Governor’s and LAO’s Estimate of Increases in LCFF Cost for Basic Aid Districtsa
(In Million)
|
|
Governor’s Estimate
|
LAO’s Estimate
|
Difference
|
|
2013–14
|
$80
|
$80
|
—
|
|
2014–15
|
170
|
240
|
$70
|
|
2015–16
|
260
|
370
|
110
|
State Treating Basic Aid Districts as If They Have a Gap Even Though One Does Not Actually Exist. Seventy–nine (of 108) basic aid districts have property taxes in excess of their LCFF target funding amounts. Nonetheless, on paper, the state effectively treats them as if a gap still exists. We believe such an approach is unnecessarily complicated and lacks transparency. Moreover, this approach is inconsistent with how the state treats roughly 40 other nonbasic aid districts, which due to historically high funding levels, also have reached full LCFF funding (through a combination of local property tax revenue and state General Fund support). For these 40 districts, the state takes a more straightforward approach and recognizes that they are at their targets—counting their entire LCFF allocations toward the minimum guarantee. In addition to these concerns, not recognizing that basic aid districts have reached their full LCFF funding levels misrepresents the resources already available at the local level for improving student outcomes, including outcomes for EL/LI students.
Governor’s Proposal Underestimates LCFF Cost in 2014–15 and 2015–16. In addition to having policy concerns, we also have a fiscal concern in that the state currently is not accurately estimating the increase in local property tax revenue that will count toward the minimum guarantee during the transition period. Specifically, we are concerned that the administration has underestimated the cost of LCFF as a result of underestimating the amount of basic aid districts’ local property tax revenue that counts toward LCFF. The increases allocated by the state in 2014–15 and proposed by the Governor in 2015–16 are roughly twice the increase provided in 2013–14. As a result, we believe the state can expect LCFF cost increases due to the local property tax issue to be much larger than the Governor assumes. That is, if $2 billion in gap funding resulted in $80 million in additional basic aid district local property tax revenue counting toward LCFF in 2013–14, then $4 billion in gap funding presumably would result in at least $160 million in additional basic aid district local property tax revenue counting toward LCFF in 2014–15.
As shown in Figure 18, we believe the Governor has underestimated the amount of local property tax revenue that counts as an LCFF cost by $70 million in 2014–15 and $110 million in 2015–16. Should the Legislature maintain the current approach to basic aid districts’ LCFF allotments (and not revise its budget estimates), the state would end up with higher Proposition 98 spending than it intends in each of these years (when Proposition 98 already receives the bulk of the growth in state revenue). This, in turn, can affect resources available for the rest of the budget as well as affect calculations of the minimum guarantee moving forward. As long as the state retains its current budgeting approach in this area, it will continue to be susceptible to experiencing unintended Proposition 98 spending increases throughout the transition period.
Recognize Basic Aid Districts Are Already at Their LCFF Targets. We recommend the Legislature address the issue by counting all local property tax revenue up to a basic aid district’s target toward LCFF (and the guarantee) beginning in 2015–16. Alternatively, the state would have counted only local revenue up to a basic aid’s calculated allotment toward LCFF (and the guarantee) during the transition period. As shown in Figure 19, this change would recognize that for practical purposes these districts already are funded at—and in many cases funded well above—their LCFF targets. The change would not affect the amount of local revenue basic aid districts receive either now or at full LCFF implementation.
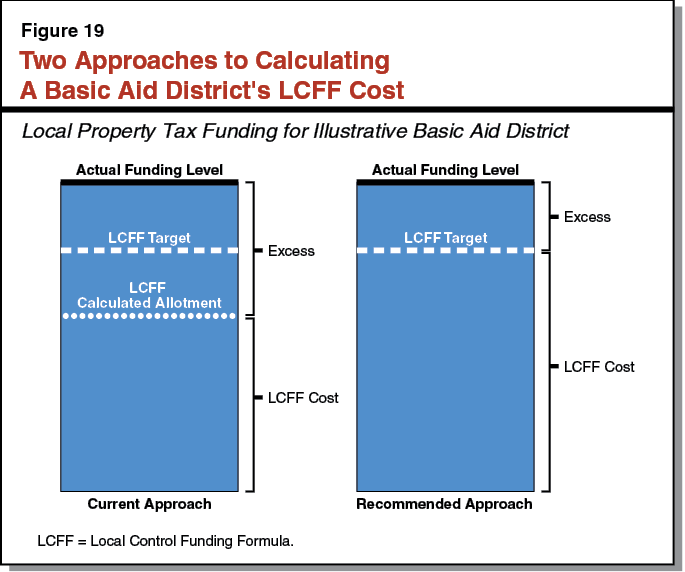
Overall Fiscal Effect of Recommendation Could Free Up $400 Million Non–Proposition 98 General Fund. Though excess revenues in basic aid districts do not count toward meeting the Proposition 98 minimum guarantee, the local revenues counted toward LCFF do count toward the guarantee, effectively reducing the state General Fund obligation for Proposition 98. We estimate this alternative approach would free up about $400 million in 2015–16 that the state could use for any of its other priorities—for other education programs or the rest of the budget. (We will refine our estimate later this budget season when updated data become available.) Since most basic aid districts no longer would have a “gap” to close with local revenue, the state would not need to make assumptions about how much of their local revenue counts to LCFF moving forward, thereby avoiding LCFF cost overruns that could impact the minimum guarantee.
Some Districts Would Shift to Nonbasic Aid Status and Receive State Funds to Close Actual Gaps. Under our recommendation, 29 current basic aid districts that do not have sufficient local property tax revenue to reach their LCFF targets would become eligible for gap funding earlier than under the state’s existing transition approach. These districts have not been eligible for gap funding in prior years because their local property tax revenue has been sufficient to cover their hypothetical LCFF transition allotments. Moving forward, the state would compare these districts’ local property tax revenue with their LCFF targets—an actual gap akin to the gaps of all other nonbasic districts. Whereas these districts’ gaps had been filled by local property tax revenue they already had, these districts would begin benefitting in real terms from state LCFF transition funding. That is, when the state provides gap funding, these districts would receive state General Fund to get closer to their targets. This change effectively would treat these districts similarly to all other nonbasic aid districts statewide.
The Governor’s budget provides $1 billion in LCFF funds for the state’s 58 COEs in 2015–16, essentially the same amount as the revised 2014–15 level. In this section, we begin by providing background on the COE funding formula. Next, we describe the adjustments the Governor makes to COEs’ 2013–14 and 2014–15 funding levels as well as his proposal for 2015–16. We then discuss an implementation issue with the formula that we believe counteracts the intent of LCFF and recommend a corresponding statutory change.
State Created New COE Funding Formula in 2013–14. In tandem with implementing the school district LCFF, the state also revised its approach to funding COEs. While the allocation formula for districts differs from that for COEs, the state had a similar goal—replace an outdated and prescriptive set of revenue limit and categorical grants with a more consistent and student–oriented approach to funding.
COEs Have Two–Part Formula. Unlike school districts, which have one primary mission—to educate their students—COEs perform two core functions for the state. First, they provide a number of services for the districts in their county. Second, COEs operate alternative schools for certain categories of students. As shown in Figure 20, the COE LCFF consists of a two–part formula that recognizes these two areas of responsibility. While COEs’ total allotments are calculated in two parts, COEs have flexibility to use funds generated by the formula for any purpose. Like the school district formula, the COE LCFF is funded by a combination of state General Fund and local property tax revenue, with the exact proportion of each fund source varying by county.
Figure 20
Overview of Local Control Funding Formula for COEsa
2014–15
|
Operations Grant
|
|
Funding target
|
Base funding of $661,495 per COE.
Additional $110,249 per school district in the county.
Additional $40 to $71 per ADA in the county (less populous counties receive higher per–ADA rates).
|
|
Alternative Education
|
|
Eligible student population
|
Students who are (1) under the authority of the juvenile justice system, (2) probation–referred, (3) on probation, or (4) mandatorily expelled.
|
|
Target base rate
|
$11,139 per ADA.
|
|
Supplemental funding for EL, LI, and foster youth
|
Additional 35 percent of COE base grant.b
|
|
Concentration funding
|
Additional 35 percent of COE base grant for EL/LI students above 50 percent of enrollment.b
|
Funds COE Operational Support. As shown in the figure, LCFF provides an operations grant for each COE based on the total number of school districts and students within the county. This grant is intended to support basic COE operations and services for districts in the county. Each COE has considerable discretion over the use of this funding. Some COEs have opted to continue offering services that previously had been funded with categorical funds—such as ROCP and professional development—although some COEs now charge fees to districts for such services. (A maintenance of effort provision required COEs that ran ROCPs in 2012–13 to continue offering those services for the subsequent two years, but this requirement is scheduled to expire at the end of 2014–15.) The COEs also must use a portion of their funding to perform certain state–required activities for school districts within their counties, including providing fiscal oversight, verifying districts’ EL/LI student counts, and reviewing districts’ Local Control and Accountability Plans.
Funds COEs for Alternative Schools. The other part of the formula is for COE–operated alternative schools, including court schools and county community schools. The COEs generate funding for students who are incarcerated, on probation, referred by a probation officer, or mandatorily expelled. (A COE can serve other types of students through an arrangement with a cooperating school district to pass through a portion of the district’s funding.) As shown in the figure, the structure of this part of the COE formula is similar to the formula for school districts, except that the base rate is significantly higher and different percentages are used for the supplemental and concentration grants. As with school districts, the funding generated by the supplemental and concentration grants must be used to increase or improve services for the students generating the funds.
Legislation Included Two “Hold Harmless” Provisions for COE Funding. Implementing legislation included two additional provisions governing COEs’ funding. These two guarantees were intended to ensure that no COE experienced a loss in funding as a result of implementing the new formula. (These two provisions also apply to school districts.)
- 2012–13 Total Funding. Each COE will continue to get at least as much total funding as it received from revenue limits and categorical programs in 2012–13. This means that at full implementation, each COE will be funded at either its 2012–13 total funding level or its calculated LCFF target level, whichever is greater.
- 2012–13 Minimum State Aid. Each COE will continue to get at least as much state General Fund as it received in 2012–13 for categorical programs. This means that even in a county where local property tax revenue is sufficient to fund most or all of its LCFF allotment, the state must provide a specified amount of state aid. (See the nearby box for a description of how the state treats local property tax revenue for COEs.) The amount of minimum state aid to which each COE is entitled varies based on historical participation in categorical programs, with those that ran more and/or larger programs having received larger amounts of state aid.
In most school districts and county offices of education (COEs), the Local Control Funding Formula (LCFF) is supported by a combination of both local property tax revenue and state aid. For some districts and COEs, however, the amount of local property tax revenue received is high enough to exceed their LCFF allotments. These are referred to as “basic aid” or “excess tax” districts and counties. In 2013–14, about one in ten of the state’s school districts and 4 of 58 COEs were in this category.
Longstanding state policy has treated excess local property tax revenue differently in school districts as compared to COEs. Specifically, school districts are able to retain the local property tax revenue in excess of their LCFF allotment and use it for any purpose. In contrast, the state redirects any local property tax revenue generated in excess of a COE’s LCFF allotment and uses it to offset other General Fund expenditures. Current statute redirects COEs’ excess local property tax revenue to fund trial courts within those counties.
LCFF for COEs Fully Implemented. The state increased COE LCFF funding by $32 million in 2013–14 and an additional $26 million in 2014–15. We estimate these augmentations were sufficient to fund all COEs at their LCFF targets. In contrast to school districts (for which LCFF targets were 80 percent funded in 2014–15, up from 72 percent in 2013–14), full implementation for COEs happened relatively quickly because (1) 36 COEs already were above their targets in 2013–14, and (2) the cost to close the gap between the remaining 22 COEs’ initial and target funding levels was relatively small.
Hold Harmless Provision Benefiting About Two–Thirds of COEs. Many COEs’ funding allotments are governed by the two hold harmless provisions rather than the new formula, largely because so many COEs received more funding in 2012–13 than their calculated LCFF targets. This will continue to be the case until their LCFF targets increase (through annual COLAs and changes in ADA) to exceed their hold harmless funding levels. As shown in Figure 21, we estimate that due to the two hold harmless provisions, current funding levels are above LCFF targets in 38 counties, with some COEs’ funding levels notably above their LCFF targets. Many of these COEs operated large categorical programs such as ROCP before LCFF was implemented, resulting in higher 2012–13 funding levels.
Figure 21
Funding Levels Notably Exceed LCFF Target Levels for Many COEs
2014–15, Based on LAO Estimates
|
Funding Level
|
County Offices of Education
|
|
At LCFF Target
|
Alameda
|
Orange
|
|
Alpine
|
San Benito
|
|
Colusa
|
San Francisco
|
|
El Dorado
|
Shasta
|
|
Humboldt
|
Sierra
|
|
Kern
|
Siskiyou
|
|
Kings
|
Trinity
|
|
Madera
|
Tulare
|
|
Modoc
|
Tuolumne
|
|
Nevada
|
Yuba
|
|
101 Percent to 125 Percent of LCFF Target
|
Butte
|
San Joaquin
|
|
Calaveras
|
San Luis Obispo
|
|
Imperial
|
Solano
|
|
Lassen
|
Tehama
|
|
Merced
|
Yolo
|
|
Monterey
|
|
|
126 Percent to 150 Percent of LCFF Target
|
Amador
|
Sacramento
|
|
Contra Costa
|
San Bernardino
|
|
Fresno
|
Santa Diego
|
|
Lake
|
Santa Cruz
|
|
Los Angeles
|
Sonoma
|
|
Mariposa
|
Stanislaus
|
|
Napa
|
Ventura
|
|
Placer
|
|
|
151 Percent to 200 Percent of LCFF Target
|
Del Norte
|
Plumas
|
|
Glenn
|
Santa Barbara
|
|
Marin
|
Santa Clara
|
|
Mendocino
|
Sutter
|
|
201 Percent to 260 Percent of LCFF Target
|
Inyo
|
Riverside
|
|
Mono
|
San Mateo
|
Makes $62 Million Upward Adjustment to 2013–14. The Governor’s budget reflects higher prior–year spending of $62 million based on actual expenditure data that is now available. The higher costs primarily are the net result of three adjustments: (1) the actual amount of 2012–13 base COE funding upon which 2013–14 LCFF targets and hold harmless amounts are calculated was higher than the administration originally estimated ($45 million); (2) the amount of local property tax revenues in some COEs led to additional state expenditures to meet the minimum state aid provision, as we discuss in greater detail below ($24 million); and (3) COEs served fewer alternative education students than anticipated (–$8 million). The COE–operated alternative education programs served 23,669 ADA in 2013–14, which is nearly 6,800 (22 percent) fewer ADA compared to 2012–13. This is largely due to the LCFF policy changes that limited which types of students generate COE funding. (After this realignment, COEs’ ADA likely will return to tracking more closely with demographic changes.)
Increases 2014–15 Estimates Based on Prior–Year Adjustments. The Governor’s budget also increases current–year spending by $63 million compared to the 2014–15 Budget Act. This change is based almost entirely on carrying forward the three adjustments made to 2013–14.
Proposes Nearly Flat Funding for 2015–16 Compared to Revised 2014–15 Level. The Governor proposes only a small year–over–year increase for 2015–16 ($1 million). This is largely due to applying a COLA and various offsetting minor adjustments, including changes in ADA. The budget includes a 1.58 percent COLA for LCFF rates. We project this adjustment would result in funding increases for 23 COEs. (We estimate that existing funding levels for the remaining COEs remain above their COLA–adjusted LCFF levels.) The budget estimates COEs will serve 23,657 alternative education students in 2015–16. This represents a slight decline (0.3 percent) compared to the revised 2014–15 estimate, based on a projected decline in statewide enrollment for grades 9 through 12.
Though Total Funding Nearly Flat, General Fund Spending Down. The $1.045 billion the Governor proposes for COE LCFF in 2015–16 consists of $478 million in state General Fund and $568 million in local property tax revenue. Compared to revised 2014–15 levels, state General Fund spending goes down by $67 million, with local property tax revenue going up by a like amount. (As discussed in the “Estimates of the Minimum Guarantee” part of this report, local property tax revenue for education is increasing statewide due to several factors.)
While we do not have concerns with the Governor’s COLA and ADA adjustments, we are concerned that his budget proposal underestimates the overall cost of implementing the COE LCFF in both 2014–15 and 2015–16. These funding shortfalls result from the minimum state aid provision, which we believe represents a fundamental flaw in the COE LCFF. Below, we first discuss the effects of the minimum state aid requirement and explain why we believe the provision is not only unnecessary but counterproductive. We then describe the fiscal implications relative to the Governor’s budget.
Minimum State Aid Provision Creates Funding Advantages for Some COEs. The way statute structures the minimum state aid provision is generating additional funding—beyond the LCFF allotment—for certain COEs. In COEs where local property tax revenue is sufficient to fund most or all of their LCFF funding allotment, the minimum state aid becomes a funding supplement on top of that allotment. This treatment can result in funding differences across COEs. Figure 22 illustrates the implications of this provision. In the figure, all three example COEs have an LCFF funding allotment of $100 million and a minimum state aid requirement of $10 million. Differences in underlying local property tax revenue, however, result in different funding totals across the counties.
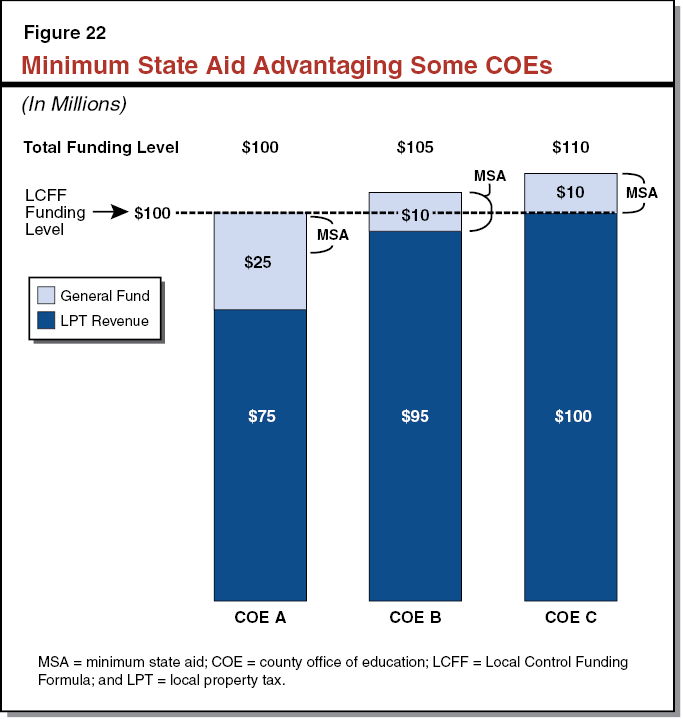
Provision Not Needed to Hold COEs Harmless Against Funding Losses. Guaranteeing that COEs receive at least as much total funding as they received from revenue limits and categorical programs in 2012–13 is sufficient to ensure COEs do not experience funding losses due to LCFF—adding the minimum state aid provision was not necessary to achieve this goal.
Provision Changes Longstanding Treatment of COE Local Property Tax Revenues. Providing minimum state aid as an additional supplement also contradicts the state’s established policy that COEs—in contrast to districts—do not receive financial benefit from comparatively higher local property tax revenues. Historically, a COE received no more than its calculated funding allotment—made up of revenue limits and categorical funding—regardless of how much local property tax revenue it generated. Under the new law, COEs with comparatively high local property tax revenues can receive their full funding allotment plus additional funding.
Provision Counteracts Intent of LCFF. Providing the minimum state aid as an additional supplement to some COEs’ LCFF allotments exacerbates existing funding disparities across COEs and undermines the principles of LCFF. While the state knowingly locked–in initial funding advantages for certain COEs by guaranteeing them their 2012–13 overall funding levels, the stated intent of the LCFF was to erode these historical artifacts over time, not to introduce new disparities. One of the primary arguments behind establishing LCFF was to eliminate historical funding differences across the state that were not based on underlying student and district needs. In contrast to this intended outcome, certain COEs are newly benefiting from the minimum state aid supplement because of factors that have no relation to the number or types of students and districts they serve. (These factors include relatively higher property values, relatively higher historical participation rates in former categorical programs, or relatively higher historical shares of the county’s local property tax revenue directed to the COE.) For example, the COE formula calculates that Riverside COE should get $29 million in LCFF funds. Based on its higher 2012–13 funding level, however, Riverside COE receives $55 million—nearly double that amount. Yet we estimate that because of property tax revenue growth in Riverside county, the state will provide the COE with an additional $7 million from the minimum state aid supplement in 2014–15, growing to $12 million in 2015–16. Thus, based on our estimates, Riverside COE will receive $67 million in 2015–16—$38 million more than the amount calculated under the new formula.
Provision Increases Overall Costs for COE LCFF. Providing the minimum state aid in addition to COEs’ LCFF allotments increases the total amount the state must dedicate towards the COE LCFF, and we project these costs will continue to grow in the coming years. As local property tax revenue continues to increase across the state, it will cover larger shares of the LCFF allotment for many COEs. This will cause even more COEs to benefit from an additional minimum state aid supplement at even greater levels, increasing overall COE funding rates and state costs. The state will therefore need to dedicate a larger share of its Proposition 98 expenditures to the COE LCFF, leaving less funding available for other education spending priorities (such as implementing the school district LCFF).
Administration Underestimates Cost of Implementing Minimum State Aid Requirement by Tens of Millions of Dollars. We project the cost increases resulting from the existing minimum state aid requirement will begin in the current year, and that the Governor’s proposal does not sufficiently budget for these costs. Providing minimum state aid supplements to 11 COEs cost the state $24 million in 2013–14. The Governor estimates these costs will continue at the same level in 2014–15 and 2015–16. Our county–level analysis of local property tax growth, however, projects notably higher costs. Specifically, we estimate that in 2014–15, 20 COEs will qualify for a partial or full minimum state aid supplement on top of their LCFF allotments, costing around $40 million ($16 million above the Governor’s estimates). In 2015–16, we estimate the total minimum state aid costs will increase to around $60 million ($36 million above the Governor’s estimates), affecting 21 COEs. Because the COE LCFF is continuously appropriated, the state—absent a statutory change—will have to allocate sufficient funding to cover whatever the minimum state aid supplements ultimately cost.
Although we project the Governor’s budget contains a funding shortfall for the COE LCFF, we do not recommend providing this additional funding. Instead, we recommend the Legislature revise the underlying minimum state aid policy, which would eliminate these additional costs and improve the state’s overall approach to funding COEs.
Amend Statute to Avoid Creating New Funding Disparities Among COEs. We recommend the Legislature revise the COE minimum state aid provision to stop affording additional state aid to certain COEs on top of their overall LCFF funding allotments. There are two options for accomplishing this goal. One approach would be to repeal the minimum state aid provision altogether and allow local property tax revenue to mostly or fully fund the LCFF allotment for some COEs. The second option would be to provide the minimum state aid as a component within a COE’s LCFF funding allotment, rather than as a supplement on top. This would reduce the amount of local property tax revenue scored towards the COE’s LCFF allotment by a like amount, allowing the state to redirect that excess local property tax revenue for other purposes. (The second option would be somewhat more complicated to implement than the first, but the state could take this approach if guaranteeing that each COE continues to receive its 2012–13 categorical state aid amount is determined to be an important component of LCFF.) Under either approach, the effects would be the same:
- Would Eliminate Newly Created Funding Advantages for Certain COEs. Eliminating the supplement would maintain longstanding state policy and ensure no COE is fiscally advantaged by its county’s underlying property wealth or growth in local property tax revenue.
- Would Ensure COEs Are Held Harmless at 2012–13 Funding Levels. Under our recommendation, all COEs would continue to be funded at the greater of their calculated LCFF amounts or their overall 2012–13 funding levels. This upholds the premise that no COE should be fiscally disadvantaged by the new system relative to its 2012–13 level.
- Would Free Up Proposition 98 Resources for Other Purposes. We estimate that repealing or modifying the minimum state aid provision would decrease total COE LCFF costs in 2014–15 by around $40 million and in 2015–16 by around $60 million. These funds would then be available for other Proposition 98 priorities.
- Would Maintain Same Overall State General Fund and Proposition 98 Spending Levels. Adopting our recommendation would not have any direct effect on either total state General Fund expenditures or total Proposition 98 spending. If the state were to eliminate the minimum state aid provision altogether, additional local property tax revenue would count toward COEs’ LCFF allotments, thereby freeing up General Fund dollars for another Proposition 98 purpose. If the state were to maintain the minimum state aid requirement but count that amount toward COEs’ LCFF allotments, the resulting funding arrangement would be somewhat more complicated but have the same net result. (Under that approach, the state would redirect excess COE local property tax revenue to offset General Fund expenditures on a non–Proposition 98 program like trial courts, then increase General Fund expenditures within Proposition 98 to backfill the redirected local property tax revenues and meet the minimum guarantee spending requirement.)
California Implements New Tests Aligned With New Academic Content Standards. The new standards—known as the Common Core State Standards—apply to math and reading in grades K through 12. California joined the Smarter Balanced Assessment Consortium (SBAC) in 2011, with the goal of creating new standards–aligned tests that could measure students’ mastery of the Common Core State Standards. State and federal law requires that students in grades 3 through 8 and grade 11 take standardized tests annually for accountability purposes. The SBAC requires that all students take tests online by spring 2018 but allows districts to administer a pencil and paper version of the test during the first three years of implementation. The online version of the test is different from the paper and pencil version because it is adaptive, which means the test questions change depending on a student’s answers to the previous questions. Each spring, schools have a 12–week window to administer the test to students in grades 3 through 8 and a seven–week window for grade 11.
State Required Schools to Administer Trial Tests in Spring 2014. The state directed schools to administer a practice run of the online version of the SBAC tests in spring 2014, if possible. (Because it was a trial, test results were not reported for accountability purposes.) The trial test was intended to help schools transition to the new standards and give them an opportunity to determine their technology needs before administering the first operational tests in spring 2015. Though CDE reported that the overwhelming majority of schools did not have trouble administering the online trial test, a small number of schools reported having difficulty.
State Provided Grants to Help Schools Improve Online Testing Capabilities. To address online testing concerns, in 2014–15 the state provided $26.7 million on a one–time basis for Broadband Infrastructure Improvement Grants (BIIG) to improve Internet infrastructure to schools. (These grants were in addition to numerous state and federal programs that provide funding to schools to support Internet infrastructure and use. These programs are described in the nearby box.)
In our article, Internet–Related Programs Since 2000” (available on our website), we catalog major funding allocated since 2000 for Internet–related programs that benefit both schools and other agencies as well as those that exclusively benefit schools. We determined schools had received the majority of $7 billion ($790 million state and $6.2 billion federal) for five programs benefiting them and other beneficiaries, as well as a total of $2.1 billion ($1.5 billion state and $615 million federal) through eight programs exclusively benefitting them. Below, we summarize the main state and federal programs in existence today, aside from the Broadband Infrastructure Improvement Grants and the K–12 High Speed Network.
Three Programs That Pay for Internet Service and Infrastructure Costs for Schools and Other Entities. Schools receive high state and federal subsidies to purchase Internet services. The state has a program that subsidizes a portion of Internet service costs for schools and libraries known as the California Teleconnect Fund. The federal government has a similar program for schools and libraries—the Schools and Libraries Program of the Universal Service Fund (more commonly known as E–Rate). When taken together, these two programs can cover up to 95 percent of schools’ ongoing Internet service costs. The E–Rate program also supports building out Internet infrastructure to schools and libraries. Lastly, the California Advanced Services Fund supports building out Internet infrastructure to unserved and underserved geographic regions of the state and benefits multiple entities, including schools, households, businesses, and non–school government agencies.
Common Core Funding and General Purpose Funding Also Can Be Used for Internet Infrastructure at Schools. Recently, schools also have received a large amount of one–time funding ($1.25 billion) to help transition to new academic content standards, including building any Internet infrastructure required to administer the new online tests. Districts were allowed two years to spend the monies. Preliminary data indicate that in 2013–14, school districts had spent about 40 percent of the $1.25 billion. The California Department of Education is to summarize districts’ 2013–14 and 2014–15 expenditures, including more detailed information regarding districts’ uses of the funding, and provide that information to the Legislature by January 1, 2016. In addition to this funding, schools can use their general purpose Local Control Funding Formula funds to pay for any of their remaining Internet infrastructure or ongoing Internet service costs.
BIIG Designed to Pay for a Portion of a School’s Internet Infrastructure. Figure 23 shows how BIIG enables some schools to connect to the Internet. The BIIG pays for the portion of a school’s Internet infrastructure known as a “last–mile” Internet connection. The last–mile connection is typically the connection from the school to its school district office or COE. (Whether BIIG will cover the costs of installing Internet infrastructure from the schools to the district office as opposed to the COE depends on existing infrastructure.) From the COEs, a state program known as the K–12 High Speed Network (HSN) pays for and manages the Internet connections to a high–speed education Internet backbone operated by the Corporation for Education Network Initiatives in California (CENIC), a nonprofit organization that provides Internet–related services to educational agencies in California. (An Internet backbone is a series of fiber–optic cables that run across very large distances.) The CENIC backbone connects to the Internet, which consists of interconnected high–speed backbones around the world.
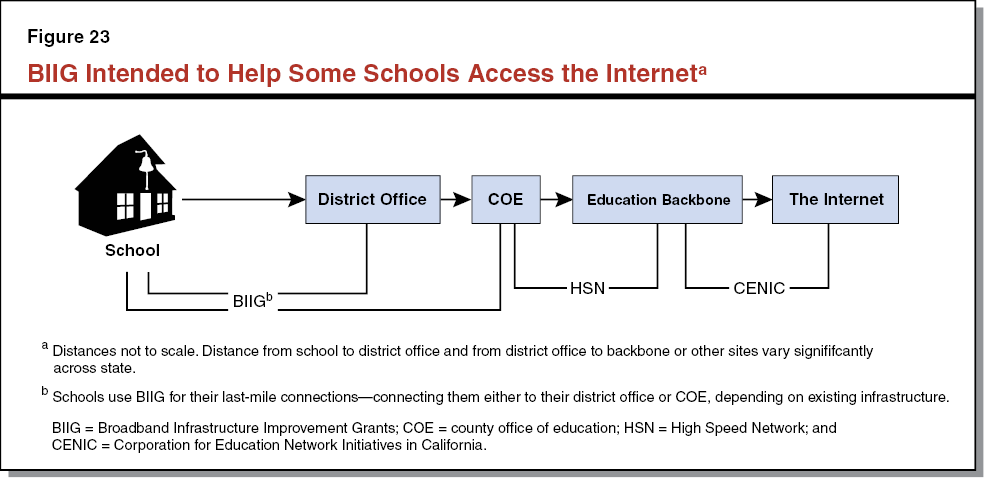
HSN and CDE Oversee BIIG Process. When the state created BIIG, provisional budget language specified that HSN, in partnership with CDE, would oversee the grant process. The HSN dates back to 2004–05, when CDE put forth a request for applications and awarded Imperial COE (ICOE) the HSN grant. The HSN is tasked with assisting schools with network connectivity, Internet services, information sharing, and, as described above, managing all 58 COEs’ connections to the CENIC backbone. Since 2009–10, CDE has awarded HSN about $8 million per year (Proposition 98 General Fund). In addition, HSN receives about $6 million per year in state and federal subsidies for the Internet services it purchases from commercial providers.
State Specifies Eligibility Criteria for BIIG. The 2014–15 budget specified that the only schools eligible to benefit from a grant either had to have been unable to administer the trial test onsite due to low Internet capacity or had to shut down other core online activities (such as email) in order to administer the trial test. The budget specified that HSN must give first priority to those schools unable to administer the tests that have the greatest number of affected test takers. As a condition of receiving funds, the budget required schools to commit to the ongoing costs associated with the new Internet connections. In addition to funding the grants, the budget requires HSN, in consultation with CDE and the State Board of Education, to submit a report to the Legislature on statewide school network connectivity by March 1, 2015.
HSN Identifies 304 Eligible Schools. The HSN identified schools eligible for BIIG based on (1) information COEs provided about schools’ Internet capacity, (2) results from the SBAC trial tests, and (3) data HSN collected about schools’ speeds. After HSN released the list of eligible schools, other schools had the opportunity to self–nominate if they believed they fit the eligibility criteria for BIIG. Next, HSN validated that the schools were eligible for BIIG by verifying that their Internet speeds were too slow to give the test or that they had to shut down other core activities to administer the test. The HSN then ranked schools to determine who would have first call on BIIG according to the priority rankings specified in the budget.
HSN Receives Bids for 240 Eligible Schools. After verifying eligibility, HSN contracted with a project manager to solicit bids from commercial Internet providers to build Internet infrastructure to these schools. The bids contained information about the type and cost of Internet infrastructure the provider would install to the school, the speeds that the infrastructure would support, and the ongoing service costs to operate the infrastructure. For a project manager, HSN chose CENIC. CENIC received bids from commercial providers to build improved infrastructure to 240 of the 304 eligible schools. However, 13 schools did not accept their bids for various reasons—for example, because their school district or COE had concurrent Internet improvement initiatives. Of the 227 remaining schools, 31 were unable to administer the online trial test in spring 2014, and 196 had to shut down other online activities to administer the test. The 227 bids total an estimated $22 million to build Internet infrastructure to the schools, with a median bid of about $3,000. The lowest bid was $600 and highest bid was $1.4 million. Based on data provided by the HSN, about 63,000 students—including about 35,000 test takers in grades 3 through 8 and grade 11—attend the 227 schools. (All these numbers are initial estimates, as the contracts have not yet been finalized. The numbers likely will change in the coming months. For example, schools could still decide they do not want to accept the ongoing service costs associated with the bid.)
Very Fast Internet Speeds Expected at Schools Receiving New Infrastructure. The HSN indicates that about 95 percent of schools benefiting from BIIG likely will receive fiber–optic Internet infrastructure. Fiber–optic Internet infrastructure supports the fastest Internet speeds available. Correspondingly, the HSN indicates 90 percent of schools will have speeds around one gigabit per second—a speed that could support 50,000 students taking the SBAC tests at once. The HSN indicated that the cost for infrastructure that supports very fast speeds was not markedly different from the costs for infrastructure that supports slower speeds. (We discuss in more detail different types of Internet infrastructure and the speeds necessary to administer online tests in the article “An Overview of Internet in Schools,” available on our website.) The HSN indicates that they aim to have the new Internet infrastructure in place for the spring 2015 tests.
HSN Did Not Receive Bids for 64 Eligible Schools. Of these schools, nine were unable to administer the online trial test in spring 2014, and 55 had to shut down other online activities during the time of testing. As shown in Figure 24, schools that did not receive bids mostly are located in rural counties in northern California. Counties with five or more schools not receiving bids include Humboldt (16), Trinity (6), and Tehama (5). The HSN has indicated that because these sites received no bids, CENIC plans to use the remaining BIIG money (currently estimated to be $4.7 million) to approach specific commercial providers directly to request they build to these sites.
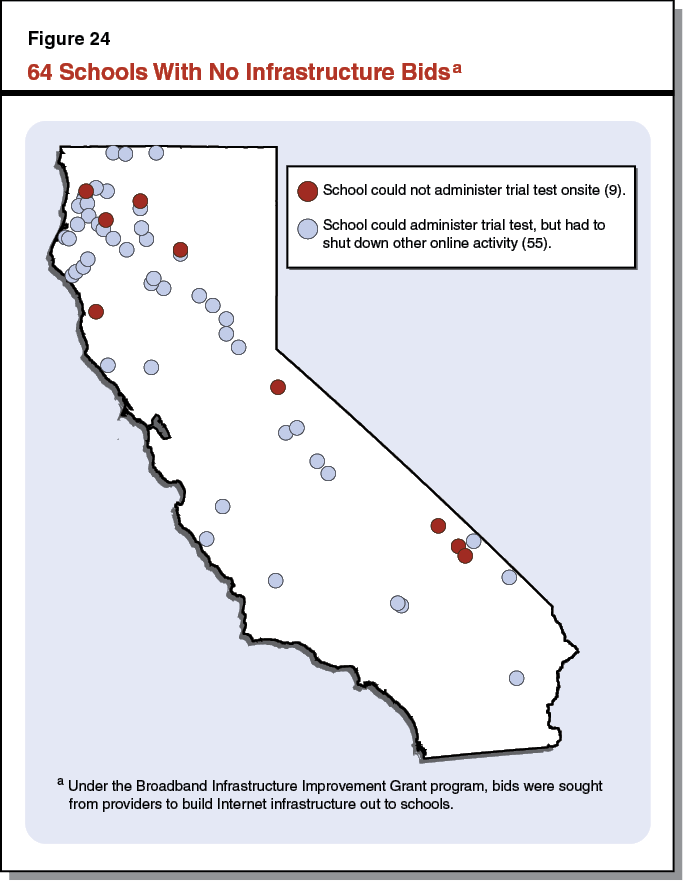
Provides $100 Million to Administer Second Round of BIIG. The Governor proposes a second round of grants in 2015–16 to address remaining sites that have difficulty administering online tests. The proposal includes the same eligibility and priority ranking criteria as last year. That is, schools that are unable to give the test onsite will be given first priority for the grants, and schools that can give the test but need to shut down other Internet activities will be given second priority.
Also Provides $8.8 Million for Second Round From HSN’s Budget Reserve. In addition to the $100 million in one–time Proposition 98 spending, the Governor proposes using $8.8 million of HSN’s budget reserve for the grants. The HSN indicates that it built up a reserve over time because the costs of Internet services have continually gone down, but its annual grant award has been stable. (The HSN’s operating budget was $15.5 million in 2013–14, including $8.3 million in Proposition 98 funding, $6.4 million in state and federal subsidies, and less than $1 million from other sources.) The Governor’s proposal would reduce the HSN reserve from $14.3 million (the projected 2014–15 reserve) to $5.5 million—or 38 percent of their annual budget. The Governor proposes to allow the HSN to keep the $5.5 million reserve for two reasons. First, he asserts that a reserve is necessary in case federal Internet subsidies that help fund HSN do not materialize or arrive late. Second, he expects HSN to set aside $2.5 million annually from its reserve each year for four years in order to replace $10 million in equipment, such as circuits between COEs and the CENIC backbone, in 2018–19.
Virtually No Schools Left That Are Unable to Administer Online Tests. The state currently is aware of only nine schools that are not able to administer the tests online. We estimate that these schools serve about 60 test–taking students (students in grades 3 through 8 and grade 11). The additional 55 schools with eligibility can administer the tests online but must reduce other Internet activities. These schools enroll about 2,000 test–taking students.
Cost Per Student to Upgrade Remaining Schools Unknown but Could Be Significant. The total cost to enable all the remaining eligible schools to administer the test is unknown since no bids were received for them. The HSN has obtained some cost information, however, for a few of the remaining sites. According to CDE, the cost to connect one small school with an estimated five test–taking students would total about $10 million—or $2 million per student. The HSN indicates that as CENIC starts to negotiate with commercial providers to address the remaining eligible sites, more cost information likely will become available.
Alternative Ways to Administer Tests Far Less Costly. For the remaining schools that cannot give the test online, three options exist. All of these options likely would cost a fraction of what it would cost to upgrade Internet infrastructure. First, schools with slow connections could test a small number of students (or even one student) at a time to reduce congestion on their Internet connection. (According to SBAC estimates, about 50 elementary–age students could be tested in the twelve–week testing period if they were tested one at a time.) Second, both the schools with very slow connections and the schools with no connection could bus students to other sites in their region with faster Internet speeds, such as libraries, COEs, or community college campuses. A third option in the short term for schools that do not want to bus students to another location is to administer the tests with pencil and paper. (According to SBAC, the paper and pencil tests assess the same content as the online version; the consortium is researching whether the results are comparable across the two assessment modes.)
State Lacks Sufficient Information Regarding Expenditures Required to Run HSN. State law requires the lead education agency overseeing the HSN grant—currently, ICOE—to conduct an annual audit of HSN. The ICOE is required to submit annual audit findings to the Superintendent of Public Instruction, Governor, and Legislature by December 15 of each year. The ICOE asserts that this requirement is fulfilled as part of the general audit it obtains on its county office’s operations. The general COE audit, however, does not provide financial information specific to the HSN. For instance, the audit dated June 30, 2014 consists of two paragraphs describing HSN and one paragraph with audit findings that simply state that ICOE “met the requirements, duties, and conditions of the grant as specified with no reportable audit findings for the fiscal year.” No further information is provided.
Current Level of HSN Reserve Excessive but More Information Needed to Determine Appropriate Operating and Reserve Levels. The HSN’s budget reserve in 2013–14 totaled 110 percent of its annual expenditures. In comparison, the median reserve for school districts with annual expenditures similar to HSN in 2013–14 was 22 percent of General Fund expenditures. Moreover, HSN has experienced less fiscal uncertainty than school districts in the recent past because its state appropriation has remained stable from year to year. This suggests HSN’s current reserve level is much too high. The Governor likewise finds the reserve too high and would reduce it to a level he believes sufficient to manage the timing of HSN’s federal Internet subsidy reimbursements and fund equipment replacement. Determining an appropriate reserve level for HSN is difficult, however, without more detailed expenditure information.
Recommend Legislature Not Fund New BIIG Schools With Extraordinary Costs. Given the cost per student to improve Internet infrastructure at the remaining BIIG schools likely would be significant, we recommend the Legislature carefully consider the costs associated with the grants prior to committing any additional BIIG funds. For instance, if HSN were to determine building or upgrading infrastructure at a school with five test–taking students would cost $10 million in BIIG funds, the Legislature would have to grapple with whether that $10 million could be better spent on other education programs benefitting a greater number of students, as well as whether the significantly lower–cost alternatives (such as busing students) were more appropriate. As more information becomes available from HSN in the spring on the costs to install infrastructure at the remaining schools, the Legislature could consider using this information to set a maximum per–pupil BIIG allotment for the remaining eligible schools. (Alternatively, it might learn that all the associated cost estimates for the remaining schools are so high that the BIIG approach is not justified.) Because only about 60 pupils remain who are unable to take the test online at their school, even setting an extremely high per–pupil maximum would mean not spending most of the Governor’s proposed BIIG amount. This funding would be freed up for other one–time Proposition 98 purposes.
Strengthen State Oversight of HSN Expenditures. We recommend the Legislature modify state law to require the HSN audit to be a distinct audit from the general audit of the lead agency operating the program, beginning in December 2015. We also recommend requiring the audit to include an itemized list of expenditures and revenues, with a line item specifying any reserve.
Suspend New Budget Appropriations, Require HSN to Use Up to $8.3 Million of Its Reserve in 2015–16 for Program Costs. We recommend the Legislature require HSN to use up to $8.3 million of its budget reserve for its 2015–16 operations instead of appropriating an additional $8.3 million (Proposition 98 General Fund) for additional BIIG. The $8.3 million that would have gone to the HSN would be freed up for other one–time Proposition 98 purposes.
Re–Evaluate HSN Reserve After Improved Audit Released. We estimate that HSN still would have about $6 million in its reserve even if it used $8.3 million of the reserve to operate in 2015–16. Because the state currently lacks sufficient information to determine an appropriate operating and reserve level for HSN, we recommend the Legislature re–evaluate the HSN annual appropriation level and reserve level in 2016–17, using information from the more detailed audit we recommend above. Based on the better budget information, the Legislature could resize HSN’s annual grant moving forward. Moreover, were the Legislature to determine a reserve is not needed, it could revert the remaining reserve to the Proposition 98 Reserve Account, thereby freeing up those funds for other one–time Proposition 98 purposes.
The Governor’s budget includes two major proposals related to education mandates. The Governor proposes to (1) pay $1.5 billion toward the backlog of unpaid K–12 and community college mandate claims and (2) add one new mandate regarding whooping cough immunization records, along with $1.7 million, to the K–12 mandates block grant. (As we discuss in the nearby box, the Governor does not propose a COLA to the K–12 and community college mandates block grants.) Below, we provide background on education mandates, assess the Governor’s two major proposals, and make associated recommendations.
Governor Does Not Propose a Cost–of–Living Adjustment (COLA) for Mandates Block Grants. The purpose of a COLA is to maintain the purchasing power of a program as prices rise due to inflation. The Governor does not propose a COLA, however, for the mandates block grants. In contrast, the Governor’s budget provides a 1.58–percent COLA for several K–12 categorical programs, including special education and child nutrition.
Recommend Applying a COLA. We recommend the Legislature provide a COLA to the mandates block grants. Applying a 1.58 percent COLA would cost $4 million ($3.5 million for the K–12 block grant and $513,000 for the community college block grant). Applying a COLA would better reflect the cost of performing mandated activities and ensure purchasing power is maintained. Without a COLA, the value of the block grant will erode over time, which might cause some school districts, county offices of education, and community colleges to stop participating in the block grant and return to filing separate reimbursement claims—arguably a disadvantage both for them and the state. (The estimates reflected above assume the addition of the whooping cough mandate and the removal of the seventh grade hepatitis B requirement from the K–12 block grant. These adjustments have a small effect on the cost of providing a COLA to this block grant.)
Constitution Requires the State to Reimburse Local Governments for Mandated Activities. Proposition 4, passed by California voters in 1979, requires the state to reimburse local governments for the cost of a new program or a higher level of service it imposes upon them. Under a process subsequently established in state law, the Commission on State Mandates (CSM) determines if a new law, regulation, or executive action constitutes a reimbursable state mandate for local governments. In the area of education, a local government is defined as a school district, COE, or community college district—collectively referred to as local educational agencies (LEAs). Charter schools are not considered local governments under mandate law and therefore are ineligible for reimbursement.
State Budget Currently Includes 57 Education Mandates. As shown in Figure 25, the state budget currently includes 42 mandates that apply to K–12 education and 15 that apply to community colleges. (Of these mandates, seven apply to K–12 education and community colleges.) The state has suspended an additional 17 education mandates (five that apply only to K–12 education, five that apply only to community colleges, and seven that apply to both). LEAs are not required to perform the activities associated with suspended mandates and, consequently, the state is not required to reimburse them.
Figure 25
Education Mandatesa
|
K–12 Education
|
|
|
Active (42)
|
|
Academic Performance Index
|
Interdistrict Attendance Permits
|
|
Agency Fee Arrangements
|
Juvenile Court Notices II
|
|
AIDS Prevention / Instruction
|
Law Enforcement Agency Notificationc
|
|
Annual Parent Notificationb
|
Notification of Truancy
|
|
CalSTRS Service Credit
|
Open Meetings/Brown Act Reform
|
|
Caregiver Affidavits
|
Parental Involvement Programs
|
|
Charter Schools I, II, III, and IV
|
Physical Performance Tests
|
|
Child Abuse and Neglect Reporting
|
Prevailing Wage Rate
|
|
COE Fiscal Accountability Reporting
|
Public Contracts
|
|
Collective Bargaining
|
Pupil Suspensions and Expulsions I and II
|
|
Comprehensive School Safety Plans
|
Pupil Health Screenings
|
|
Criminal Background Checks I and II
|
Pupil Promotion and Retention
|
|
Developer Fees
|
Pupil Safety Notices
|
|
Differential Pay and Reemployment
|
School Accountability Report Cards
|
|
Expulsion of Pupil: Transcript Cost for Appeals
|
School District Fiscal Accountability Reporting
|
|
Financial and Compliance Audits
|
School District Reorganization
|
|
Graduation Requirements
|
Teacher Notification: Pupil Suspensions/Expulsionsd
|
|
Habitual Truants
|
The Stull Act
|
|
High School Exit Examination
|
Threats Against Peace Officers
|
|
Immunization Records (includes Hepatitis B)
|
Uniform Complaint Procedures
|
|
Intradistrict Attendance
|
Williams Case Implementation I, II, and III
|
|
Suspended (12)
|
|
Absentee Ballots
|
Mandate Reimbursement Process I and II
|
|
Brendon Maguire Act
|
Physical Education Reports
|
|
County Treasury Withdrawals
|
Pupil Residency Verification and Appeals
|
|
Grand Jury Proceedings
|
Removal of Chemicals
|
|
Health Benefits for Survivors of Peace Officers / Firefighters
|
School Bus Safety I and II
|
|
Law Enforcement Sexual Harassment Training
|
Scoliosis Screening
|
|
Community Colleges
|
|
|
Active (15)
|
|
Agency Fee Arrangements
|
Minimum Conditions for State Aid
|
|
Cal Grants
|
Open Meetings/Brown Act Reform
|
|
CalSTRS Service Credit
|
Prevailing Wage Rate
|
|
Collective Bargaining
|
Public Contracts
|
|
Community College Construction
|
Reporting Improper Governmental Activities
|
|
Discrimination Complaint Procedures
|
Threats Against Peace Officers
|
|
Enrollment Fee Collection and Waivers
|
Tuition Fee Waivers
|
|
Health Fee Elimination
|
|
|
Suspended (12)
|
|
Absentee Ballots
|
Law Enforcement Jurisdiction Agreements
|
|
Brendon Maguire Act
|
Law Enforcement Sexual Harassment Training
|
|
County Treasury Withdrawals
|
Mandate Reimbursement Process I and II
|
|
Grand Jury Proceedings
|
Sex Offenders: Disclosure by Law Enforcement
|
|
Health Benefits for Survivors of Peace Officers / Firefighters
|
Sexual Assault Response Procedures
|
|
Integrated Waste Management
|
Student Records
|
Four Additional Mandates in Various Phases of the Filing and Determination Process. The CSM recently found two new state requirements enacted in recent years to be mandates: a 2010 law requiring school districts, COEs, and charter schools to verify immunization records for whooping cough and a series of laws enacted in 2009 and 2010 in response to the federal Race to the Top grant program. (The Governor’s budget recognizes only the whooping cough mandate, as the Race to the Top mandate is still pending a cost estimate from CSM.) Another mandate related to behavioral intervention plans is not included in the state budget because recent legislation enacted changes to some of the associated requirements, and the claiming instructions have not been modified to reflect the changes. In addition, in December three school districts and one COE filed a request asking CSM to determine that California’s new system of standardized testing is a mandate. Based on the claimants’ initial cost data, the standardized testing requirements could be one of the costliest state mandates ever (if CSM determines it to be a mandate).
State Traditionally Paid for Mandates Through Claims Process. Under the state’s traditional mandate reimbursement process, LEAs submit claims seeking reimbursement for the actual cost of performing the mandated activities. In some cases, CSM instead has approved a formula—known as a reasonable reimbursement methodology (or RRM)—that claimants must use when determining how much they are owed by the state. The State Controller’s Office (SCO) pays claims from funds appropriated in the state budget. The SCO also audits some claims and reduces payments accordingly.
State Has a Sizeable Backlog of Unpaid Claims. The SCO reports that, as of October 2014, the state had a backlog of unpaid education mandate claims totaling $5.7 billion, including $5.2 billion for K–12 mandates and $500 million for community college mandates. This overstates the amount of claims that the state actually will have to pay to LEAs because it does not take into account a $450 million payment the state made toward the backlog in the 2014–15 budget ($400 million for K–12 mandates and $50 million for community college mandates). The SCO report also might overstate the backlog because it includes costs for several mandates the state in recent years has required LEAs to cover using other funds provided in the state budget. For example, the state in 2010 began requiring school districts and COEs to pay for a mandate related to behavioral intervention plans using funds provided in the state budget for special education. We estimate about $940 million in claims reported by SCO potentially can be offset with other pots of Proposition 98 funds, though the state currently is in litigation over using these other pots of funding to pay for some of these claims. Additionally, we estimate SCO will disallow about $170 million in claims that are part of the backlog because of audits. Factoring in the $450 million payment the state is making in 2014–15, the $940 million the state might not ultimately owe, and our estimated $170 million in audit reductions, we estimate the backlog is about $4.2 billion instead of the $5.7 billion reported by SCO.
State Created Block Grant in 2012–13 to Address Concerns With Reimbursement Process. Two longstanding concerns the state has had with the traditional claims process are that (1) claimed costs tend to vary greatly by LEA and (2) paying claimed costs provides no incentive for LEAs to perform activities as efficiently as possible. Due to these concerns, the state created an alternative method for reimbursing LEAs in the 2012–13 budget. In lieu of submitting claims for mandates, LEAs can choose to participate in a block grant and receive a per–student grant intended to cover the annual cost of all state–mandated activities included in the block grant. School districts and COEs can participate in a K–12 block grant, while community colleges have a separate block grant. The state also allows charter schools to access the K–12 block grant because they must perform some mandated activities, though they receive a lower per–student grant because not all mandates apply to them. The K–12 block grant currently totals $218 million, while the block grant for community colleges totals $32 million.
Most LEAs Choosing to Participate in Block Grant. As shown in Figure 26, 93 percent of K–12 agencies (charter schools, school districts, and COEs) elected to participate in the block grant during 2014–15, representing 95 percent of K–12 ADA. For community colleges, 97 percent of districts—representing 98 percent of community college FTE students—elected to participate in the block grant during 2014–15.
Figure 26
Block Grant Participation
2014–15
|
|
Number
Participating
|
Total
Number
|
Percent
Participating
|
Percent of Students Covereda
|
|
K–12 Education
|
|
|
|
|
|
Charter schools
|
1,063
|
1,078
|
99%
|
98%
|
|
School districts
|
831
|
947
|
88
|
95
|
|
County offices of education
|
47
|
58
|
81
|
91
|
|
Totals, K–12 Education
|
1,941
|
2,083
|
93%
|
95%
|
|
Community Colleges
|
70
|
72
|
97%
|
98%
|
Governor Proposes $1.5 Billion Payment Toward Backlog. The Governor proposes to make a one–time payment of $1.1 billion toward the K–12 backlog and $379 million toward the community college backlog in 2015–16. Consistent with prior backlog payments made by the state, the Governor proposes to distribute funding on the basis of ADA and FTE students. Because the payments would be made for expenses incurred by LEAs many years ago, the funds provided today effectively could be used for any purpose. The Governor suggests school districts, COEs, and charter schools use the payments to implement new academic content standards, while he encourages community colleges to use them for deferred maintenance, instructional equipment, and other one–time costs.
Proposal Treats All LEAs Similarly, Provides Incentives to Control Costs. Paying down the backlog on a per–student basis means that all LEAs receive a proportionate amount of funding, regardless of their past mandate claiming practices. This ensures that LEAs are not disadvantaged if they did not submit claims in the past due to the complexity of the claiming process or if they performed mandated activities at a lower cost compared to other LEAs. The per–student approach also reduces the incentive for LEAs in the future to inflate claims or perform state–mandated activities in an unreasonably costly manner.
Some Payments Would Not Reduce Backlog. Because the Governor proposes to distribute funding to charter schools, which are ineligible to submit claims and therefore have no unpaid balances, these payments would not count toward reducing the backlog. In addition, some school districts, COEs, and community colleges might not have unpaid claims or they might have less in unpaid claims than the payments they receive through the per–student distribution. Any such “leakage” also would not reduce the backlog. (The SCO indicates that it might be able to provide an estimate of the expected leakage in the coming months.) Taking these factors into account, we estimate the $1.5 billion payment would reduce the backlog by about $1.3 billion, from $4.2 billion to $2.9 billion.
Recommend Adopting Governor’s Proposal. The Governor’s proposal to pay down a portion of the backlog is consistent with the state’s past approach of using one–time revenues to retire outstanding obligations. Though the backlog could be reduced more quickly if payments were targeted to actual claims, we believe the Governor’s approach of paying down the backlog on a per–student basis helps address the state’s longstanding concerns over uneven mandate claiming practices.
Recommend Requiring SCO to Report on Backlog Reductions. We recommend the Legislature require SCO to report to the Governor and the Legislature on estimated leakage associated with the 2014–15 and 2015–16 payments, by LEA type. We recommend a due date of November 1, 2016 for the report on the 2014–15 backlog payments and a due date of November 1, 2017 for the 2015–16 payments. This information would help the Legislature evaluate options for paying down the remainder of the mandates backlog.
All 50 States Require Schools to Verify Certain Student Immunization Records. All 50 states have laws that require schools to verify that children have been immunized for certain contagious diseases prior to being admitted as students. The exact immunization requirements vary by state. All states also allow exemptions from immunization requirements for medical reasons (for example, a medical condition that might result in an adverse reaction to a vaccination). Exemptions for religious reasons are allowed in 48 states and, among these states, 18 of them (including California) also allow personal belief exemptions. Starting in 2014, families who opt out of California school immunization requirements because of personal beliefs must provide a signed note from a doctor indicating they have discussed the risks and benefits of immunization with their medical provider.
California Requires Immunization Verifications for Several Diseases. In 1977, the state required public and private K–12 schools to verify immunization for the following diseases before enrolling a child for the first time: polio, measles, diphtheria, whooping cough, and tetanus. The state also required these schools to maintain records of students’ immunization status and periodically report to the state on the immunization status of new students. In 1979, the state added mumps and rubella immunization requirements. The state enacted a hepatitis B immunization requirement for kindergartners in 1995 and seventh graders in 1997. Also in 1995, the state expanded existing requirements for record–keeping and reporting. It began requiring school districts, COEs, charter schools and private schools to notify parents of immunization requirements, refer parents to an appropriate medical provider, and exclude nonimmunized and nonexempted students for purposes of calculating school attendance (which is used to calculate state funding).
Legislature Adds Whooping Cough Immunization Requirement for Seventh Graders in 2010. California experienced a whooping cough outbreak in 2010 in which 10 infants died. Data suggest personal belief exemptions and older children or adults who lacked immunity may have contributed to the outbreak. In the aftermath of the outbreak, the state enacted Chapter 434, Statutes of 2010 (AB 354, Arambula), which mandated whooping cough vaccinations on an ongoing basis for all students entering the seventh grade and a one–time basis for all eighth through twelfth graders. The intent was to ensure all older students in the state were immunized the year the mandate took effect (2011–12). Starting in 2012–13, only seventh graders would have to be immunized to ensure students in grades seven and up were immunized. While prior law already required all students entering school for the first time to be immunized for whooping cough, Chapter 434 addressed the particular concern that students who are vaccinated in elementary school may lose their immunity by middle or high school, putting themselves and younger children at risk. The Centers for Disease Control and Prevention and the American Academy of Pediatrics both recommend a single dose of whooping cough vaccine for middle–school age children in addition to the series of whooping cough vaccinations recommended for younger children. (Every state except New York requires students to be immunized for whooping cough prior to entering school for the first time. A large majority of states also require students to be immunized for whooping cough again before entering middle school.)
Legislature Also Eliminates Hepatitis B Requirement for Seventh Graders. Chapter 434 also eliminated the requirement that school districts, COEs, charter schools, and private schools confirm immunization for hepatitis B for entering seventh graders, which was required beginning in 1999. The Legislature deleted this requirement because the kindergarten mandate for hepatitis B had been around long enough (since 1997) that any entering seventh grader would have already been immunized against hepatitis B. Unlike the whooping cough vaccine, the hepatitis B vaccine can confer immunity for 20 years or longer.
CSM Determines Whooping Cough Vaccination Requirement Is a Mandate. The CSM determined in 2013 that the new ongoing whooping cough requirement for seventh graders and the one–time requirement for students in grades 8 through 12 were reimbursable state mandates. Specifically, the commission found that school districts and COEs were required to perform the following activities: (1) confirm that students entering the designated grades were immunized for whooping cough or had received an allowed exemption (medical, religious, or personal belief), (2) conditionally admit those students not immunized for up to 10 school days pending proof of immunization or exemption, and (3) exclude from school students unable to produce the proof or exemption within 10 school days. School districts and COEs could claim reimbursement for grades 7 through 12 for the 2011–12 school year. Thereafter, they could submit annual claims only for entering seventh graders.
CSM Has Not Redetermined Hepatitis B Mandate. When the Legislature changes statute to eliminate part or all of a mandated activity, local governments, the Department of Finance, SCO, or other affected state agencies can file a request for a new mandate decision with CSM. Though the Legislature eliminated part of the hepatitis B mandate in 2010, no state or local agency to date has requested CSM to issue a new decision on the mandate.
School Districts and COEs Claim $8.6 Million for Whooping Cough Mandate in 2011–12 and 2012–13. The SCO received 397 claims from 228 school districts and COEs for the new whooping cough mandate for 2011–12 and 2012–13. (Charter schools must adhere to the immunization requirements, but, as mentioned earlier, are not eligible to submit mandate claims.) For 2011–12 and 2012–13, claims totaled $6.9 million and $1.7 million, respectively. The higher total for 2011–12 reflects the higher immunization requirements in place that year. Claims data are not yet available for 2013–14 or 2014–15. Claims from 2011–12 through 2014–15 will add to the backlog of unpaid mandate claims.
School Districts and COEs Claim $1.7 Million for Seventh Grade Hepatitis B Requirement After Requirement Repealed. According to SCO, school districts and COEs claimed about $1.5 million in 2011–12 and about $200,000 in 2012–13 for the seventh grade hepatitis B requirement. The sharp decrease likely was the result of many school districts and COEs deciding to participate in the block grant in 2012–13, the first year they could do so. School districts and COEs that participate in the block grant are not eligible to submit claims.
California Experiences Another Whooping Cough Epidemic in 2014. The state experienced another spike in whooping cough incidence in 2014, recording more than 9,900 cases (compared to 9,200 in 2010, the last major outbreak). Counties with higher rates of nonmedical exemptions, including San Diego, Sacramento, Sonoma, and Marin, had a higher number of cases per capita than the rest of the state.
Adds Whooping Cough Mandate and $1.7 Million to the K–12 Block Grant. The proposed $1.7 million increase is based on CSM’s statewide cost estimate, with a slight downward adjustment to reflect costs the Governor believes SCO likely will disallow due to audits.
School Immunization Mandates Proven to Be Effective. School immunization requirements have been shown in multiple studies to increase vaccination rates and significantly reduce the incidence of vaccine–preventable diseases among affected populations. For example, studies found the incidence of measles was 50 percent to 90 percent lower in states that adopted school immunization requirements in the 1970s. According to the California Department of Public Health, 98 percent of seventh graders in the state were vaccinated for whooping cough in 2011–12, the first year of the requirement. Although the proportion of seventh graders vaccinated for whooping cough dipped slightly to 97 percent in 2012–13 and 2013–14 due to an increase in nonmedical exemptions, 98 percent were vaccinated in 2014–15, following the passage of stricter requirements for nonmedical exemptions.
Despite Increase in Cases, Mandate Likely Reduced the Severity of 2014 Epidemic. Although the number of whooping cough cases in 2014 was higher than the total in 2010, before the new mandate was in place, the requirement resulted in additional middle and high school students receiving the vaccination. Students in the age group that had most recently received the vaccine (11 to 13 year olds) had lower infection rates, thereby also reducing the risk of infecting others.
Statewide Costs for Whooping Cough Mandate Likely Exceed CSM Estimate. The CSM’s statewide cost estimate of $1.7 million for the seventh grade whooping cough requirement is likely an underestimate because it only reflects the 172 school districts and COEs that submitted claims in 2012–13. Based on a median cost of $9 per student for school districts and COEs that submitted claims in 2012–13 and the number of seventh grade students in California public schools, we estimate the statewide cost of the seventh grade whooping cough requirement in 2015–16 is $4.5 million.
Block Grant Still Includes Funding for Eliminated Seventh Grade Hepatitis B Requirement. The block grant includes funding for the entire cost of the hepatitis B mandate. Determining the exact amount of funding in the block grant associated with the seventh grade hepatitis B requirement requires certain assumptions. When the block grant was created, total block grant funding roughly corresponded to total claims. For this reason, we believe the state can reasonably assume that the portion of the block grant associated with the seventh grade hepatitis B requirement is similar to the amount of claims submitted for the requirement when the block grant was created. This amount is $1.5 million.
Add Whooping Cough Mandate and $4.5 Million to K–12 Block Grant. Because the mandate addresses a critical statewide public health concern, we recommend adopting the Governor’s proposal to add it to the block grant. We recommend, however, increasing the block grant by $4.5 million—$2.8 million more than proposed by the Governor—to reflect more accurately the costs of the mandate.
Remove $1.5 Million Associated With Seventh Grade Hepatitis B Requirement From K–12 Block Grant. We recommend removing $1.5 million from the block grant to reflect the elimination of the seventh grade hepatitis B requirement. We also recommend the Legislature direct the Department of Finance to request a new mandate decision from CSM for the hepatitis B immunization mandate.
The Governor groups a number of separate budget proposals under the umbrella of workforce education and training and links them to a broader effort to coordinate the state’s workforce investments. To help the Legislature assess the Governor’s proposals as well as the broader coordination effort, we begin with a brief overview of the state’s workforce development system. We then provide an overview of the Governor’s package of workforce proposals and lay out the issues the state must address if it wants to move toward a better coordinated system. Lastly, we describe each of the Governor’s specific workforce education and training proposals—providing relevant background, our assessment, and recommendations.
Below, we provide an overview of the state’s workforce development system as it exists currently. We then briefly describe the state’s existing strategic workforce plan.
Workforce Services Range From Job Search Assistance to Advanced Technical Training. The state operates numerous programs that provide a wide variety of workforce services. For example, some programs offer job search services that help unemployed or underemployed individuals connect with openings in the job market. Others offer career planning services that help individuals learn about education and training opportunities and develop plans for improving their future employment prospects. Still others directly provide workforce education and training, such as courses leading to an industry–recognized certificate or on–the–job training in an apprenticeship program.
Five State Agencies Provide Workforce Services. Five state agencies offer the bulk of workforce services in the state. The California Community Colleges (CCC) and the California Department of Education (CDE) are the state’s main providers of workforce education and training, which they typically refer to as adult education and career technical education (CTE). Three other state agencies—the Department of Social Services (DSS), the Employment Development Department (EDD), and the Department of Rehabilitation (DOR)—provide various workforce services that we broadly refer to as employment services. Employment services provided by these agencies tend to focus on reducing barriers to employment for various specific populations, and can include connecting participants to workforce education and training provided by public and private entities.
California Spends $5.6 Billion Annually on Workforce Services. As shown in Figure 27, spending on workforce development is spread across many programs. Proposition 98 General Fund is the primary fund source for workforce education and training programs provided through CCC and CDE. In contrast, federal funding is the primary fund source for employment services provided through DSS, EDD, and DOR. In 2014–15, the state is spending $3.1 billion from the General Fund and $2.5 billion in federal funds for the identified workforce programs.
Figure 27
California’s Major Workforce Development Programs
2014–15 (In Millions)
|
|
State General Fund
|
All Other Fund Sourcesa
|
Total
|
|
California Community Colleges (CCC)
|
|
|
|
|
Apportionmentsb
|
$1,650
|
—
|
$1,650
|
|
Economic Development Program
|
73
|
—
|
73
|
|
Subtotals
|
($1,723)
|
(—)
|
($1,723)
|
|
California Department of Education (CDE)
|
|
|
|
|
Regional Occupational Centers and Programs (ROCP)c
|
$384
|
—
|
$384
|
|
Adult Schoolsc
|
350
|
—
|
350
|
|
Adult Education and Family Literacy (WIA Title II)
|
—
|
$86
|
86
|
|
Project Workability
|
40
|
—
|
40
|
|
California Partnership Academies
|
21
|
—
|
21
|
|
Adults in Correctional Facilities
|
15
|
—
|
15
|
|
Youth Career Connect
|
—
|
12
|
12
|
|
Specialized Secondary Programs
|
5
|
—
|
5
|
|
Agriculture Incentive Grants
|
4
|
—
|
4
|
|
Subtotals
|
($819)
|
($98)
|
($917)
|
|
Joint CDE and CCC Programs
|
|
|
|
|
Career Pathways Trust
|
$250
|
—
|
$250
|
|
Carl D. Perkins
|
—
|
$123
|
123
|
|
CTE Pathways Program
|
48
|
—
|
48
|
|
Apprenticeship
|
23
|
—
|
23
|
|
Subtotals
|
($321)
|
($123)
|
($444)
|
|
Department of Social Services
|
|
|
|
|
CalWORKs Employment Services
|
172
|
1,225
|
1,397
|
|
CalFresh Employment and Trainingd
|
—
|
56
|
56
|
|
Subtotals
|
($172)
|
($1,281)
|
($1,453)
|
|
Employment Development Department
|
|
|
|
|
Adult, Youth, and Dislocated Worker Services (WIA Title I)
|
—
|
$393
|
$393
|
|
Wagner–Peyser Employment Services (WIA Title III)
|
—
|
130
|
130
|
|
Employment Training Panel
|
—
|
72
|
72
|
|
Veterans Workforce Programs
|
—
|
19
|
19
|
|
Other
|
—
|
37
|
37
|
|
Subtotals
|
(—)
|
($651)
|
($651)
|
|
Department of Rehabilitation
|
|
|
|
|
Vocational Rehabilitation (WIA Title IV and Other)
|
$58
|
354
|
412
|
|
Totals
|
$3,093
|
$2,507
|
$5,600
|
Between 3 Million and 6 Million People Annually Receive Workforce Services. Determining the number of people who access the state’s various workforce services is difficult because various agencies collect information differently. For example, workforce education and training programs tend to report participation in terms of annual enrollment, while other programs that have less stable enrollment patterns, such as the California Work Opportunity and Responsibility to Kids program, report participation in terms of average monthly enrollment. Moreover, some individuals access services from multiple agencies at the same time, and unduplicated counts of participation are not always available. Given these limitations and based on available data from multiple agencies, we estimate that between 3 million and 6 million people annually access state workforce services.
More Than 2 Million Access State–Supported Workforce Education Programs Annually. No single agreed–upon definition of workforce education exists. For our analysis, we use a relatively narrow definition of workforce education that includes basic skills instruction, citizenship and English as a second language, career technical education, apprenticeship programs, and education programs for adults with disabilities. Based on this definition, we estimate more than 2 million Californians receive some form of state–supported workforce education annually. This estimate relies on CCC and CDE enrollment data.
California Workforce Investment Board Entrusted to Create State Workforce Plan. The California Workforce Investment Board (CWIB), created to implement the provisions of the federal Workforce Investment Act of 1998 (WIA), is responsible for setting statewide policy for workforce development. The CWIB consists of 53 members appointed by the Governor. The members represent a broad group of stakeholders, including the Legislature, business, labor, education, and corrections. As a condition of receiving federal WIA funding, the CWIB must prepare a strategic workforce plan every five years.
Strategic Workforce Plan Intended to Guide All Workforce Spending. Under state law, the strategic workforce plan is intended to serve as a framework for the development of policy, spending, and operation of all workforce development programs in the state—both federally and state funded—including workforce education and training.
Plan Has Multiple Goals. The state’s strategic workforce plan lays out goals in four key areas to guide the activities of the workforce system:
- Business and Industry. Meet the workforce needs of high demand sectors of the state and regional economies.
- Adults. Increase the number of Californians who obtain a marketable and industry–recognized credential or degree.
- Youth. Increase the number of high school students who graduate prepared for postsecondary vocational training, further education, and/or a career, with emphasis on at–risk youth and those from low–income communities.
- System Alignment and Accountability. Support system alignment, service integration, and continuous improvement using data to support evidence–based policymaking.
Provides $827 Million in State Funding for Package of Workforce Education and Training Proposals. As summarized in Figure 28, the Governor provides $827 million (Proposition 98 General Fund) for four workforce efforts. The largest proposal is $500 million in ongoing support for adult education provided through a recently established regional consortia program. The second largest proposal is $250 million each year for three years for a new CTE grant program for secondary schools. The third proposal is $48 million to extend for one year an existing program supporting CTE collaboration among schools, CCC, and businesses. The fourth proposal is $29 million to restore funding for existing apprenticeship programs to pre–recession levels and create new apprenticeships in high–demand occupations. (In addition to the $827 million, the Governor provides $49 million to increase the rate for certain workforce–related CCC noncredit courses to the credit rate, as required by 2014–15 budget legislation.)
Figure 28
Governor’s 2015–16 Workforce Education and Training Proposals
In Millions)
|
Program
|
Description of Proposal
|
Amount
|
|
Adult Education Block Grant
|
Funds 70 regional consortia of school districts, county offices of education, and community college districts to provide remedial and workforce–related instruction to adults. Ongoing.
|
$500
|
|
CTE Incentive Grant for Secondary Schools
|
Funds competitive grants for K–12 CTE programs. First of three annual installments.
|
250
|
|
CTE Pathways Program
|
Grants intended to improve CTE linkages between schools, community colleges, and local businesses. Extends program for one year.
|
48
|
|
Apprenticeship
|
Augments existing apprenticeship programs and creates new apprenticeships in high–demand occupations. Ongoing.
|
29
|
|
Total
|
|
$827
|
Governor Cites Better Coordination and Alignment With Labor Market as Goals for System. In the Governor’s Budget Summary, the Governor critiques the state’s existing workforce system, noting that the state lacks a coordinated approach to workforce development that links the efforts of various workforce entities. The Governor articulates his belief that “increasing the resources available and better targeting where they are used will help improve the skills of California’s workforce and better meet the demands of the growing economy.” He describes his package of budget proposals as a first step toward a better coordinated and aligned workforce system.
Coordination Is Essential to Maximizing System’s Value. Coordinating state workforce efforts involves guiding the various entities providing workforce services toward collectively meeting the state’s needs. A coordinated approach can help policymakers consider the system as a whole and develop policies and budgets that maximize its value. If providers’ efforts are complementary and coordinated while still adding unique value, their combined efforts may add up to more than what they could achieve independently. In contrast, if there is significant overlap of mission, duplication of effort, or lack of alignment across entities, their combined efforts will be less valuable—and more expensive—to the state.
Lack of Coordination Abounds. The state has a long way to go to achieve the vision of a well–coordinated system. The state’s current strategic workforce plan identifies several shortcomings with the existing system. The system suffers from being siloed by program, provider, and funding source. Data collection is particularly fractured in California, making it almost impossible to measure results from workforce investments meaningfully. Course and program articulation across providers sometimes is lacking, making it difficult for students to transition to the next level. This problem is especially pronounced for basic skills students, most of whom do not end up completing a certificate or degree.
Overlapping Regional Structures Result in Confusion and Duplication. California has numerous regional networks formed over time for varying purposes. For many workforce programs, 49 local workforce investment boards serve as regional stakeholder networks. The state has newly formed 70 regional consortia to coordinate adult education programs. CTE programs have formed different regional networks, often in response to grant criteria requiring that they include collaboration among secondary, postsecondary, employer, and economic development partners. The state also defines various “macro” regions based on industry employment patterns and workers’ commuting patterns. Most notably, CCC defines 15 economic regions and coordinates economic and workforce development activities within each region. Additionally, the CWIB currently is exploring ways to group the 49 local workforce boards into 6 or 7 macro regions for the purpose of improving their strategic planning and coordination. Separately, EDD analyzes employment demand within 8 macro regions to assist workforce planning efforts in those regions. Although different regions may serve different purposes, overlapping boundaries make it difficult for stakeholders to participate. An employer or education provider may straddle several local workforce investment areas and adult education regions, receive requests from multiple CTE providers to serve as a grant partner, and find itself unable to manage all the meetings and collaboration that active participation in these networks requires.
State’s Current Workforce Development Plan Has Integration Goal. This assessment of the state’s workforce system is not new—the state has been trying to forge a coherent system for years. The state’s current workforce plan takes significant steps by laying out a comprehensive strategy for the state’s workforce programs based on economic regions and industry sectors. The CWIB has convened leaders of the various agencies that administer workforce programs (and other stakeholders) to begin aligning their efforts within these regions and sectors.
New Federal Law Places Greater Emphasis on Integration of State’s Workforce Services. The federal government also has been requiring state workforce coordination for some time. A reauthorization of the WIA that takes effect July 1, 2015—seventeen years after its original authorization—significantly increases integration requirements. Similar to the state’s existing workforce plan, the new law emphasizes regional and sector–based strategies to break down silos among providers of workforce services. Figure 29 outlines key components of the new law, called the Workforce Innovation and Opportunity Act (WIOA).
Figure 29
Key Features of Federal Workforce Innovation and Opportunity Act (WIOA)
- Requires unified plan for all WIOA programs, including adult education, vocational rehabilitation, and employment services. States may optionally include other federal programs (such as Temporary Assistance for Needy Families and the Carl D. Perkins Vocational and Technical Education Act) in the unified plan.
|
- Places greater emphasis on alignment between local workforce program areas, labor markets, and economic development at the regional level.
|
- Encourages career pathway and sector partnership approaches that emphasize transitions from basic skills to postsecondary education and employment.
|
- Focuses funding on out–of–school youth and low–income adults.
|
- Requires a single set of accountability measures for WIOA programs.
|
Statewide Working Group Developing New Integrated Plan. Although the federal regulations for implementing the new law have not been finalized, the CWIB has convened a work group on WIOA implementation—chaired by CCC’s vice chancellor for workforce and economic development—to begin revising the state’s workforce plan to meet new WIOA requirements. Because the state’s existing plan in many ways is consistent with WIOA, this effort will be a continuation of work begun under the current plan. One of the significant changes, according to working group members, will be a greater commitment to use data more meaningfully. For example, the group currently is conducting data analyses to help them better define the state’s major economic regions. The group intends to extend this approach to the local and regional level to help workforce–service providers use data to align supply with demand for certificates and other credentials and support career pathways that lead to discernable skill and wage gains. The state’s first plan under WIOA must take effect by July 1, 2016.
CCC Efforts Tackling Similar Issues. In addition to participating in the CWIB’s statewide working group, CCC officials are working internally to align goals, policies, and practices within the system in ways that are consistent with the state’s workforce plan. For example, networks of colleges are working with employers regionally and by industry sector to improve alignment between college programs and workforce needs.
State Has Directed Funding to Several Programs to Promote Integration. The state in recent years has encouraged collaboration through several initiatives related to workforce services. Major programs include:
- State Workforce Board’s “Slingshot” Initiative. The EDD, in conjunction with the CWIB, has dedicated $5.2 million (federal WIA funds) in 2014–15 for grants to regional coalitions of local workforce investment boards for initiatives to support the regional alignment of job seekers with labor market demand.
- Adult Education Consortia. The 2013–14 state budget provided $25 million (Proposition 98 General Fund) for school and CCC districts to form regional consortia and begin collaborating on adult education.
- Secondary and Postsecondary Career Pathways Programs. The state has created numerous programs that provide Proposition 98 funding to improve linkages or “pathways” from secondary CTE programs to postsecondary CTE programs and industry. Recent programs include the Career Pathways Trust ($250 million in 2014–15 and $250 million in 2013–14), the Career Pathways Program (a total of $490 million since 2005–06), and the Linked Learning pilot program ($5.2 million in 2013–14).
Integration Will Take Time. The state’s workforce programs comprise a complex network that will continue to have multiple funding streams and providers. Despite the state’s promising efforts to improve alignment, many difficult decisions remain related to structure, governance, and accountability, as well as funding policies. Each of these areas involves significant trade–offs for policymakers and will require careful thought, planning, and discussion with myriad stakeholders, all of which takes time to do well. In the rest of this section, we define the specific issues the state must address moving forward and offer some initial guidance for how the Legislature might address them.
Assess Spending Priorities in Light of State’s Workforce Goals. In the coming months, the Legislature will be making its spending commitments for 2015–16 and potentially laying the groundwork for future state investments. As it considers these decisions, we suggest the Legislature weigh all investments against the state’s strategic workforce plan and prioritize those spending commitments that are most likely to advance the state’s progress toward its goals. As indicated above, the state has charged the CWIB with developing the state’s comprehensive plan for workforce services. That plan articulates the state’s goals for the overall workforce system and targeted outcomes for various populations and sets out strategies to achieve these goals.
Integrate Existing Regional Structures. As noted earlier, the WIOA working group is in the process of defining the state’s major economic regions by patterns of economic activity. These efforts should help the state better align education and training programs with workforce needs. We also recognize that collaboration is needed at various geographic levels, such that multiple local partnerships could work together within larger regions. Although the state should not discourage any existing partnerships that are working well, we recommend it move over time toward a more coherent set of economic regions for planning and collaboration and encourage smaller local or regional partnerships to align with the large regions within which they are located. This would allow participants to have clearer lines of communication and to work in concert to address broader regional priorities. It also would mitigate existing industry fatigue related to employers being approached by so many potential partners and being asked to sit on so many planning and grant committees.
Ensure Accountability to Public. As the Legislature considers how to align the state’s existing regional structures, it will need to think about the best way to ensure public accountability. Regional decision making tends to be complicated because participants—who may be elected, appointed, or volunteer members of legally constituted collaborations or informal ones—represent different constituencies and may not have formal authority to commit the organizations they represent to a course of action. Regardless of the exact design of any modified regional structure, we recommend the Legislature require regional decision makers to report regularly on their decisions to elected bodies and the public locally as well as reporting up through state channels.
Avoid Further Fragmentation. In adopting the state’s Local Control Funding Formula (LCFF) for school districts, the Governor and Legislature replaced most earmarked program funding with more flexible funding paired with stronger accountability for results. Creating new funding earmarks conflicts with this concept. As the Legislature considers its future spending commitments, we recommend it avoid further fragmenting funding into separate programs, except in narrow circumstances when it has reason to believe that accountability measures are not sufficient to guide providers’ decisions. Consistent with this approach, we recommend the Legislature primarily fund core programs rather than specific earmarks.
Provide Flexibility in Service Delivery to Regions and Providers. An approach similar to LCFF—relying on accountability for results rather than prescriptive spending requirements—also could extend to regional consortia and other decision making bodies. We encourage the Legislature to set clear expectations and empower the regions to determine how best to meet those expectations in their local context. Likewise, we recommend service providers be held accountable for results rather than for complying with particular instructional methods or processes.
Develop Funding and Fee Policies. In general, we believe the state should not provide significantly different subsidies for similar outcomes—for example, funding basic skills courses in one segment or geographic area at one per–student rate while paying a very different rate in another segment or area. On the other hand, providing some flexibility in funding rates could allow for innovation and competition among educational providers within a region, resulting in better outcomes per dollar. The Legislature will need to decide how it wants to balance consistency and flexibility in its funding policies. It faces somewhat similar issues in setting its fee policies, with tension between consistency (charging the same fee for the same types of programs across the state) and competition (allowing providers to compete with each other for offering the best service at the most affordable fee level). Regardless of its exact funding and fee policies, the state should know what it is getting—both in terms of service levels and outcomes—in return for its public investment.
Use Consistent Performance Measures and Data Collection to Track Progress on State Goals. State workforce leaders have been working toward a common workforce accountability system. The goal is to provide a way for the state to evaluate the success of its various workforce efforts. This requires the state to adopt standard performance measures that can be aggregated across providers, as well as methods to track participants’ progress through the system and into the workforce. We recommend the Legislature require all recipients of workforce–related funding to use common performance measures and regularly share standardized data so that they, as well as the state, can identify areas of success as well as duplication of effort and other systemic problems.
In this section, we provide background on adult education, including its purposes, providers, and funding. We then provide an overview of recent reforms in how the state provides adult education and an update on the status of these reforms. Next, we describe the Governor’s adult education proposal and provide our associated assessment and recommendations.
Adult Education Has Multiple Purposes. The primary purpose of adult education is to provide adults with the precollegiate knowledge and skills they need to participate in civic life and the workforce. Toward this end, most adult education course offerings are in three instructional areas: basic skills, English as a second language (ESL), and CTE. However, some adult education also is offered in various other subjects, including health and safety, parenting, and home economics.
Adult Schools and Community Colleges Are State’s Main Providers. Adult schools—which are operated by school districts—and community colleges are the state’s primary providers of adult education. Other entities, such as public libraries, community–based organizations, and prisons also operate adult education programs.
Both Credit and Noncredit Courses Offered. The majority of adult education courses offered by community colleges are for college credit, but some courses are noncredit. Some of these noncredit courses are designated “career development and college preparation” (CDCP) courses. This course designation is used for CTE course series that lead to a noncredit certificate (such as a certificate of competency in business office support skills) and other specified outcomes as well as basic skills and ESL courses. Other CCC noncredit courses, including citizenship, parenting, and home economics courses, do not receive the CDCP designation. Whereas most adult education at CCC is for credit, adult schools typically offer noncredit instruction.
Historically, State Provided Dedicated Funding for Adult Schools. Historically, the state funded adult schools through a categorical program. (Categorical, or restricted, funding contrasts with general purpose funding that is available for any educational purpose.) In 2007–08, the state provided $708 million for adult schools. In 2008, the state reduced categorical funding by 20 percent and, in February 2009, gave school districts the option to treat most categorical funds (including those for adult education) as general purpose funds. That is, districts could use formerly restricted funding for any educational purpose to deal with their budget challenges. This practice, which lasted until 2013, was known as “categorical flexibility.” Since then, the state has implemented LCFF and eliminated most categorical funding.
Most CCC Adult Education Supported With Apportionment Funds. The state funds most CCC adult education through general purpose apportionments. Colleges receive a per–student amount based on the type of course. In 2014–15, community colleges are receiving about $5.8 billion for apportionments. Of this amount, colleges are using about $5.6 billion for credit instruction (at a rate of $4,676 per full–time equivalent student) and about $230 million for noncredit instruction (at a rate of $3,311 for CDCP courses and $2,812 for other noncredit courses). Unlike in school districts, where any instruction provided to adults is considered adult education, the line between adult education and other types of instruction is blurred at community colleges. In general, we estimate that 25 percent to 30 percent of credit instruction and about half of noncredit instruction is related to basic skills, ESL, and CTE. Using this estimate, we figure CCC spends between $1.5 billion and $1.8 billion on adult education.
Small Amount of CCC Adult Education Supported With Categorical Funds. CCC also receives some categorical funding for adult education, including apprenticeship and CTE programs. In 2014–15, CCC received $23 million for the apprenticeship program, which funds school districts and community colleges providing apprenticeship instruction through the state. CCC also received $48 million for grants to school districts and community colleges developing CTE pathways. These grants help prepare individuals for postsecondary CTE. (The Governor’s budget includes proposals for both of these categorical programs, as we discuss later in the report.) In addition, CCC received $73 million in 2014–15 to support workforce and economic development, including $50 million for one–time grants to community colleges to enhance CTE offerings.
School Districts and CCC Receive Federal Funding for Adult Education. Both adult schools and CCC adult programs are eligible to receive federal WIA funds. In 2014–15 the state received a total of $86 million in WIA funds to support adult education at 139 adult schools and 19 community colleges (as well as various other adult education providers). The CDE annually allocates the state’s adult education WIA funds based on student learning gains and other outcomes.
Adult Schools and CCC May Charge Fees. Student fees vary by provider and program type. School districts set fees for adult school programs. The Legislature and Governor set fees for CCC credit instruction (currently $46 per course unit) but prohibit colleges from charging fees for noncredit instruction (including for CDCP courses). We estimate fee revenues in the low tens of millions for adult schools and approximately $120 million for CCC adult education.
2013–14 Budget Charted New Course for Adult Education
Due to serious, longstanding concerns with the state’s bifurcated approach to adult education (with lack of coordination between adult schools and community colleges often cited as a problem), the 2013–14 budget package mapped out a new state strategy for funding and operating adult education. Below, we review these changes.
Eliminated Adult Education Categorical Program and Folded Funds Into LCFF. Funding for adult schools was included in the consolidation of categorical programs into LCFF. However, to ensure adult schools continued to operate during the next two years, the budget package required school districts to maintain at least their 2012–13 level of state spending on adult schools in 2013–14 and 2014–15. Funds used to satisfy this maintenance–of–effort requirement—estimated to be between $300 million and $350 million—come from LCFF allocations for school districts and county offices of education (COEs). Beginning in 2015–16, school districts and COEs will have discretion to spend former adult education funds as they choose.
Narrowed Scope of Adult Education to Five Areas of Instruction. The 2013–14 budget also specified that, moving forward, providers could use state funds for adult education only in five areas of instruction. These areas are (1) elementary and secondary basic skills, (2) citizenship and ESL, (3) education programs for adults with disabilities, (4) career technical education, and (5) programs for apprentices.
Provided Planning Grants for Regional Consortia. The budget provided $25 million for grants to school districts and community college districts to form adult education consortia that would plan a regional delivery approach. The consortia were required to use planning monies in 2013–14 and 2014–15 to document existing services, identify unmet needs, and develop integrated program plans to offer adult education to their regions in the five areas of instruction. While school districts and community college districts were designated as the primary members of consortia, other providers, such as COEs, public libraries, and community–based organizations, were encouraged to join. In addition to providing planning funds, the budget expressed the Legislature’s intent to provide additional funding through the consortia beginning in 2015–16 to implement the regional plans.
Included Reporting Requirements. The budget also required CDE and CCC to provide two reports to the Legislature and Governor. The first report was submitted in March 2014 and provided information about how the $25 million in planning grants were distributed, as well as information about the entities that formed regional consortia. The second report, due March 1, 2015, must include the regional plans each consortium developed. To fulfill these requirements and better coordinate adult education efforts across agencies, CDE and CCC formed a group known as the “AB 86 Cabinet” (named after the authorizing budget legislation) with four representatives from each agency.
2014–15 Legislation Further Addressed Various Problems With Adult Education
Tasks State Entities With Developing More Consistent Adult Education Policies. Chapter 545, Statutes of 2014 (SB 173, Liu), requires CDE and CCC by March 2015 to submit recommendations pertaining to (1) common assessment policies for adult education students at adult schools and community colleges, (2) a consistent fee policy, and (3) a comprehensive accountability system (including the use of a single student identifier). Chapter 545 also requires the Commission on Teacher Credentialing and the CCC Academic Senate to make recommendations pertaining to qualifications for adult education teachers in both segments by July 2016. Lastly, the legislation requires CDE and CCC to annually report the number of adult education courses offered and students served with regional consortia funding.
Changed Funding Rates for CCC Noncredit Instruction to Match Credit Instruction. The 2014–15 budget package also increased the funding rate for CDCP courses to match the funding rate for credit instruction beginning in 2015–16.
Planning Grants Distributed to 70 Consortia. According to the first adult education consortia report submitted in March 2014, 281 school districts and 72 community college districts formed 70 consortia and received planning grants. (Since then, the number of participating school districts has increased to 320. Notably, only 214 of these districts currently operate adult education programs. It is unclear if the remaining districts offered adult education programs before categorical flexibility.) In addition to school and community college districts, a number of other adult education providers are participating in the consortia. Local workforce investment boards, public libraries, county social services agencies, community–based organizations, and Regional Occupational Centers and Programs are among participants reported.
Consortia Use Community College Districts as Regions. With the exception of two pairs of districts that each merged into a single planning region, each consortium is using a CCC district’s boundaries to define its service area.
Funding Distributed Through Fiscal Agents. Each consortium designated a fiscal agent for its grant, with 15 selecting school districts and 55 selecting CCC districts. CDE and CCC distributed the planning funds based on a formula providing a uniform base grant (about $160,000 per consortium) plus a varying amount determined by population and demographic factors within each service area. Planning funds generally were spent on outreach to providers, meetings, data collection, and report writing. (Some consortia hired consultants to collect demographic data or write the reports.)
Each Consortium Has Developed and Submitted Its Regional Plan. Consortia submitted their plans in stages for the AB 86 Cabinet to review. Various sections of the preliminary plans were due at the end of July, October, and December 2014, with the final, comprehensive plans due March 1, 2015. The Cabinet used an independent consulting group as well as its own staff to compile information from the 70 preliminary regional plans. The following paragraphs describe findings from these preliminary plans.
Adult Education Enrollment Fell Significantly During Recession. As part of their planning process, consortia were required to report on their existing service levels and how they have changed in recent years. Their preliminary reports show that enrollment (or headcount) in adult schools and CCC adult education programs fell significantly during the period of categorical flexibility, from 2.3 million students enrolled in 2008–09 to 1.5 million in 2012–13. This represents a 36 percent decline. The enrollment decline was most pronounced for adult schools, where enrollment fell more than half—from 1.2 million to about 560,000. In contrast, CCC adult education enrollment fell 18 percent.
CCC Has Surpassed Adult Schools in Adult Education Enrollment. As a result of their steeper enrollment decline, adult schools now serve fewer than 40 percent of adult education students and CCCs serve nearly 60 percent, as shown in Figure 30. Other providers also have increased their share of enrollment, from 1 percent to 3 percent.
Adult School Enrollment Fell in All Subject Areas. As shown in Figure 31, adult schools lost enrollment in all program areas, with the largest declines in ESL and CTE. (The pattern of CCC’s enrollment decline is similar, though the magnitude is smaller.)
Decline in District Spending Commensurate With Drop in Enrollment. School districts reduced funding for adult schools by an estimated 54 percent following categorical flexibility, from $708 million in 2007–08 (when it was still a categorical program) to $325 million based on expenditure data in 2012–13. (This includes funding for all adult education offered at the schools, not only courses in the five priority areas.)
Number of Adult School Programs Also Fell, but Not as Much. The preliminary reports showed that the number of adult school programs fell from 619 in 2008–09 to 554 in 2012–13—a drop of 11 percent. This suggests that many adult school programs may have continued to operate while serving fewer students. Programs for adults with disabilities were most likely to be eliminated, while the number of apprenticeship programs remained unchanged. The number of CCC adult education programs dropped as well, from 260 programs in the five areas to 250 programs—a 4 percent decrease.
Plans Identify Common Program Challenges and Gaps in Service. The preliminary plans also included data on challenges and gaps. Common challenges reported include insufficient adult education personnel and space for instruction, lack of information and data sharing between providers, absence of consistent policies such as for assessment and placement, a shortage of basic skills training, and inadequate professional development. The plans also highlighted the scarcity of apprenticeship and other CTE opportunities for adults.
Proposes $500 Million in Dedicated Funding for Adult Education. The Governor proposes $500 million (Proposition 98 General Fund) for instruction in the five priority areas through an adult education block grant to be distributed to the regional consortia. The Governor’s proposal defines the consortia members as school districts, COEs, and community college districts and indicates that they will operate under a governance structure to be approved by the Superintendent of Public Instruction (SPI) and Chancellor. The SPI and Chancellor would determine the allocation of funds to each consortium based on regional adult education needs. The funding would be appropriated directly from the state to each consortium’s fiscal agent, which could use up to 5 percent of funds for administration. (The Governor’s proposal does not affect colleges’ apportionments, their primary source of support for adult education.)
Committees to Allocate Funds Among Consortium Members. Under the Governor’s proposal, each consortium would form a seven–person allocation committee to distribute funding among its members within the region based on the consortium’s analysis of needs and gaps. Each allocation committee would include a school district or COE official (selected collectively by the school district and COE members of the consortium) and a community college official (selected by the college members). The consortium collectively would select the remaining individuals on the allocation committee, including one representative each from other adult education providers, local workforce development boards, county employment offices, county probation departments, and the public.
For 2015–16 Only, Would Guarantee Funding to Existing Adult Schools. For 2015–16 only, the new funds would be allocated first to maintain district or COE adult education programs in the five priority areas. (The school districts previously required to use a portion of their LCFF funds to meet their adult education maintenance–of–effort requirement would be able to use the freed up LCFF funds for any K–12 purpose moving forward.) The SPI and Chancellor would certify the exact amount of the $500 million needed for this purpose (currently estimated to be between $300 million and $350 million) by August 30, 2015. For all subsequent years, the full $500 million would be available for allocation to the regional consortia based on (1) the amount allocated to the consortium in the prior year (including the 2015–16 hold–harmless amount for district and COE adult education programs), (2) the region’s needs for adult education, and (3) the consortium’s effectiveness in meeting those needs. To determine the need for adult education statewide and in each region, the SPI and Chancellor would consider measures related to adult population, employment, immigration, educational attainment, and adult literacy.
Requires Annual Consortia Plans. Under the Governor’s proposal, each consortium would develop an annual plan evaluating adult education needs in the region and providing an assessment of current funding (including funding from sources other than the adult education block grant) and service levels. The plans would be required to identify actions consortium members can take to improve the effectiveness of their services and align them across providers. The plans also would describe how the region’s services are aligned with other workforce plans guiding services in the region, including WIOA plans.
Requires Annual Report. The proposal also would require the SPI and Chancellor to annually report to DOF, the State Board of Education (SBE), and the Legislature. The report would be required to include recommendations for better delivery and alignment of adult education services.
Governor Indicates Additional Details to Follow in Spring. The administration indicates that it will provide a more comprehensive proposal after the required Chapter 545 report is released this spring. This report is to contain recommendations addressing various fundamental issues, including student assessment policies, fee rates, and accountability systems.
In Concept, Adult Education Proposal Consistent With Integration Approach. The Governor’s regional approach to adult education has the potential to better coordinate the adult education system. This approach could help align services across different educational levels and providers. It also could better align programs and funding with workforce needs. Adult education providers already have indicated that the process of working with other regional providers through the consortium planning process has improved communication and collaboration among them. In some areas, partners are using the adult education consortia as the locus of collaboration for numerous workforce education initiatives beyond the adult education block grant.
Proposed Block Grant Does Not Include All Adult Education Funding. Although the Governor’s proposal would require consortia plans to consider all adult education funding available in the region, the proposed block grant excludes the largest source of funds for adult education—community college apportionments. That is, although consortia will include community college districts and may allocate block grant funds to colleges, they will have no formal influence over the colleges’ use of apportionment funds. Because of the relative magnitude of apportionment funding for adult education—an estimated three times the amount of the proposed block grant—excluding these funds from the regional allocation process limits the ability of consortia to align adult education funding with regional needs. The proposed block grant also excludes federal WIA funds for adult literacy currently provided to schools, community colleges, libraries, and other providers, as well as various other, smaller funding sources for adult education.
Proposal Lacks Significant Details. The Governor’s proposal lacks many details regarding the new adult education approach. Most notably, the Governor leaves it to the SPI and Chancellor to approve the governance structures proposed by the regional consortia. Presumably, such structures would address how to balance the interests of the consortia members—a key issue the Legislature likely would want to weigh in on. Moreover, the proposal fails to explain what formal authority and accountability the allocation committees would have for directing the flow of state dollars. Although the idea of an allocation board that includes members who are independent from the funded entities has some merit, it also raises difficult accountability issues.
Unclear How Much Education the Proposal Would Fund. Under the Governor’s proposal, adult schools could fund adult education courses at any rate approved by the regional consortium. (In contrast, state law sets CCC funding rates for various types of enrollment.) Moreover, state law specifies that additional adult education funds should “expand and improve” adult education, leaving uncertainty about how the state should balance investments in increased enrollment with efforts to improve program quality, expand support services, and support coordination efforts.
Spending on Adult Education Not Necessarily Proportional to Needs. The amount of funding school districts and COEs spend on adult education is related to numerous choices made over several decades, many of them unrelated to a region’s relative need for these services. Most recently, decisions regarding whether to reduce or eliminate adult education programs likely had more to do with districts’ and COEs’ financial condition, along with incentives in the state’s accountability framework.
One–Time Guaranteed Funding Warranted . . . The administration’s proposal to maintain current funding levels for adult schools for one year is understandable. Because the consortia had no reliable indication of potential ongoing funding levels until the Governor released his budget in January, it would have been difficult for them to plan significant reallocation of funding for 2015–16. A sudden disruption to existing funding patterns could result in reduced adult education capacity in the short term that would be difficult to rebuild.
. . . But Should Not Extend Beyond 2015–16. One of the main objectives of the new adult education program—and the reason for putting funds into a block grant instead of appropriating them directly to providers—was to provide flexibility to regional consortia regarding how best to meet their regions’ needs. Continuing to carve our funds based on historical funding patterns delays this reform. Consortia already have had a two–year planning window to prepare for changes. Once the 2015–16 budget sets an ongoing funding level, they can develop multiyear allocation plans, giving providers sufficient notice of changes in funding.
Annual Consortia Planning Overly Burdensome. Annual reporting of expenditures and outcomes is important for accountability. Annually revising a comprehensive plan for coordinating adult education services within a region, however, is very time–consuming if done well, and unlikely to add value commensurate with the effort required. Related workforce plans, such as state and local WIOA plans, will be completed every four years under the new federal law.
Adopt Governor’s Adult Education Proposal With Modifications. We recommend the Legislature fund the adult education block grant as proposed, including the one–year hold–harmless provision for adult schools. We suggest the Legislature modify other aspects of the proposal, as discussed below.
Consider Ways to Incorporate Other Major Sources of Adult Education Funding. The Legislature could consider ways to better integrate CCC funding used for adult education and WIA adult literacy funding into regional consortium planning. The Legislature could consider folding these funds into the consortia program or otherwise coordinating the funds with the consortia program.
Require CDE and CCC to Provide Legislature With Statewide Allocation Plan. We recommend the Legislature require the SPI and Chancellor to present their statewide allocation plan at spring budget hearings. At that time, the Legislature will need to determine whether additional statutory guidance may be required to ensure the allocation of these funds is consistent with the state’s highest priorities for adult education and workforce coordination.
Set Clearer Parameters for Allocation Boards. We recommend the Legislature request additional information from the administration regarding its proposal for the allocation committees. Specifically, the administration should explain how the boards would be held accountable for their actions, and how decisions would be made in the event a board cannot agree on an allocation plan. Depending on the administration’s responses, the Legislature could strengthen accountability for the boards. Alternatively, the Legislature could modify the role of the committees to an advisory one with a strong presumption that consortia follow their recommendations. This would leave the formal authority for allocating the funds with the designated fiscal agent for each consortium—agents who have clearer lines of accountability to the state.
Gradually Shift Funding Allocation to Reflect Need. We recognize that initially the Legislature may wish to preserve current adult education funding patterns to limit disruption in service levels. Over time, however, we believe the funding allocation increasingly should be based on measures of need for adult education services. Specifically, we think the proposed allocation factor based on prior–year spending should apply only to the current level of funding, with future augmentations allocated based on some combination of need and performance.
Maintain Annual Expenditure and Outcome Reports but Reduce Frequency of Comprehensive Regional Planning. We recommend the Legislature adopt the proposed requirement that the SPI and Chancellor annually submit a report on spending and outcomes. The state could use these annual reports to assess the effectiveness of its spending decisions. We recommend the Legislature, however, extend the life of comprehensive regional plans, requiring their updating less frequently (perhaps only once every four years consistent with the WIOA planning cycle).
Wait for March 1 Adult Education Report to Develop Other Policies. As indicated earlier, Chapter 545 tasked CDE and CCC with making recommendations on various adult education policies, including assessment, fee, and accountability policies. Upon receiving the March report, we could assist the Legislature in addressing these issues as it develops its final budget package.
This section provides information about the Governor’s proposal to create a new grant for CTE in high schools. First, we provide background on high school CTE. Next, we describe the Governor’s proposal to fund a new CTE grant program, assess the proposal, and offer associated recommendations.
Several Fund Sources Support High School CTE. CDE defines high school CTE as coursework in one of 15 industry areas. As shown in Figure 32, this list encompasses a broad and diverse range of industry sectors—including building and construction trades, fashion design, and health occupations. High schools receive funding for CTE in various forms, including ongoing categorical programs, one–time competitive grants, foundation funding, and federal funding. In addition, many high schools fund CTE instruction using their general purpose LCFF monies.
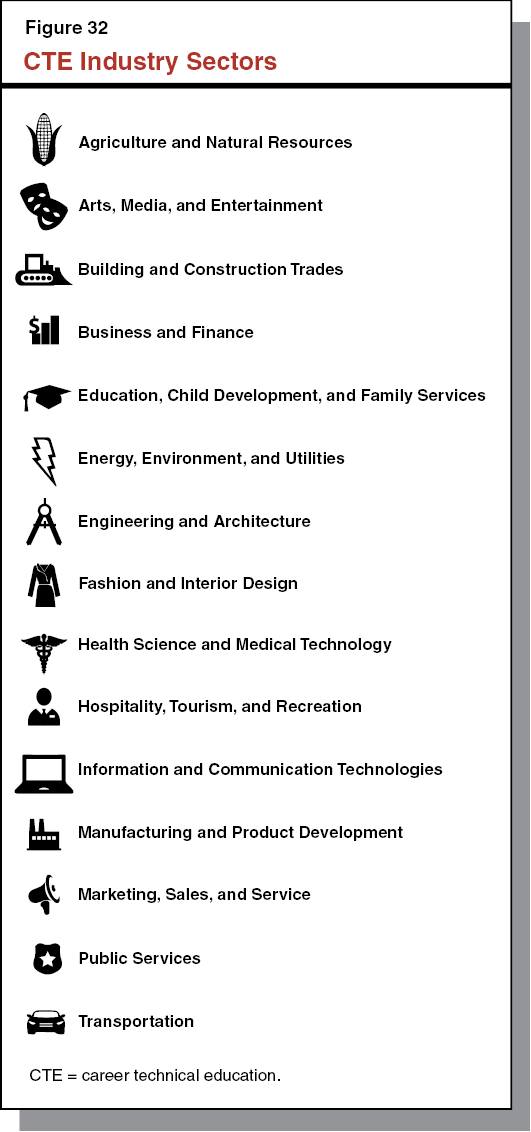
Regional Occupational Centers and Programs (ROCPs) Comprise State’s Largest High School CTE Program. ROCPs provide regionally focused CTE during the school day, after school, and in the evening at high schools and regional centers. They primarily serve high school students ages 16 through 18 but some centers also offer CTE courses to adults for a fee. ROCPs fall under one of three distinct organizational structures: (1) school districts participating in an ROCP operated by a COE, (2) school districts participating under a joint powers agreement, or (3) a single school district.
ROCPs Subject to Categorical Flexibility During Recession. Prior to 2008–09, 75 ROCPs received $446 million in dedicated categorical funding. Like the adult school categorical program described earlier in this report, the ROCP categorical program became flexible in 2009. That is, the state allowed districts and COEs to use ROCP funds toward any educational purpose.
Despite Flexibility, ROCPs Largely Maintained. Unlike adult schools, ROCPs were largely maintained during the period of categorical flexibility. State spending data indicate that schools continued to spend about 85 percent of their formerly restricted funds to support ROCP during this period. (In a 2012 survey we conducted, schools districts reported that among 23 major programs included in categorical flexibility, they were least likely to shift funds away from ROCP.) CDE indicates that 70 ROCPs currently continue to operate. (Due partly to a shift to a new data collection system, CDE does not have comparable enrollment data for ROCP before and after categorical flexibility.)
ROCP Folded Into New K–12 Funding Formula. As part of the 2013–14 budget package, the state eliminated the ROCP program (along with many other categorical programs) and folded former ROCP funding into LCFF. However, as it did for adult schools, the budget provided temporary funding protection for ROCPs. It required providers to maintain at least their 2012–13 level of state spending on ROCP in 2013–14 and 2014–15—estimated to be $384 million—out of their LCFF allocations. Beginning in 2015–16, school districts and COEs will have discretion to spend former ROCP funds as they choose.
New Funding Formula Awards More Money to High Schools to Acknowledge Higher Educational Costs. LCFF provides school districts a higher rate for high school students in recognition of the higher costs of educating them. In addition to a higher “base” rate, the formula also has a high school “add–on” equal to 2.6 percent of the base rate. The add–on originally was calculated to reflect the costs of ROCP courses. CTE courses typically are more expensive to offer due to equipment costs—for example, cars for auto shop or 3–D printers for technology courses. Although the add–on initially was linked to CTE costs, high schools can use base and add–on funding for any purpose.
Proposes $250 Million for CTE Incentive Grants. The Governor’s budget proposal provides $250 million for a competitive grant initiative for secondary schools to offer (or continue offering) CTE programs that lead to industry–recognized credentials or prepare students for postsecondary CTE training. This appropriation is to be the first of three annual $250 million installments. The administration indicates that the three years would be a transition period to help districts maintain CTE as LCFF is being implemented. (During the LCFF implementation period, expected to extend until 2020–21, high school funding rates are being ramped up, with the ultimate intent to meet statutory funding targets.)
Grant Amounts and Grantees Determined by CDE and SBE. The program would be open to school districts, COEs, charter schools, and ROCP joint powers authorities. Proposed budget legislation specifies several eligibility requirements. Most notably, applicants must offer high–quality instruction and comprehensive services (including career guidance) and coordinate their programs with local postsecondary institutions, businesses, and labor organizations. Local education agencies that leverage other CTE resources, currently invest in CTE programs, and collaborate with each other regionally would receive priority. The proposal requires CDE to consult with CCC and state workforce and business groups in developing the request for proposals and considering applications. The SBE would approve applications based on CDE recommendations. Renewal of awards would be based on a number of performance measures, including the number of students completing CTE coursework; gaining industry credentials; and enrolling in postsecondary, apprenticeship, or other job training programs. The proposal authorizes CDE to set aside $2.5 million of the funds annually for planning grants and technical assistance for applicants and grantees.
Requires Local Match and Commitment to Ongoing Support. As a condition of receiving funds, grantees would be required to provide a dollar–for–dollar match and commit to providing ongoing support for CTE programs after the grant expires. The administration indicates that the CTE matching funds could come from any source, including LCFF, federal, or private funds. Grantees receiving the grants in one year could re–apply in subsequent years if they fulfill grant requirements.
Allows ROCP Maintenance–of–Effort Requirement to Expire. Unlike the Governor’s adult education proposal, which provides new dedicated funding for adult schools in 2015–16 when the maintenance–of–effort requirement expires, his CTE proposal does not guarantee any particular level of funding for ROCPs beginning in 2015–16. It is likely that most ROCPs, however, meet the priority criteria for the new three–year grant program.
Proposal Is Inconsistent With LCFF Principles. The passage of LCFF signaled a shift in the way the state funds schools from a compliance–based system with dedicated funding streams that schools were required to spend in a certain way to an accountability–based system where districts are provided flexibility in how they use their funding as long as they meet certain goals. By creating a new categorical program (albeit a short–term one), the Governor’s proposal represents a departure from the new funding approach.
Accountability Reports Incentivize Schools to Offer High Quality CTE. The success of LCFF will be determined partly by the strength of its associated accountability system. The state is in the midst of making improvements to this system. Already, the system has strong incentives for schools to offer CTE given that it helps them meet student learning goals and keeps students engaged—two key outcomes for which schools are held accountable. This is one of the reasons schools value CTE, as demonstrated by the high share of ROCP funding maintained under categorical flexibility. To further encourage schools to offer CTE, recent legislation requires that the state’s two primary accountability reports, Local Control and Accountability Plans (LCAPs) and the Academic Performance Index (API), include explicit CTE–related measures. We provide more detail on the CTE measures in these reports below.
- LCAPs. State law requires school districts and COEs to annually prepare (or update) three–year plans to improve student achievement. Among required metrics in the plans is the share of students who are college and career ready. The 2014–15 school year marked the first year of LCAP implementation. The SBE currently is developing evaluation criteria to assess districts’ and COEs’ progress toward improving student achievement.
- API. The state’s API ranks school and district performance based on a range of measures. In the past, the state based API exclusively on the results of standardized tests. Legislation in 2012 required the SPI to develop a revised API for high schools that takes into account graduation rates and high school students’ readiness for college and careers. The SPI currently is gathering feedback on possible career readiness indicators for the API, such as the number and share of students who complete a sequence of CTE courses or earn CCC credit in a CTE program. Law requires these indicators be included in the API by the beginning of the 2015–16 school year.
Recommend Legislature Reject Secondary School CTE Grants. Given these findings, we recommend the Legislature reject the Governor’s proposal. The Legislature could instead use the funds for other high one–time Proposition 98 priorities.
Continue to Focus CTE Accountability on Student Outcomes. We recommend the Legislature continue to focus on an overall approach for high school CTE that relies more heavily on student outcomes and less heavily on the specific strategies educators use to achieve those outcomes. Under this approach, the Legislature would eliminate programmatic requirements for CTE programs in favor of evaluating and holding high schools accountable for student outcomes, as reflected in their LCAPs and API scores. If the Legislature were to determine that these accountability measures were insufficient, it could strengthen them. By holding districts more accountable for student outcomes, the state could promote the positive benefits of CTE while providing more local flexibility to develop effective programs.
Recommend Legislature Request SPI Provide Update on CTE–Related Accountability Measures During Spring Budget Hearings. We recommend the Legislature monitor the changes to the API and how districts and COEs are incorporating career readiness indicators into their LCAPs. For example, the Legislature could request the SPI present a status update on the development of career and college readiness measures and how these indicators will be incorporated in the performance evaluation criteria at a spring budget hearing.
This section provides information about the Governor’s proposal to fund the CTE Pathways Program for one additional year. Below, we provide background about the program, describe and assess the Governor’s proposal, and provide recommendations for the Legislature to consider.
Program Aims to Improve Career Pathways. The CTE Pathways Program provides grants to consortia that must include community colleges and high school districts (and may include other partners). The goal of the program is to help regions develop, over a three–year period, sustainable policies and infrastructure to improve CTE pathways among schools, community colleges, and regional business and labor organizations. To qualify for funding, grantees must work toward eight specific objectives set forth in the program’s authorizing legislation, Chapter 433, Statutes of 2012, (SB 1070, Steinberg). These objectives include aligning secondary and postsecondary CTE programs to create seamless transitions for students, providing professional development to facilitate CTE partnerships, and increasing the number of students who engage in work experience programs.
Original Program Created in 2005, Reauthorized Program to Sunset at End of 2014–15. The first generation of the CTE Pathways Program was created by Chapter 352, Statutes of 2005, (SB 70, Scott). This program was known as the CTE Pathways Initiative and also provided funding to align CTE between secondary and postsecondary providers. Under that program, the state provided $346 million over 7 years. The 2012 reauthorization modified the program to strengthen regional collaboration requirements and accountability for performance. It reauthorized the program only through the end of 2014–15.
CDE and CCC Jointly Allocate Funding. While state funding for the CTE Pathways Program is included in the CCC budget, state law requires CDE and CCC to jointly allocate funding for programs through an interagency agreement. In 2014–15, the CTE Pathways Program provided $48 million (Proposition 98 General Fund) to 27 programs. Grants ranged from $225,000 to $9 million. Grants were awarded both to ongoing programs and initiatives with specific, one–time goals. An example of the former is support for California Partnership Academies—high school programs that integrate career themes with academic education through small learning cohorts. An example of the latter is funding provided to CCC to establish and validate a reliable measure of college and career readiness.
Extends CTE Pathways Program for One Year. The Governor’s plan includes $48 million to extend the CTE Pathways Program for an additional year. He plans to use 2013–14 Proposition 98 General Fund to support the extension. The funds could cover existing grants or fund new grants.
Justification for Extending CTE Pathways Program Unclear. As discussed in our assessment of the Governor’s CTE Incentive Grant proposal, providing additional categorical funding for CTE further fragments funding. The state’s school funding approach and, increasingly its approach to postsecondary education, rely more heavily on accountability for results rather than dedicated funding tied to specific programmatic requirements. Continued funding of a categorical program already set to expire would be a step in the opposite direction.
Reject CTE Pathways Program Extension. Given these concerns, we recommend rejecting the Governor’s proposal to extend the CTE Pathways Program by an additional year. The Legislature could use the associated funds for other high one–time Proposition 98 priorities.
This section reviews the Governor’s proposal to expand apprenticeship opportunities. We provide a brief background about apprenticeship training, describe the Governor’s proposal, assess the proposal, and conclude with our recommendations for apprenticeship funding.
Apprenticeships Provide On–the–Job Training in a Specific Trade. Apprenticeships are paid, educational work programs that pair adult students with skilled workers for supervised, hands–on learning, typically in the skilled trades. Apprenticeships last from two to six years, ideally resulting in a job placement. Apprenticeship programs commonly are sponsored by businesses or labor unions that help design and support the programs and recruit apprentices.
Apprenticeships Also Have a Classroom Component. During an apprenticeship, apprentices take classes relevant to their trade. Many apprenticeship programs have stand–alone training centers, but adult schools, ROCPs, and community colleges also house some apprenticeship instruction. Classroom time, known as related supplemental instruction (RSI), usually is held on weekends or evenings to accommodate work schedules. RSI is a smaller component of apprenticeships than on the job training. The required mix of training hours varies by industry. Carpentry apprentices spend a minimum of 3,600 hours on the job and 432 hours in RSI over 3 years, for example, while air conditioning and refrigeration apprentices must complete 7,500 hours on the job and 1,080 hours in RSI over 5 years. State funding helps support some costs of RSI by providing about $5 for every hour of instruction. (CCC indicates that apprenticeship sponsors typically fund more than half of RSI costs.)
State Funds RSI Through CCC Categorical Program. In 2014–15, the state provided $23 million (Proposition 98 General Fund) for apprenticeship RSI. Funds for the program are appropriated to CCC and passed through to local education agencies that provide the instruction. Apprenticeship program sponsors must partner with a school district or community college and be approved by the state’s Division of Apprenticeship Standards to qualify for state RSI funding. CCC works closely with the division and other workforce partners to direct funds to high quality apprenticeship programs meeting state standards.
More than 50,000 Apprentices in Various Trades. In early 2015, California had 53,413 active apprentices in 47 trades, ranging from glazing to motion picture work. As shown in Figure 33, the most common apprenticeships are in the construction trades, providing training for carpenters, plumbers, and electricians, among others. Apprenticeships in public safety, primarily for correctional workers and firefighters, are the second most common.
Restores Funding for Existing Apprenticeships Up to Pre–Recession Levels and Increases RSI Rate. The Governor proposes to increase funding for existing apprenticeship programs by $14 million (Proposition 98 General Fund). This would bring the total amount for existing apprenticeships to $37 million. The administration indicates that the increase would restore apprenticeship slots to their pre–recession level and raise the RSI rate from $5.04 to $5.46 to match the CCC noncredit hourly rate.
Funds New Apprenticeships in High–Demand Occupations. The Governor also provides $15 million in new, ongoing funding to support the development of apprenticeships in high–demand occupations. CCC indicates that apprenticeships likely would be started in healthcare, advanced manufacturing, information technology, and “green collar” jobs (for example, jobs in renewable energy). Unlike other apprenticeship funding the state provides through CCC, the Governor proposes allowing CCC to use these funds for purposes other than reimbursing providers for RSI. According to CCC, these could include developing aligned coursework, marketing and piloting new programs, and conducting studies to determine regional needs for apprentices.
Apprenticeship Categorical Inconsistent With State’s Coordinated Workforce Approach. While the new apprenticeship funding aligns with legislative intent to expand apprenticeship opportunities to new fields, augmenting and expanding a categorical program is inconsistent with a coordinated approach to workforce education. Moreover, apprenticeship education already is included as one of the five priority areas for the Governor’s proposed adult education block grant. Funding the same goal—increasing apprenticeship opportunities—in two different areas of the budget increases fragmentation and hinders integration.
Fold Apprenticeship Categorical Program Funds into Adult Education Block Grant. We recommend the Legislature redirect the Governor’s proposed apprenticeship funding to the adult education block grant. (The Legislature also could move base apprenticeship funding into the block grant.) Regional consortia could fund RSI (or other costs associated with apprenticeships) from their block grant apportionments. The Legislature could require that apprenticeship programs receiving state funds be approved and monitored by the Division of Apprenticeship Standards, as they are now. In keeping with a coordinated approach, CDE and CCC could award apprenticeship funds on a competitive basis to adult education regional consortia based on regional industry needs.
Proposition 98 Funding Outlook
- If 2014–15 revenue increases above the administration’s January estimate, the 2014–15 Proposition 98 funding requirement will increase virtually dollar for dollar, with a corresponding increase in the 2015–16 funding requirement. Recommend Legislature begin considering how it might adjust the state budget plan.
|
Overall Spending Plan
- Governor’s overall spending plan appears reasonable, dedicating additional funding largely consistent with the Legislature’s priorities.
- Using one–time funding to pay off outstanding obligations is prudent, particularly while state revenues remain strong. Given likely increase in the 2014–15 minimum guarantee, Legislature could begin considering how to use additional one–time funds. Legislature also could consider dedicating additional 2015–16 funding to one–time purposes to provide a greater cushion against future revenue declines.
|
Local Control Funding Formula (LCFF)
- Dedicate the bulk of any additional ongoing school funding to LCFF, consistent with the past two years of implementation. Such action helps reach the target funding levels as quickly as possible.
- Adopt proposal to allow the Regional Occupational Centers/Programs and adult education maintenance of effort provisions to expire, consistent with statutory intent.
- Adopt proposal to shift Home–to–School Transportation funding from joint powers agencies to their member districts, as this would treat all districts receiving transportation funding similarly regardless of how they previously had provided their transportation services.
|
Interaction Between Property Tax Revenue, LCFF, and Minimum Guarantee
- Count all local property tax revenue up to a basic aid district’s LCFF target toward LCFF (and the minimum guarantee) beginning in 2015–16. This change would recognize that for practical purposes these districts already are funded at—and in many cases funded high above—their LCFF targets. Approach would free up about $400 million that the state could use for other Proposition 98 or non–Proposition 98 priorities.
|
County Offices of Education (COEs)
- Revise the COE minimum state aid statutory provision to stop providing additional funding to certain COEs on top of their overall LCFF funding allotments. Would decrease total COE LCFF costs by around $40 million in 2014–15 and around $60 million in 2015–16, freeing up those funds for other Proposition 98 priorities.
|
Internet Infrastructure for Online Testing
- Reject funding Broadband Infrastructure Improvement Grants at schools where per–student costs would be extraordinarily high.
- Require HSN to use up to $8.3 million of its reserves to fund its 2015–16 operations. Frees up $8.3 million for other one–time Proposition 98 priorities.
- Require separate audit of K–12 High Speed Network (HSN) expenditures.
- Reevaluate HSN budget appropriation in 2016–17, after separate HSN audit is complete.
|
Education Mandates
- Adopt Governor’s proposal to pay $1.5 billion toward the backlog of unpaid education mandate claims on a per–student basis.
- Require State Controller’s Office to report on 2014–15 backlog payments by November 1, 2016 and report on 2015–16 backlog payments by November 1, 2017.
- Adopt Governor’s proposal to add new whooping cough immunization records mandate to the K–12 mandates block grant. Increase K–12 block grant funding by $4.5 million ($2.8 million more than proposed by the Governor) to more accurately reflect the cost of performing the mandate.
- Decrease K–12 block grant funding by $1.5 million due to the repeal of part of a mandate relating to hepatitis B immunization records. Direct the Department of Finance to seek a new decision from the Commission on State Mandates regarding which activities still are required under the hepatitis B immunization mandate.
- Provide a 1.58 percent cost–of–living adjustment to the mandates block grants to better reflect the cost of performing mandated activities and ensure purchasing power is maintained. This would cost $4 million ($3.5 million for the K–12 block grant and $513,000 for the community college block grant).
|
Workforce Education and Training
- View specific workforce proposals as part of a larger state workforce strategy. Make decisions that reduce fragmentation and inconsistencies while strengthening coordination, alignment, and accountability.
|
Adult Education
- Consistent with Governor’s proposed funding level, provide $500 million for adult education consortia (and include a one–year set aside for existing adult schools).
- Fold into or otherwise coordinate community college adult education funding and federal adult literacy funding with adult education consortia program.
- Require California Department of Education (CDE) and California Community Colleges (CCC) to provide Legislature with statewide funding allocation plan.
- Modify Governor’s proposal to provide more guidance on accountability for allocations within regions, future statewide allocations, and frequency of comprehensive regional planning.
- Wait for March 1 report from CDE and CCC to develop other adult education policies. Report required to include recommendations on student assessment, fee, and accountability policies for adult education.
|
Career Technical Education (CTE) Incentive Grants for Secondary Schools
- Reject Governor’s proposal to provide $250 million annually for three years for a new secondary school CTE program. Instead of creating a new CTE categorical program, ensure accountability measures adequately incentivize schools to offer high–quality CTE programs. Request update on CTE–related accountability measures from Superintendent of Public Instruction during spring hearings.
|
Career Pathways Program
- Reject Governor’s proposal to provide $48 million for extending the CTE Pathways Program for one additional year. Continuing to fund a program already set to expire conflicts with the state’s goal of integrating workforce efforts.
|
Apprenticeship Programs
- Fold $52 million in apprenticeship funding into new adult education consortia program. Continuing to fund these programs separately conflicts with the state’s goal of integrating workforce efforts. Apprenticeship education is one of the five priority areas for the adult education consortia.
|
School Facilities (See our companion brief, Rethinking How the State Funds School Facilities)
- Replace the existing School Facilities Program with a new program that provides an annual per–student grant for facilities. Base the grant on the replacement value of existing school buildings and an estimate of the average useful life of those buildings.
- Adjust the grant for local resources such that school districts with lower property wealth receive a larger state grant. Also adjust the grant during the transition period to account for state debt service incurred on a district’s behalf.
- Provide one–time funds to address the existing backlog of facility projects.
- Require the local governing boards of school districts that receive state funds to adopt five–year facility plans containing key information such as a maintenance plan, enrollment projections, and a priority list of facility projects.
|