Certain Schools Serve as Alternatives to Traditional Schools. While most students attend traditional schools, the state authorizes six types of alternative schools. Alternative schools provide educational options for students who could benefit from a different environment or cannot stay at their traditional school because of behavioral issues. Almost all (98 percent) of students enrolled in an alternative school are in high school. At any given time during a school year, roughly 1 in 20 high school students are enrolled in an alternative school. These schools are operated by school districts, county offices of education (COEs), and the Department of Juvenile Justice. Alternative schools typically are much smaller than traditional high schools—with a median of under 100 students per school compared to a median of almost 1,300 students at traditional high schools.
Alternative Schools Designed to Get Students Back on Track. Alternative schools’ primary objective is to help students get back on track with their education and graduate high school prepared for college, career, and adulthood. Alternative schools primarily are designed as short–term interventions—namely, helping students recover credits and transition back to their home schools. Alternative schools therefore generally enroll students for shorter periods of time than traditional schools, with the time students enroll in an alternative school averaging four months.
Report Examines How Well State Holds Alternative Schools Accountable for Educating Students. Any accountability system generally serves three key purposes: (1) it establishes clear overarching objectives as well as sets shorter–term performance expectations, (2) it monitors performance to determine if those objectives and expectations are being met, and (3) it provides support or intervention to those not meeting expectations. This report examines the effectiveness of California’s accountability system for alternative schools, with a particular focus on the existing performance data and accountability reports the state uses to monitor and assess alternative schools. We conclude by providing the Legislature with recommendations for the next steps it could take to improve the state’s accountability system for alternative schools.
Existing Performance Data Less Meaningful for Alternative Schools. Two pieces of performance data the state collects do not adequately measure student progress at alternative schools. Specifically, (1) annual standardized test scores are not a good measure of the academic gains most students make at an alternative school because they enroll for less than a year, and (2) dropout and graduation rate data miss a key outcome for students attending alternative schools—transfer back to the traditional school. Moreover, the state uses a four–year cohort graduation rate to calculate dropout and graduation rates for schools. This methodology does not work for alternative schools because students seldom enroll for four years.
State Effectively Not Holding Many Alternative Schools Accountable. Because alternative schools enroll students for shorter lengths of time than traditional schools, many alternative schools did not have a sufficient number of applicable test scores to receive an accountability report between 2009 and 2013. In 2014, the first year of implementation of the state’s newest accountability report, many Local Control and Accountability Plans (LCAPs) overlooked alternative schools. We are concerned that if alternative schools’ performance is not highlighted in LCAPs, their performance will be masked by district and COE averages. Moreover, we are concerned that if performance issues at alternative schools are masked in LCAPs, they also will be overlooked by the state’s new support and intervention system.
Improve Performance Data for Alternative Schools. Because many students attend alternative schools for short periods of time, we recommend the state require alternative schools to report academic performance data that better gauges their effectiveness at serving short–term students. Specifically, we recommend that alternative schools use two academic measures for their short–term students: (1) scores on state–approved pre– and post–tests and (2) credits gained while enrolled. (We recommend alternative schools continue to use annual standardized tests to measure the performance of their longer–term students.) Because it is a main goal of alternative schools, we also recommend that alternative schools report the share of their students that transfer back to a traditional school. Specifically, we recommend the state create an outcome measure, with students transferring back to their traditional school or graduating deemed a positive outcome and students dropping out a negative outcome. Given alternative schools’ large share of short–term students, we recommend the state use this outcome measure rather than a four–year cohort graduation rate for these schools.
Improve Accountability Reports for Alternative Schools. To ensure the state can monitor and hold all alternative schools accountable for serving their students, we recommend the state collect and publish performance data in accountability reports for all alternative schools, even those that have low numbers of students. (The performance measures we recommend above address the key methodological problems of reporting data for schools with few students. For example, measuring student growth using pre– and post–tests controls for students’ skill levels upon entering the school—allowing the school’s performance to be gauged more meaningfully.) Lastly, we recommend the state ensure that any additional indicators it adopts to measure alternative schools’ performance be comparable across all alternative schools. Having comparable measures would allow the state to identify when one district’s or COE’s alternative schools are performing far below that of similar schools in other districts or counties.
Identify Underperforming Alternative Schools and Support Them. Once the state has begun collecting and reporting better tailored performance data for all alternative schools, it then can set more meaningful performance expectations for these schools and monitor their performance more easily over time. The state is now in the midst of developing evaluation rubrics (or tools for assessing performance), along with performance expectations, as part of its new support and intervention system. We recommend these rubrics account for alternative school performance and include alternative school performance expectations. The state then could use these rubrics and expectations to monitor alternative school performance and provide corresponding support or intervention under the new system. Because the system still is in development, we recommend the Legislature closely monitor State Board of Education decisions about the new accountability system to ensure alternative schools are meaningfully included.
Alternative schools educate students who need an educational setting other than their traditional school. At any given time during a school year, roughly 1 in 20 high school students are enrolled at an alternative school. Since the late 1990s—when California created its original state accountability system for traditional public elementary and secondary schools—it has struggled with how best to hold alternative schools accountable for serving their students well. The state has tried various accountability approaches for alternative schools since this time, with the most recent approach centering around Local Control and Accountability Plans (LCAPs).
In this report, we examine the effectiveness of California’s accountability system for alternative schools. We begin by providing background information about alternative schools and the students who attend them. We then provide an overview of the performance data and accountability reports the state uses to monitor alternative schools, and we discuss potential changes on the horizon. Next, we evaluate how well current performance data and accountability reports assess alternative schools’ student progress. We conclude by providing the Legislature with recommendations regarding the next steps it could take to improve the state’s accountability system for alternative schools.
Below, we provide information about alternative schools and the students who attend them. We first describe different types of alternative schools and the populations they are designed to serve. We then explain how the characteristics and educational experiences of students who attend alternative schools differ from those of students at traditional schools.
Certain Schools Serve as Alternatives to Traditional Schools. While most students attend traditional schools close to their homes, these schools do not always work for all students. To provide educational options to students who could benefit from a different environment or who cannot stay at traditional schools because of behavioral issues, the state authorizes alternative schools. While a few alternative schools enroll elementary students, 98 percent of students attending alternative schools statewide are in high school.
Alternative Schools Have Narrower Set of Objectives Than Traditional Schools. The state’s main objectives for alternative schools are that they help students get back on track with their education and graduate high school prepared for college, career, and adulthood. Because the state’s primary objective for alternative schools is to get students’ education back on track, alternative schools often focus on shorter–term goals that are less applicable to traditional schools. Specifically, two of alternative schools’ primary goals are to help students recover credits and transition back to their traditional schools. Other unique goals include providing support while incarcerated students await trial and reengaging students who have been habitually truant.
Six Types of Alternative Schools Operated by Three Different Entities. The state tasks school districts, county offices of education (COEs), and the Department of Juvenile Justice (DJJ) with operating alternative schools. As displayed in Figure 1, districts operate three alternative school types: continuation high schools, community day schools, and opportunity schools. The COEs also operate opportunity schools. Additionally, they operate county community schools and juvenile court schools. The DJJ operates the California Education Authority (CEA), which serves students incarcerated in the state’s juvenile justice facilities.
Figure 1
Overview of Alternative School Types
2013–14
|
|
District
|
District or COE
|
COE
|
State (DJJ)
|
|
|
Continuation High School
|
Community Day Schoola
|
Opportunity Schoolb
|
County Community Schoolc
|
Juvenile Court School
|
California Education Authority
|
|
Grades served
|
10–12
|
K–12
|
K–12
|
K–12
|
K–12
|
7–12
|
|
Number of schools
|
468
|
234
|
29
|
68
|
76
|
4
|
|
Enrollment
|
62,830
|
7,353
|
2,212
|
15,202
|
6,776
|
494
|
|
Median number of students per school site
|
96
|
10
|
22
|
86
|
61
|
151
|
|
Placement criteria
|
|
- Nonmandatory expulsion
- Probation referred
- SARB referred
- Habitually truant
|
|
- Mandatory expulsion
- Probation referred
- On probation
|
- Awaiting trial
- Incarcerated
|
|
Different Types of Alternative Schools Designed to Serve Different Populations. The state’s authorization of various types of alternative schools developed over many years. District–run alternative schools typically serve students with less severe challenges, whereas COE–run alternative schools typically serve students with more severe challenges. Below, we highlight the main differences between school types.
- District–Run Schools. Continuation high schools and community day schools are the most prevalent, with continuation high schools serving nearly two–thirds of alternative school students. Continuation high schools were the first alternative school the state adopted and were originally designed to give high school students who worked a more flexible approach to their education. Today, continuation high schools typically serve high school students who need a different environment from their traditional school for either academic or behavioral reasons. For example, students might enroll in continuation high schools because they are below grade level and need specialized instruction or because they are bullied at their traditional school and feel a different environment would be safer. (Opportunity schools, which can be operated by both districts and COEs, have similar goals and populations as continuation high schools.) While community day schools are similar to continuation high schools in that they provide an alternative, more tailored academic experience, they generally serve students with more significant challenges.
- COE–Run Schools. County community schools and juvenile court schools were originally created to serve students who were expelled for serious offenses or involved with juvenile law enforcement agencies. Today, county community schools continue to educate students who have been expelled for serious offenses or have had prior contact with the juvenile justice system. Juvenile court schools serve students who are incarcerated at the county level primarily for crimes such as burglary or assault.
- State–Run Schools. Juveniles incarcerated at the state level necessitated the creation of DJJ–run CEA schools. Today, four CEA schools serve the relatively small group of students incarcerated at state juvenile justice facilities. Compared to students who attend COE–run court schools, students at CEA schools are incarcerated for more serious crimes (such as sexual offenses, armed robbery, and murder) and generally are serving longer sentences.
Alternative Schools Tend to Be Smaller Than Traditional Schools. Figure 1 shows the median number of students per school by school type. All of these schools typically are notably smaller than traditional high schools, for which the median size in 2013–14 was almost 1,300 students per school. The CEA schools tend to be the largest type of alternative school, with a median size of 151 students, whereas community day schools frequently are small, with a median of 10 students per school. The most common alternative school type, continuation high schools, have a median size of 96 students.
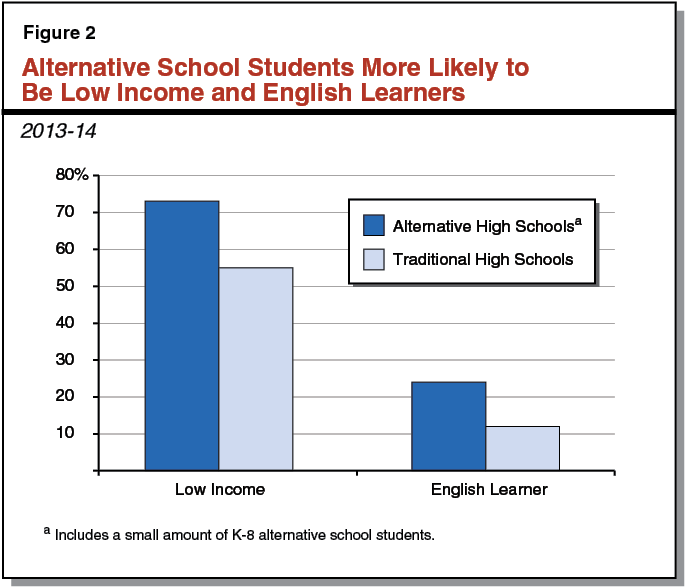
Student Make–Up Differs From Traditional Schools. As shown in Figure 2, students at alternative schools are more commonly identified as low income and English learners than students at traditional high schools. Enrollment data also indicate that students enrolled in alternative schools are more likely to be Hispanic (65 percent compared to 51 percent at traditional high schools) or black (10 percent compared to 6 percent at traditional high schools). The ethnic make–up is even more disproportionate at CEA and juvenile court schools, with Hispanic and black students together making up 87 percent of the student body at CEA and 81 percent of the student body at juvenile court schools.
Alternative Students Tend to Enroll for Short Periods of Time. In contrast to traditional high schools, which typically enroll students for four years, enrollment data show that students at alternative schools usually attend for less than a year. This is not surprising, given that alternative schools primarily are designed as short–term interventions to get students’ education back on track. Figure 3 compares enrollment (the number of students who are enrolled at a single point in time) with cumulative enrollment (the total number of students who enroll at some point during the year) across all alternative school types. The figure shows that cumulative enrollment throughout the school year is more than twice as high as enrollment on census day, indicating that the group of students attending alternative schools turns over frequently during the course of the year.
Figure 3
Alternative Students Typically Enroll for Less Than a Year
2013–14
|
School Type
|
Enrollment on Census Day
|
Total Enrollment During School Yeara
|
Average Length of Stay (In Months)b
|
|
Continuation high school
|
62,830
|
103,793
|
5
|
|
County community school
|
15,202
|
46,736
|
3
|
|
Community day school
|
7,353
|
12,470
|
5
|
|
Juvenile court school
|
6,776
|
40,604
|
2
|
|
Opportunity school
|
2,212
|
4,531
|
4
|
|
California Education Authority
|
494
|
995
|
4
|
|
Totals
|
94,867
|
209,129
|
4
|
Average Length of Stay Varies by Alternative School Type. Figure 3 also shows that while the average length of stay across all alternative schools is four months, there is some variance across school types. Students tend to stay the longest at continuation high schools and community day schools, averaging stays of five months. This likely is because students enroll in and exit those schools voluntarily, as compared to most other school types to which students are referred for specific reasons and do not choose their placement. In contrast, students tend to stay at juvenile court schools for the shortest amount of time (averaging two months), because they only attend the school while they await sentencing or carry out the terms of their sentence.
Any accountability system generally serves three key purposes: (1) it establishes clear overarching objectives as well as sets shorter–term performance expectations; (2) it monitors performance to determine if those objectives and expectations are being met; and (3) it provides support or intervention to those not meeting expectations. Below, we describe the state’s accountability system for traditional schools—focusing first on the performance data the state collects to see if schools are meeting performance expectations, second on how the state compiles these data into accountability reports, and third on what the state does with what it learns from these reports. After describing the accountability system the state uses for traditional schools, we highlight key similarities and differences for alternative schools. (In this report, we do not discuss School Accountability Report Cards, as the state to date has not used these reports for state–level accountability purposes. We also do not cover federal accountability requirements, as these requirements appear to be in a somewhat awkward hiatus and are very likely to change as part of the long–overdue reauthorization of the federal No Child Left Behind Act.)
State Requires Annual Standardized Student Testing and Collects Test Scores From All Schools. The state requires that all students take annual standardized tests to assess their academic abilities. In the spring of 2014, the state began relying upon the Smarter Balanced Assessment Consortia (SBAC) tests to assess students in English language arts and mathematics, replacing the state’s previous set of California Standards Tests for those subjects. (Because students only took a trial test in spring 2014, no individual student data was provided by SBAC that year.) Other major statewide assessments districts must administer include the California Standards Tests in science and the California High School Exit Examination.
Districts and Schools Must Report Students’ High School Outcome Data. The state also requires that districts and high schools report graduation and dropout data. The state currently calculates these rates for schools and districts based on four–year cohort data (that is, of the students who entered high school in ninth grade, how many had graduated/dropped out from high school four years later).
Alternative Schools Report Same Statewide Performance Data as Traditional Schools. Generally, alternative schools are subject to the same statewide data reporting requirements as traditional schools, including student performance on standardized test scores, graduation rates, and dropout rates. (Alternative schools, however, only report spring test scores for students who have been enrolled since at least October of the current school year. The test results for students who transfer into alternative schools midyear generally are attributed back to the school where they began the school year.)
Alternative Schools Tend to Rely on Different Local Performance Indicators. Though most schools use some local indicators in addition to state–required indicators to track their performance, the local indicators that alternative schools use often differ from those of traditional schools. Most notably, unlike traditional schools, alternative schools often monitor their own progress based on short–term measures of performance, including the number of credits students earn and whether students successfully transition back to their traditional schools. Alternative schools also report that they frequently administer tests when students first enter their schools (“pre–tests” of baseline skills) and periodically give follow–up tests throughout the year (“post–tests”) to assess whether students are making progress.
Academic Performance Index (API) Has Been the State’s Primary Accountability Report. Since 1999, the state has used the API as its principal accountability report. While API scores historically have been derived from student results on the state’s standardized tests, the state recently has taken steps to integrate other measures into the API (as discussed later). Schools, districts, and COEs receive API scores, with each district’s and COE’s score based on the aggregate API scores of all its schools. (Districts, COEs, or schools that enroll fewer than 11 students or experience significant year–to–year demographic changes are exempt from having their API scores published.) Scores range from 200 to 1,000, with the state’s goal for all districts, COEs, and schools to score at least 800. The state sets annual API “growth targets” for schools scoring below 800, produces a statewide API ranking of all schools, and develops a “similar schools” API ranking to compare demographically alike schools.
Law Requires State to Calculate API Score for Alternative Schools, but Not Rankings. Like traditional schools, alternative schools currently are supposed to receive API scores and associated targets based on their students’ performance on the state’s annual standardized tests. (As indicated earlier, an alternative school’s API is based only on the test scores of students it has served since October of the current school year.) Unlike traditional schools, alternative schools currently do not receive statewide or similar school rankings. As described in the nearby box, between 2003 and 2009, the state used the Alternative Schools Accountability Model (ASAM) rather than the API for alternative schools. (Traditional schools in which at least 70 percent of students meet certain criteria for being “high risk,” including being under disciplinary sanction or a former dropout, also may request an exemption from API rankings. In 2013–14, 95 traditional schools met these criteria. From 2003 to 2009, these schools could apply to be held accountable using the ASAM.)
Alternative Schools Could Choose 3 of 14 Performance Measures. From 2003 to 2009, the state used the Alternative Schools Accountability Model (ASAM) in lieu of the Academic Performance Index (API) to measure progress at alternative schools. Rather than receiving an API score, alternative schools generally could choose any 3 of 14 performance indicators (shown below) to report to the state.
Shortcomings of ASAM. Over time, a broad consensus formed that the ASAM had two key flaws. First, allowing schools to choose their own combination of performance indicators to report made comparisons across alternative schools nearly impossible. Second, the ASAM data provided an incomplete picture of alternative schools’ performance in that it only included students who were enrolled for at least 90 days. The ASAM measure was on the verge of reform when it was eliminated in 2009 due to budget cuts. Major reforms under consideration included changing reporting requirements to include more alternative education students as well as reducing the ASAM components from 14 to 3—focusing on attendance, academic achievement, and success in transitioning (either graduating or returning to a traditional school).
Alternative Schools Accountability Model Performance Indicators
- Improved student behavior.
|
|
|
|
|
|
|
- Sustained daily attendance.
|
|
|
|
|
|
|
|
|
|
|
|
- General Educational Development (GED) completion, California High School Proficiency Examination certification, or GED section completion.
|
LCAP Reports Contain Multiple Performance Measures. Beginning in 2014–15, school districts and COEs must develop and annually update strategic plans, known as LCAPs, to improve their performance. The LCAPs must include goals toward improving students’ performance in eight state priority areas, including student achievement, student engagement, and school climate. To measure their progress on reaching these goals, districts and COEs use certain data indicators including results on standardized tests, graduation rates, dropout rates, and API scores. (While statutory language requires LCAPs to include data for individual schools, our review finds that most districts and COEs are reporting only aggregate data for the district or COE as a whole.) Districts and COEs must solicit input from community members in developing their LCAPs, and must make their final, adopted plans publicly available. (For more information on the first year of LCAP implementation, see our report, Review of School Districts’ 2014–15 Local Control and Accountability Plans.)
State Recently Suspended API and Is Refining to Include Additional Indicators. Recently, the state has taken two significant actions relating to the API. First, the state suspended the use of the API in 2014–15 to allow schools time to transition to the Common Core State Standards curriculum and associated SBAC tests. Second, the state currently is in the process of refining the API calculation for high schools. Statute requires that in time for the 2016 API calculation, the State Board of Education (SBE) must have revised the API to incorporate other measures of school performance, such as graduation rates and indicators of college and career readiness, in addition to standardized test scores.
Recent Indications That State May Replace API With a Different Accountability Report. Even as the state is in the process of revising the API, some policymakers have signaled strong interest in considering other possible accountability reports. Several members of the SBE, including the board president, have indicated support for eliminating the API in favor of a more comprehensive accountability report that includes additional performance measures. Moreover, in February 2015, the Public Schools Accountability Act Advisory Committee, which advises the SBE on accountability issues, recommended replacing the API with a system that evaluates schools using multiple measures. The committee expressed a preference for a report that more closely aligns with the eight state priority areas required in the LCAP.
Evaluation Rubrics Will Evaluate Districts’ and COEs’ Progress Toward LCAP Goals. The state currently is in the process of developing the criteria it will use to evaluate a district’s or COE’s progress toward meeting its LCAP goals. These criteria, referred to in the authorizing legislation as “evaluation rubrics,” will allow districts, COEs, and the Superintendent of Public Instruction (SPI) to assess progress towards improving student outcomes. Statute requires the SBE to develop and adopt evaluation rubrics by October 2015.
State Creates New Support and Intervention System. In tandem with developing the LCAP, the state also created the basic framework for a new system of support and intervention for struggling districts and COEs. Once the evaluation rubrics have been developed, the SPI and COEs will use them to examine performance and identify places that could benefit from additional assistance. Statute indicates that struggling districts must be offered support once they are identified as underperforming. Support includes the assignment of an academic expert or assistance from the new state agency created to advise and assist in improving school performance. Statute is less clear about how struggling COEs will be offered support. For persistently underperforming districts and COEs, statute indicates that the SPI can intervene by requiring LCAP modifications, imposing budget revisions to align with revised LCAPs, and staying or rescinding an action of the local governing board.
This section describes shortcomings in the way the state holds alternative schools accountable for meeting the state’s expectations. Specifically, we find that the existing state–required performance data and accountability reports do not provide the information necessary for the state, COEs, districts, or local communities to identify how well alternative schools are serving students. We begin by discussing the limitations with existing performance data, then discuss weaknesses of the state’s accountability reports.
Annual Standardized Test Scores Not a Good Measure of Academic Gains for Many Alternative School Students. Because most alternative school students enroll for short periods of time, the state’s primary measure of students’ academic performance—annual standardized test results—is not a particularly useful measure of these schools’ effectiveness. The state tests are administered every spring to measure how much students have learned at their schools over the past year. For traditional schools, this can provide a reasonable indication of the academic gains for which they can be held responsible, because students typically have been enrolled there for the entire school year. In contrast, most students attending alternative schools enroll for half a year or less. For these students, the spring test scores could be more reflective of the instruction they received at the schools they attended previously than the short period of time they have been at the alternative school. This is why the scores of students who transfer to alternative schools midyear usually are attributed to the transferring school. This practice, however, leaves the state without a measure of the academic progress for which the alternative school is responsible.
Graduation and Dropout Rates Miss Key Outcome for Students Attending Alternative Schools. Some of the primary pieces of performance data the state uses to assess high schools—graduation and dropout rates—do not effectively measure student outcomes at alternative schools. Most students are expected to attend traditional high schools for four years, and they either graduate or drop out. In contrast, only some students who attend alternative schools leave because they graduate or drop out, others leave because they transfer to another school (either back to their home school or to another school placement). As such, graduation and dropout rates provide an incomplete picture of student outcomes at alternative schools. Moreover, the methodology the state uses to calculate graduation and dropout rates does not produce a valid result for alternative schools, as it relies on a four–year cohort model. Students typically do not enroll in alternative schools for four years, nor do they move through alternative schools in four–year cohorts. As a result, alternative schools generally are unable to calculate and report graduation and dropout rates.
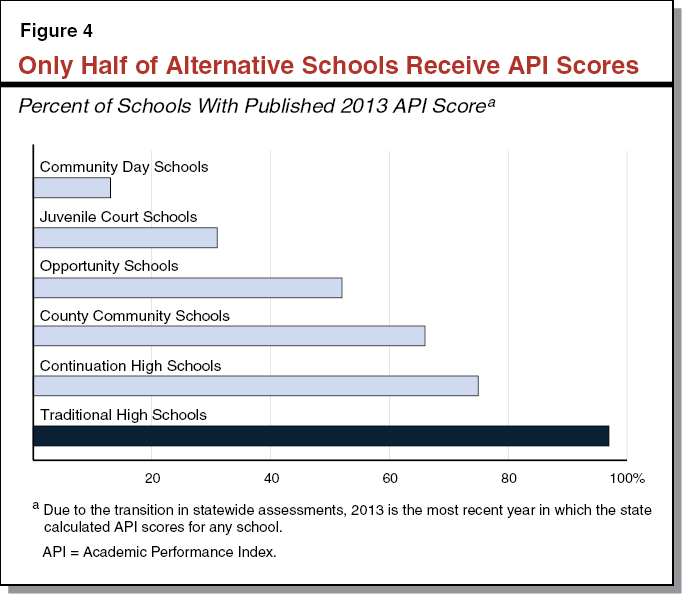
Many Alternative Schools Receive No Accountability Report. Though we believe the API has fundamental design flaws as a tool for measuring alternative schools’ performance, it was the only accountability measure the state had available for these schools from 2009 through 2013. During this period, however, API scores were not reported for many alternative schools. Figure 4 shows that in 2013 (the last year in which the state calculated API scores), the state published API scores for only half of alternative schools, compared to 97 percent of traditional high schools. The California Department of Education indicates this is because the remaining alternative schools did not have standardized test scores from the minimum number of students necessary to calculate an API score. (These schools either had fewer than 11 students take the tests, or most of the students the schools tested had transferred midyear, so their scores counted towards the school from which they had transferred.) Having no accountability report for so many alternative schools meant the state and public could not easily, readily, or systematically examine how well these schools served their students.
In Year One of Implementation, Many LCAPs Overlooked Alternative Schools . . . The state’s newest accountability report, the LCAP, has the potential to improve accountability for alternative schools, as it includes a broader spectrum of performance data. Improvement likely will not occur, however, unless districts and COEs provide data specifically for each of their alternative schools. As noted earlier, though statute directs LCAPs to include school–level data, our review found many districts and COEs neither set school–level performance targets nor provided school–level data in year one of implementation. This is especially problematic for districts’ LCAPs, as alternative schools tend to be a small proportion of the total number of district schools. The performance of alternative schools (which frequently serve low–performing students) in otherwise high–performing districts effectively could be masked as a result of district performance being reported in the aggregate. This could lead to overlooking, and thereby failing to address, ineffective practices at alternative schools. The issue of aggregation exists but is less problematic for COEs, as their LCAPs focus exclusively on alternative schools. Nonetheless, even for a COE, those specific alternative schools most in need of attention could be masked by aggregating all school data for the COE.
. . . Which Could Result in New Support and Intervention System Also Overlooking Alternative Schools. We are concerned that if performance issues at alternative schools are masked due to performance data being aggregated at the district or COE level, then the state’s forthcoming evaluation rubrics likely will not be particularly beneficial for alternative schools. That is, if LCAPs do not include school–level data, then the evaluation rubrics themselves likely will be ineffective at identifying struggling schools. This is a problem for all schools but is particularly problematic for alternative schools serving the highest–risk student populations. If the evaluation rubrics fail to identify struggling schools, then the state’s basic system of support and intervention is likely to be relatively ineffective, as the state likely will not be targeting its support and intervention assistance to the places that need it.
The state already has taken the first step toward an effective accountability system by establishing the primary objective of alternative schools as getting students back on track to graduate high school. It also has taken the step of encouraging districts and COEs to set corresponding annual performance goals. In this section, we provide recommendations for the next steps the Legislature could take to improve alternative school accountability.
We recommend the key performance data that schools are required to report under current law be changed to better reflect performance at alternative schools, as well as traditional schools that serve at least 70 percent of students meeting high–risk criteria. We describe these performance data in more detail below.
Require Academic Performance Data That Better Gauge Schools’ Effectiveness at Serving Short–Term Students. Because many students attend alternative schools for short periods of time, we recommend that state reporting requirements for these schools include academic performance data that measure how well they serve short–term students. To do this, we recommend alternative schools report two short–term measures of academic gains that many schools already use to measure student progress: (1) scores on state–approved pre– and post–tests of skills, and (2) credits gained while enrolled. Various pre– and post–tests exist and currently are used by some alternative schools. Should the Legislature choose to adopt pre– and post–tests as a state–required performance measure, we recommend the state approve a specific set of tests and require that all alternative schools select their tests from the approved list. This would allow the state to compare the short–term academic progress of students across different alternative schools. (For the minority of students who enroll at alternative schools for at least a year, we recommend continuing to use annual standardized test results.) The number of credits gained while at the alternative school is another short–term academic measure that would provide the state with valid information about students’ academic progress and whether alternative schools are meeting their primary objective of helping students overcome credit deficiencies. Given their somewhat unique characteristics and role in the state’s education system, these types of short–term academic performance data are vital for assessing alternative schools’ performance.
Require Additional Data on Student Outcomes. We recommend that in addition to the share of students who graduate and drop out, the state require alternative schools to report the share of their students who transfer back to their traditional school. Because this is a main goal of alternative schools and because some students exit alternative schools for this reason rather than graduating and dropping out, we believe tracking these transitions would improve alternative school accountability. Specifically, for each alternative school, we recommend the state calculate the proportion of students who have a positive outcome (transfer to traditional school or graduation) versus negative outcome (dropping out). We recommend this outcome measure replace using the four–year graduation cohort rate for short–term alternative students.
Ensure State Holds All Alternative Schools Accountable. We recommend the state collect and publish accountability data for all alternative schools, even those that have low numbers of students taking the state’s standardized tests. Adopting our recommendation to expand the performance data upon which alternative schools are judged, including measures for short–term students, would help to increase the validity of their accountability reports. Improving the quality of the performance data and requiring all alternative schools to report such data would help ensure all schools are subject to equally robust accountability measures.
Do Not Allow Alternative School Performance Data to Be Masked by Averages. We recommend that district and COE accountability reports be designed to highlight—not mask—performance at alternative schools. This recommendation would apply to LCAPs, the forthcoming evaluation rubrics, and any future district or COE accountability reports the state might design (such as a “data dashboard” that some have proposed to replace the API). This objective could be accomplished by requiring that district and COE reports include school–level data for each of their alternative schools on the unique data indicators we have discussed. We believe such provisions are essential to ensuring proper monitoring of alternative school performance at both the state and local levels.
Ensure That Comparable Performance Data Are Available for All Alternative Schools. Should the state adopt additional performance data requirements for alternative school accountability, we recommend it ensure the data can be compared across alternative schools. Comparisons provide valuable context for how well schools are performing and give the state and parents an easily understandable indication of schools’ effectiveness. Moreover, using comparable measures would allow the state to identify when a particular district’s or COE’s alternative schools are performing far below that of similar districts or COEs. As described earlier, this essential component was lacking in the previous accountability report the state designed for alternative schools because the ASAM allowed schools to choose their own performance data indicators.
Once the state has begun collecting performance data appropriate for alternative schools and using accountability reports to provide comparable information about alternative schools as described above, it can take two additional steps towards improving accountability. Below, we describe these next two steps—identifying schools that are not meeting expectations and intervening to ensure they improve.
Develop Processes for Identifying Underperforming Alternative Schools. Before the state can intervene to provide assistance to alternative schools that are not meeting expectations, it needs to set clear state–level performance expectations and determine how it will use performance data to measure progress towards those expectations. While the state still is in the process of defining exactly how it will identify which districts and COEs need support to make improvements, we recommend that alternative school performance be an explicit component of this new process. If the rubric that the SBE will adopt by October 2015 does not sufficiently include alternative schools, the Legislature could take action to include them at that time.
Ensure That Poor Performance Triggers State Support and Intervention. Once there is a framework in place for identifying underperforming alternative schools, we recommend the Legislature ensure that underperforming alternative schools get support or intervention, as deemed appropriate. Given the evaluation rubrics are supposed to be linked to the goals and data in the LCAP, we believe adopting our recommendations for (1) improving the types of data reported for these schools, and (2) highlighting that data within the LCAP, are good first steps towards this goal. We recommend, however, that the state closely monitor whether the fledgling system ultimately has the necessary components to ensure sufficient oversight, support, and intervention for these often overlooked schools.
The state has both an interest and a responsibility to monitor the performance of all of its public schools to ensure they are effectively serving students, and to assist and intervene when desired outcomes are not being achieved. As detailed throughout our report, however, we believe that three reasons make developing more robust state oversight of alternative schools especially critical. First, alternative schools serve some of the most vulnerable students in the state—these schools often represent the state’s last chance to reengage and support students who are on the verge of permanently dropping out. Second, a frequently changing student population often makes it hard to develop strong constituencies to advocate for prioritizing these schools at the local level, increasing the importance of the state’s oversight role. Third, the accountability reports the state traditionally has used to monitor school performance are poorly matched to the unique goals of alternative schools, leaving the state, COEs, districts, and communities without the information necessary to gauge how effectively alternative schools are serving students.
We view the recommended changes to accountability outlined in this report as important next steps for improving alternative education in the state. Adopting our recommended changes to state–required performance data and accountability reports would provide better information about how alternative schools serve students and allow the state to identify schools in need of added support. Once underperforming schools are identified, the state will need to make clear how these schools will be supported and how the state ultimately will intervene if progress is not made.