 Legislative Analyst's Office
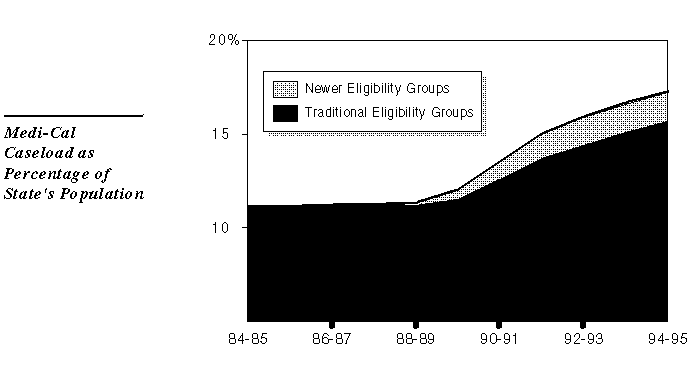
In 1994-95, about 5.6 million persons will be enrolled in the Medi-Cal Program in an average month. This represents a 60 percent increase since 1989-90, when the recession began in California. The Medi-Cal caseload has increased at nearly five times the rate of the state's overall population growth during the last five years.

As the figure shows, about 17 percent of Californians are eligible for Medi-Cal in an average month--more than one in six state residents. This percentage is significantly higher than at any point during the 1980s. Roughly one-fifth of the caseload increase since 1988-89 has resulted from recent federal and state legislation which has expanded eligibility to "newer eligibility groups" including newly legalized and undocumented persons, and pregnant women and infants in families with incomes up to 200 percent of the poverty level.
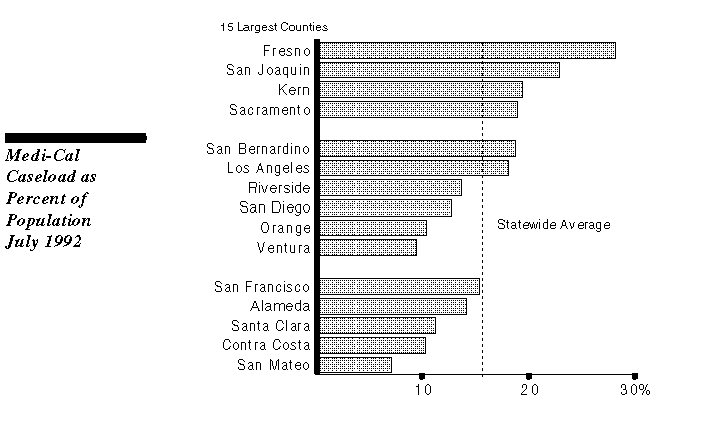
Medi-Cal caseload concentration varies significantly across California. As the figure shows, among the state's 15 largest counties, those in the central valley have the highest proportion of their population enrolled in Medi-Cal. Los Angeles and San Bernardino Counties also have above-average concentrations.
Not all poor persons are eligible for Medi-Cal. Federal law requires indigent persons to meet other eligibility requirements as well, such as having a disability or residing in a household with an absent or unemployed parent. As a result, Medi-Cal covers more women (60 percent of the caseload) than men, and more children and elderly than nonelderly adults. Nearly two-thirds of Medi-Cal recipients are under 21 or over 65 (about 54 percent and 11 percent of caseload, respectively).
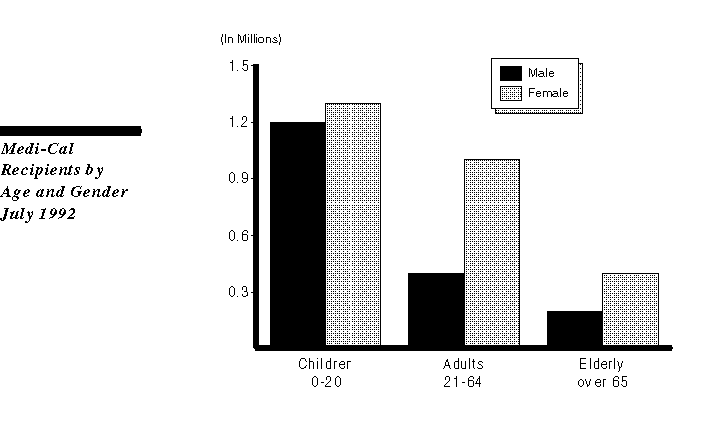
As the figure shows, two-thirds of the males who are eligible for Medi-Cal are children. Among adults and the elderly, nearly 70 percent are female. The large proportion of adults who are female is largely attributable to eligibility requirements, including broader eligibility for pregnant women. Among the elderly, the higher proportion of women probably reflects longer life spans for women than men.
Average Medi-Cal costs vary widely on a per-person basis across eligibility categories.
The elderly and disabled accounted for a majority (57 percent) of Medi-Cal expenditures in 1993-94, although they represented about one-fifth of the program's caseload. This pattern is particularly strong for some types of services. For example, the elderly and disabled account for over 70 percent of expenditures for prescription drugs. This is due, in part, to the interaction between Medi-Cal and the federal Medicare program, which provides hospital and physician services for the elderly and disabled, but not prescription drug coverage.
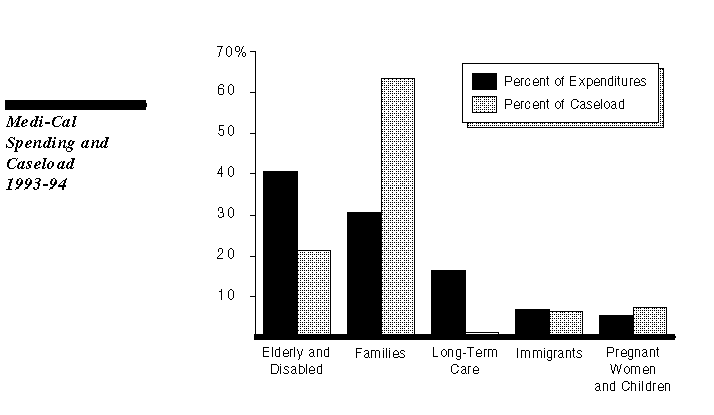
Long-term care recipients are the most expensive group of Medi-Cal recipients on a per-case basis. As the figure shows, they account for 1 percent of the Medi-Cal caseload and 17 percent of expenditures.
In contrast, families with an absent or unemployed parent (primarily AFDC recipients) represent over 60 percent of Medi-Cal caseload, but about 30 percent of expenditures.
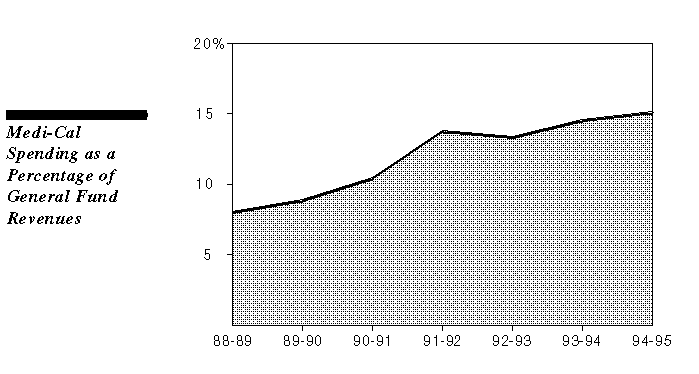
The Medi-Cal Program has grown at an annual rate significantly above the rate of growth of the state's economy. As a result, the share of General Fund revenues devoted to support of the program has nearly doubled over the last six years--from 8 percent of revenues in 1988-89 (before the recession began) to an estimated 15 percent of revenues in 1994-95. This trend reflects both growth in the program and the general flattening of revenues that has characterized the last few recessionary fiscal years.
In rough terms, about half of the program's expenditure growth has been due to caseload growth, while the remainder is due to higher costs for medical services-- especially hospital inpatient and nursing home stays and prescription drug costs. As regards caseload growth, the figure shows that much of this growth has been among families with absent or unemployed parents (primarily AFDC recipients).
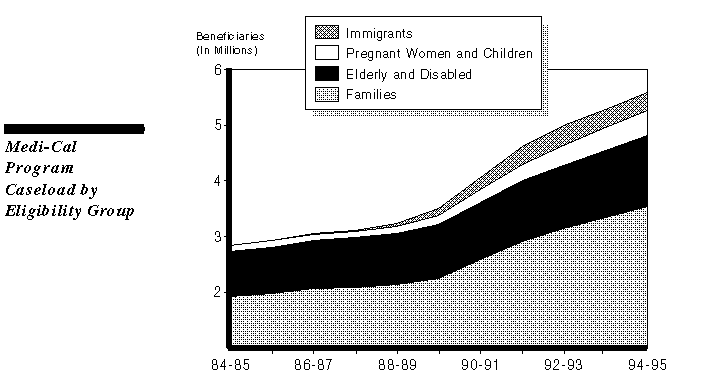
It is important to note that while the caseload for AFDC families has grown most dramatically, expenditures have increased at a faster rate for services to the aged, blind, and disabled (primarily SSI/SSP recipients), as the figure on the next page shows.
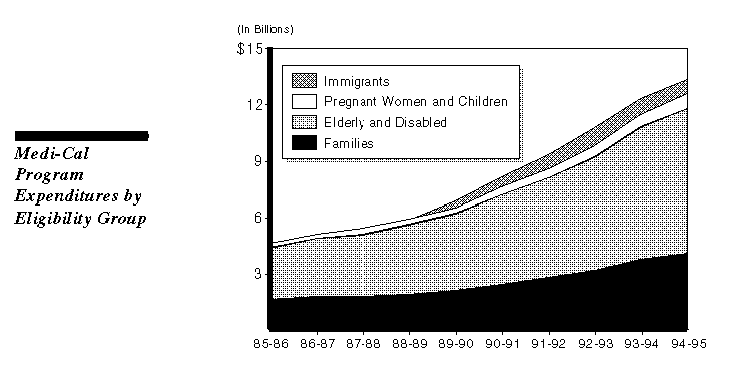
While expenditures for families increased by 150 percent over the last ten years, expenditures for aged, blind, and disabled individuals grew by 177 percent--despite significantly slower caseload growth for this group. This reflects higher utilization of Medi-Cal services by the aged and disabled and the fact that the aged and disabled tend to use those services that have received reimbursement rate increases (hospital inpatient and nursing home stays and prescription drugs).
Over the last seven years, total Medi-Cal expenditures have nearly tripled. A significant portion of the increase since 1990-91 is due to financing arrangements that have allowed California to increase federal funding for counties, hospitals that serve a large number of indigent patients, and the In-Home Supportive Services Program. These new funds, which are projected to be about $2 billion in 1994-95, are shown as increases in Medi-Cal expenditures, although a substantial portion is not used to support services provided to Medi-Cal recipients. Instead, the funds are used by counties for services to non-Medi-Cal-eligible indigent persons.
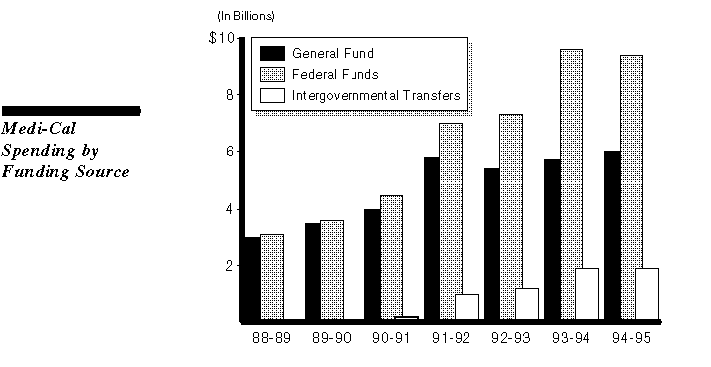
In addition, these funds have allowed the state to reduce General Fund expenditures in Medi-Cal and other programs. For example, the state requires counties to transfer to the state more than the amount required to match the federal funds, in effect retaining a share of these funds and thereby reducing the General Fund cost for Medi-Cal. This approach will reduce General Fund spending for Medi- Cal by $439 million, or about 7 percent, in 1994-95.
Accordingly, although federal funds must be matched, the state has relied upon "intergovernmental transfers" to increase the flow of federal money to the state through the Medi-Cal Program--without increasing General Fund expenditures.
Among the 15 largest states, California has the highest proportion of residents who rely on Medicaid (Medi-Cal in California) for their health care. This is due, in part, to the state's choice to provide Medi-Cal coverage to groups that are not required by federal law to receive services. In general, these "optional eligibility categories" are families with an absent or unemployed parent and aged, blind, or disabled individuals who are poor, but not so poor as to qualify for public assistance through the AFDC or SSI/SSP programs. Over 800,000 persons will be enrolled in Medi-Cal in an average month under these optional categories during 1994-95.
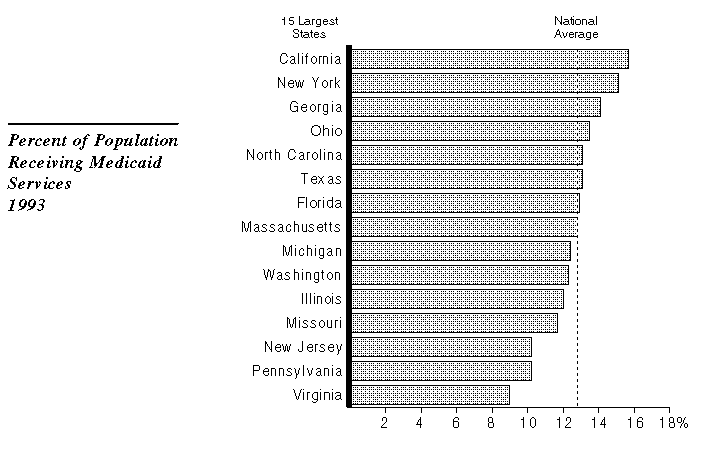
In addition, the high concentration of undocumented and newly legalized persons in California (as compared to other states) increases the Medi-Cal caseload in proportion to the state's population. About 300,000 persons are enrolled in Medi-Cal in an average month from these groups.
In contrast to the high proportion of state residents served by Medi-Cal relative to other states, the per-person cost of California's program is lowest among the 15 major states--and about $1,000 per person below the U.S. average.
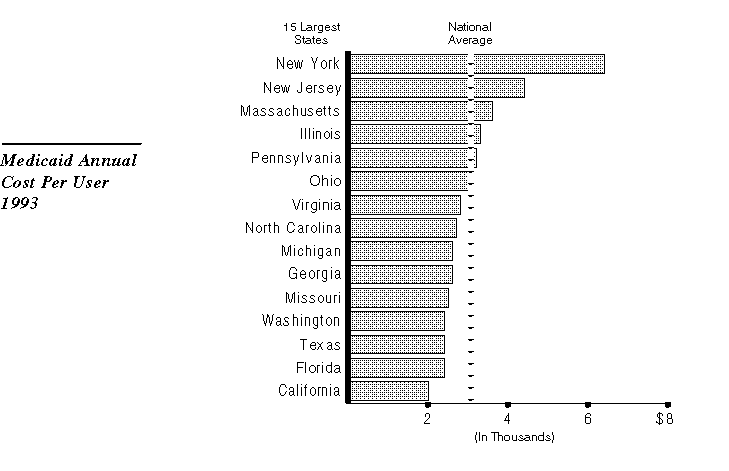
California's relatively low per-person cost is due to a number of factors, including:
In addition, Medi-Cal per-case costs have increased at a rate slightly below that of the national average.
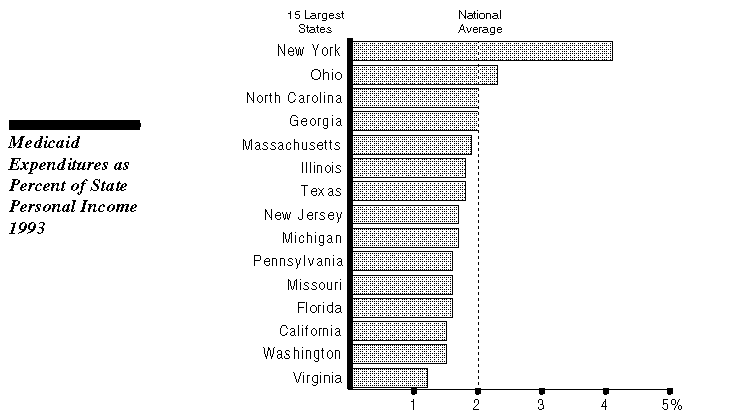
Finally, the cost of California's Medi-Cal Program as a percentage of the state's personal income is well below the national average. California ranks thirteenth among the 15 largest states on this measure. This reflects the state's relative affluence as measured by per capita personal income, and the low cost-per-case figures discussed above.
