 Legislative Analyst's Office
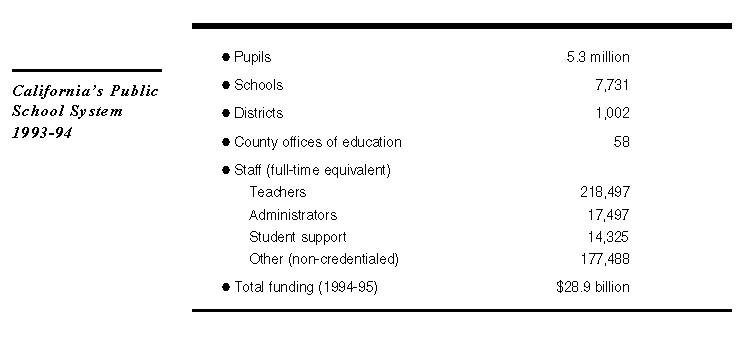
California's school system is the biggest in the nation, with 5.3 million pupils and funding of $28.9 billion in 1994-95.

Texas has the next largest school system, with 3.5 million pupils and 6,100 schools.
Furthermore, the enrollment has grown rapidly over the past ten years--1.2 million pupils since 1983-84. This increase represents more pupils than are currently served by 42 other states.
The state faces unique challenges in developing and maintaining facilities and services for a pupil population that is growing so rapidly.
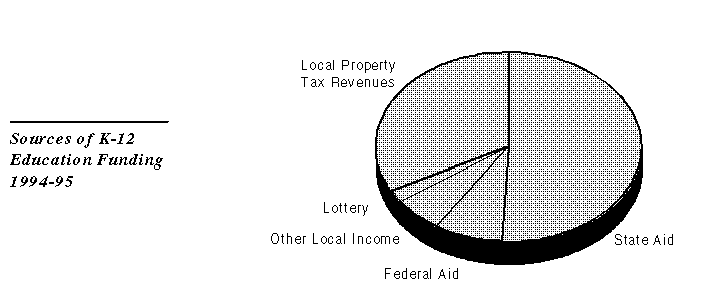
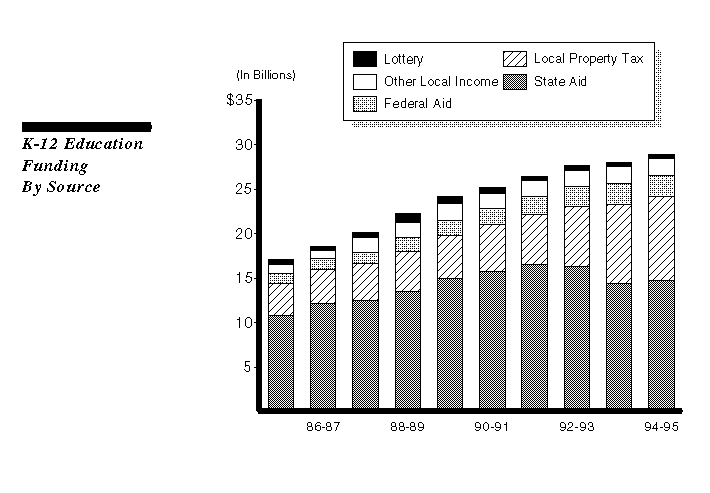
Just over half of school funding comes from state aid. One-third comes from local property tax levies. Other sources are federal funds, other local income, and the lottery. The lottery provides about 2 percent of total funding.
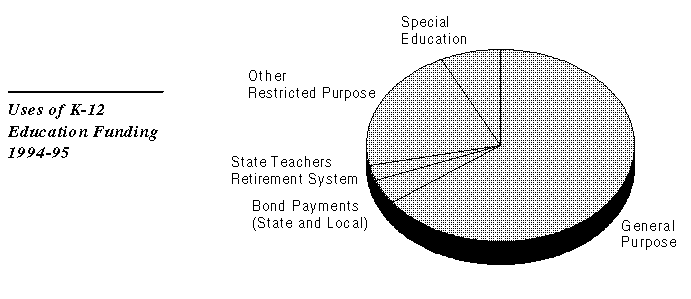
About two-thirds supports general purposes--providing basic education for all pupils. The remaining third is restricted to various special purposes, such as special education, payments to the State Teachers Retirement System, and debt service on school construction bonds.
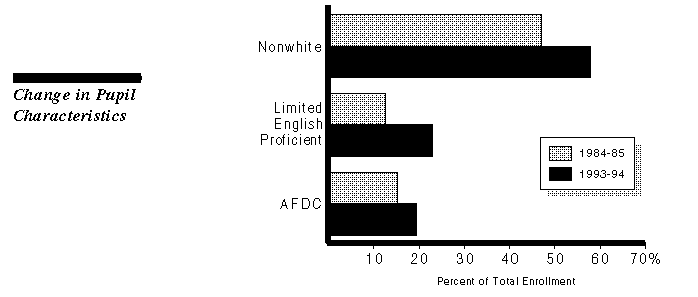
California's pupils are now over 50 percent nonwhite. Almost a quarter of pupils are limited English proficient--double the proportion in 1984-85. Almost 20 percent of pupils now receive AFDC, compared to 15 percent in 1984-85.
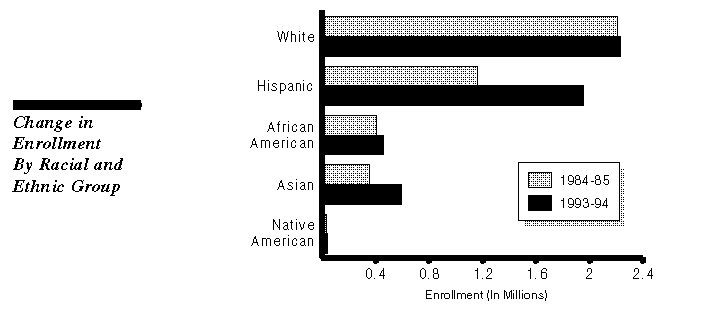
Most of the growth in California's pupil population since 1984-85 has occurred in the Hispanic and Asian groups.
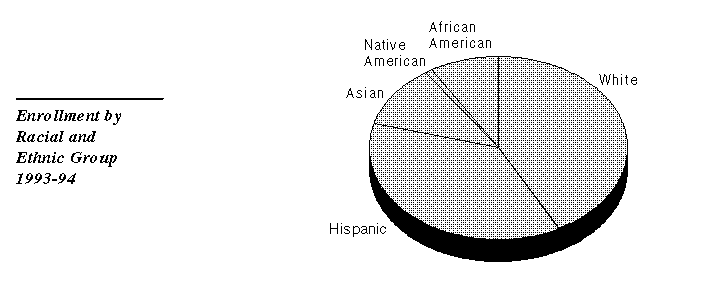
The proportion of Hispanic pupils (37 percent) is now approaching the proportion of white pupils (42 percent). The proportion of Asian pupils (11 percent) has surpassed the proportion of African-American pupils (9 percent).
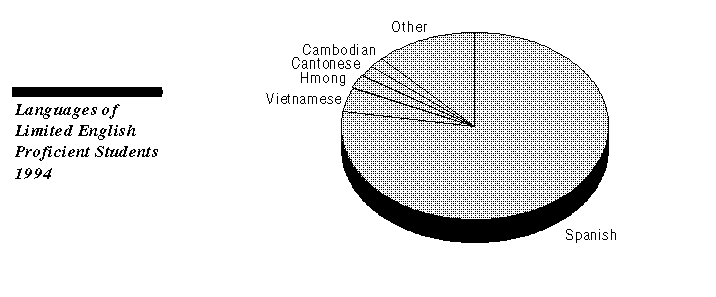
Among limited English proficient pupils, over three-quarters speak Spanish. Vietnamese is the native language for the next largest group, followed by Hmong, Cantonese and Cambodian. Over 100 languages are spoken by California school children.
The two largest funding sources for schools are state aid and local property tax levies. Since 1985-86 support from state funds has grown at a much slower rate (36 percent) than support from local property tax levies (163 percent). This is due to a shift of $3.5 billion in local property tax revenues to schools from other local government entities in 1992-93 and 1993-94.
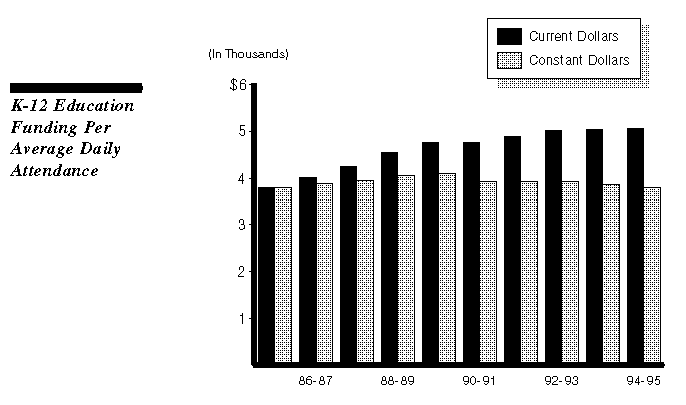
Funding per pupil has increased since 1985-86. On an inflation-adjusted (constant) basis, however, it has declined 7.3 percent since 1989-90.
Because per-pupil funding has not kept pace with inflation, school districts have faced shortfalls in developing their budgets the past several years. They have reported using the following strategies to cope with these shortfalls:
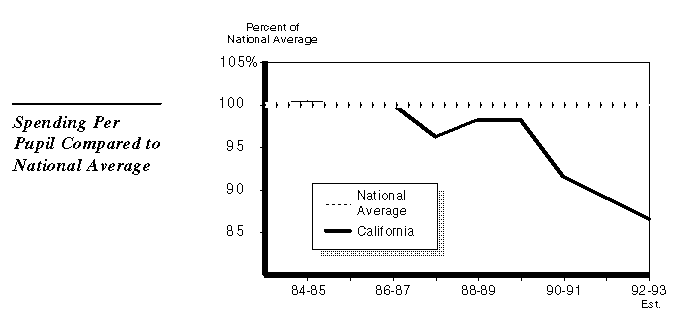
In 1983-84, California's spending per pupil was about equal to the national average. In 1992-93, it is estimated that California's spending per pupil was about 13 percent below the national average.
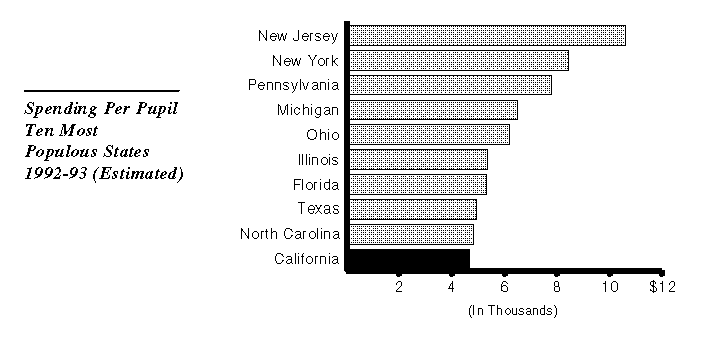
California's spending per pupil is now the lowest among the ten most populous states.
PUPIL POPULATION
Increasingly Diverse and Has Greater Needs
FUNDING TRENDS
State Aid a Reduced Share of School Funding
Inflation-Adjusted Funding Per Pupil Has Declined Since 1989-90
California's Spending Per Pupil Has Dropped Below The National Average
