 Legislative Analyst's Office
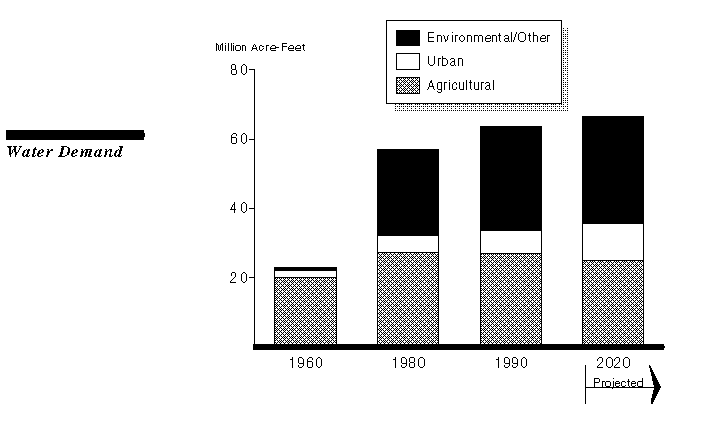
Urban development, agriculture, and environmental needs (such as endangered species) all place demands on California's water supply. In 1990, the average annual developed water supply was sufficient to meet demand--that is, water supply and demand were roughly in balance. Given current trends, however, water demand is projected to exceed supply by 2020.
In 1993, the Department of Water Resources projected that demand would grow to over 66 million acre feet by 2020, exceeding projected supply by between 2.2 and 4.2 million acre feet annually. Addressing this projected shortfall between supply and demand, and allocating water efficiently, are major policy challenges for the coming decades.

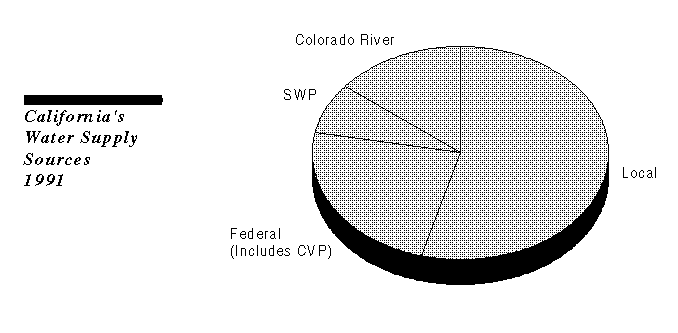
The state's developed water supply comes from a diverse mix of sources. The single largest water source is local sources of ground water and surface water. Other important sources of developed water include the Central Valley Project (CVP), operated by the federal government, and the Colorado River. The State Water Project (SWP) provides about 8 percent of California's developed water supply.
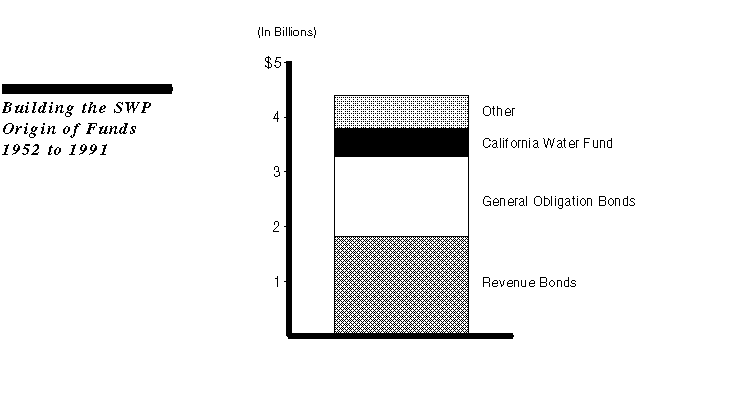
From 1952 to 1991, funding to build the SWP totaled about $4.4 billion. The California Water Fund--which is funded with project revenues and tideland oil revenues-- provided about $508 million of that total. The remainder of the funding came from revenue bonds and general obligation bonds. When these bonds are finally paid off, it is estimated that contractors who receive water from the SWP will have paid for about 96 percent of the cost of building the project. The remainder is paid by the state, to cover fish and wildlife enhancements associated with the SWP, and the federal government, primarily for flood control benefits.
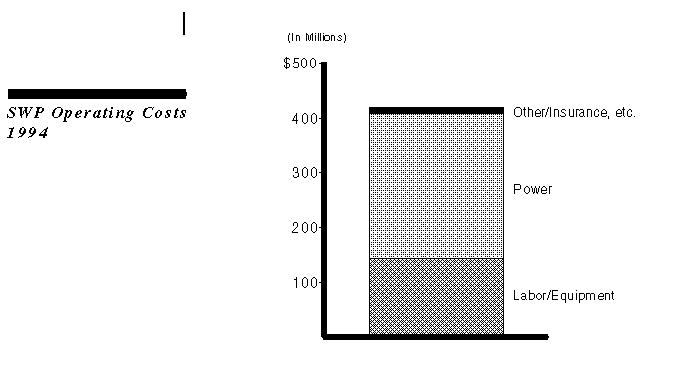
For 1994, costs to operate and maintain the SWP will total about $416 million. Most of these funds pay for labor and equipment, and for the cost of power to operate pumping stations. As with the cost of construction, fees paid by contractors cover about 96 percent of the annual cost of operating the SWP.
Water supply in California does not naturally occur where demand is highest. Much of California's rainfall occurs in the North, while much of the demand for water is in the South. As a result, the SWP is a complex system for storing and transporting water throughout the state, as shown on the map.
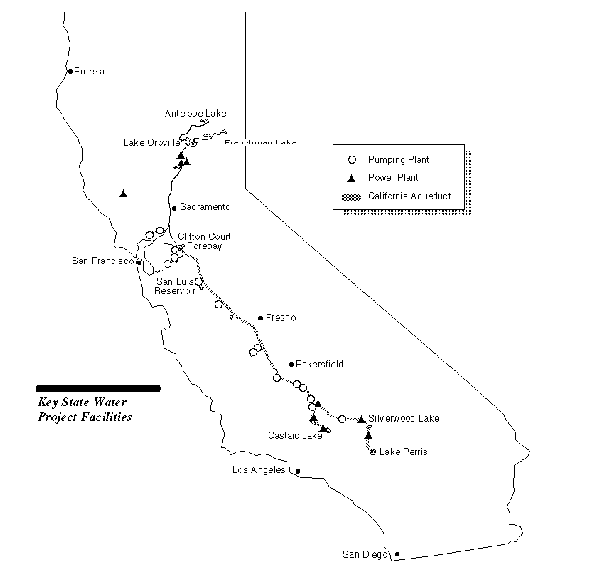
The need to store and transport large quantities of water creates its own challenges to formulating statewide water policy. For example, water being transported south must first make its way through the Sacramento-San Joaquin Delta, which has been a focal point of controversy for many years. In addition to supplying water, the Delta provides habitat for several endangered or threatened species, and an estimated 80 percent of the state's commercial fishery species live in or migrate through the Delta.
There are several options for allocating scarce water. These include using markets to promote water transfers, building new facilities, encouraging water conservation, and increasing water prices to manage demand. All of these approaches have been used to date in California, some extensively (such as building new facilities) and others to a lesser degree (such as demand management and water transfers).
Each of these options has advantages and disadvantages. Building new facilities, for example, increases the supply of developed water but entails costs for capital outlay and raises environmental concerns. Finding the optimum mix of options requires an analysis of the pros and cons of each option and the circumstances under which each option is most appropriate.

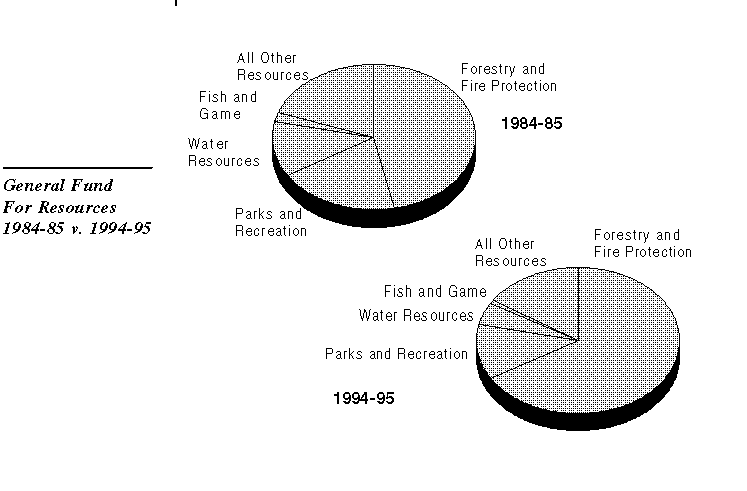
In terms of General Fund support, the budget of the Department of Forestry and Fire Protection (CDFFP) is one of the fastest growing under the Resources Agency. The CDFFP takes a bigger portion of the General Fund pie for Resources departments in 1994-95 (67 percent) than in 1984-85 (47 percent).
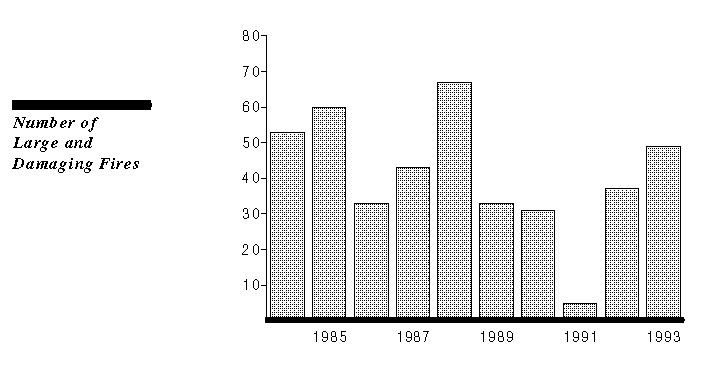
Over the last ten years, the total number of wildfires annually in California has fluctuated between about 7,000 and 8,000. The number of those fires which have turned into large and damaging fires--which CDFFP defines generally as fires over 300 acres--has tended to remain steady. The total acreage burned in those fires has also remained relatively steady.
Although the number of large wildfires has not increased, the total cost of wildfire protection in California has grown significantly over recent decades. This, along with cuts in General Fund provided to other Resources departments, are the primary forces driving the increase in CDFFP's share of Resources General Fund.
The most significant rate of increase in the cost of fire protection has been in emergency fire suppression. The CDFFP incurs these costs, which can fluctuate widely from year to year, in fighting large fires or in keeping field staff and equipment at full strength during times of high fire activity. When adjusted for inflation (1985-86 dollars), the cost of emergency fire suppression (not shown in chart) increased from 1985 to 1991 by about 12 percent or $3.4 million.
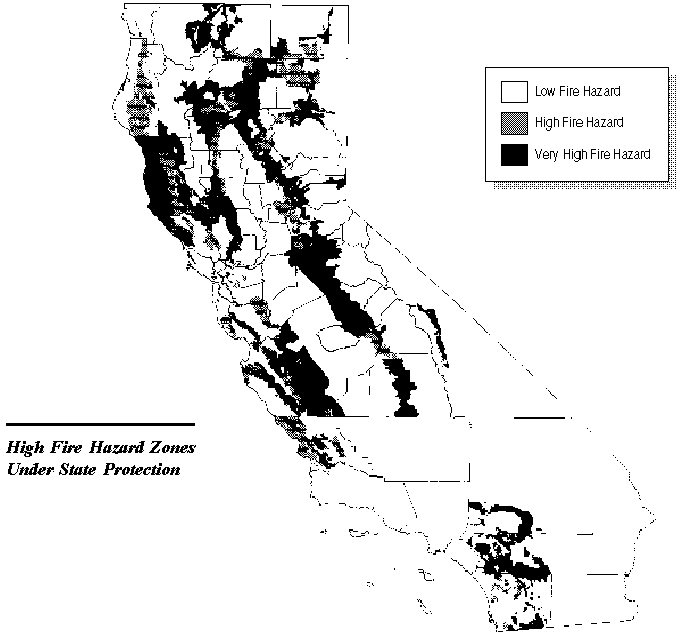
Several factors account for the increase in emergency fire suppression expenditures, including population growth in wildland areas. Development in wildland areas increases the cost of fighting wildfires, as CDFFP must devote additional resources to protecting structures. For example, the Gold Country--a portion of the Sierra Nevada foothills subject to frequent wildland fires--is the fastest growing part of the state, with an annual population increase of 2.7 percent.
FIRE PROTECTION
CDFFP's Share of General Fund Support Has Grown Since 1984-85
The Number of Large Wildland Fires Has Fluctuated but Overall Has Not Increased
Rising Costs of Fire Protection Are Driving the Increase
In General Fund Support of CDFFP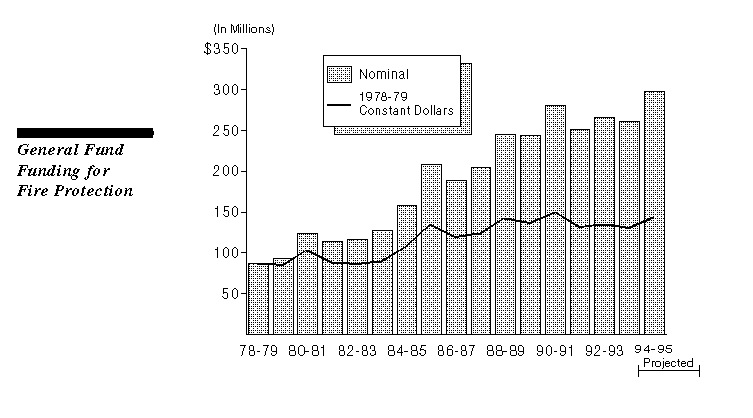
Some High Population Growth Areas Are Prone to Frequent Wildland Fires
