 Legislative Analyst's Office
State revenues provide the monies that pay for state expenditure programs. Thus, revenue developments are an important determinant of the state's budgetary condition and its ability to provide public services.
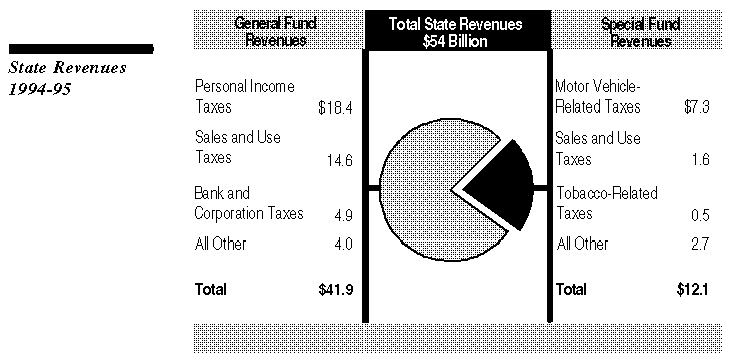
Total state revenues are estimated at $54 billion for 1994-95. Of this, nearly 80 percent are General Fund revenues and about 20 percent are special fund revenues.

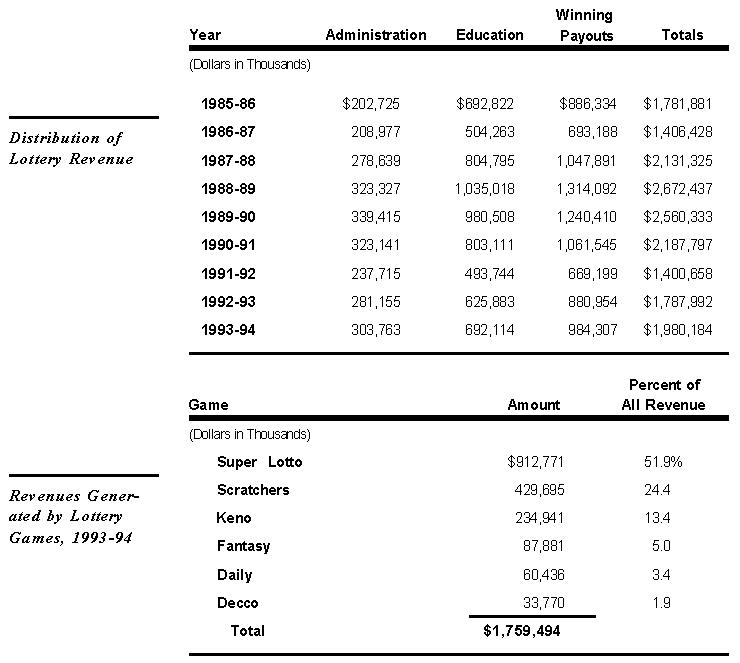
It is estimated that state lottery revenues will total $675 million in 1994-95. These revenues do not appear as either General Fund or special fund revenues because they are directly allocated for educational purposes as constitutionally mandated. (Additional information on lottery revenues appears at the end of this section.)
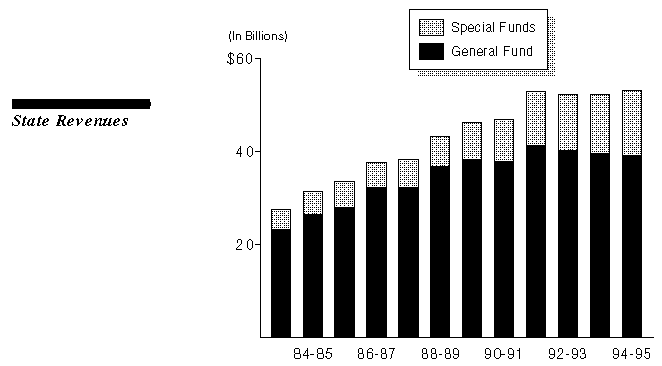
Total state revenues have been basically flat during the past four years, due to the recession and subdued economic recovery.
During the past 12 years, however, total revenue growth has averaged 6.1 percent annually. If adjusted for inflation, the average annual growth rate has been 2.6 percent.
The average growth rate in current dollars during this period has been 4.9 percent for General Fund revenues and 11.2 percent for special fund revenues. Thus, special fund revenues have grown much more rapidly than General Fund revenues. This largely reflects various law changes, such as increases in vehicle- related levies, new cigarette taxes that are deposited into special funds for health- related purposes, and sales tax revenues to new special funds allocated to local governments.
During the past six years, General Fund revenue growth has averaged a very modest 1.5 percent annually.
Although average growth has been relatively slow for both personal income taxes (1.7 percent) and sales and use taxes (1.6 percent), the greatest weakness has been in bank and corporation tax revenues. These experienced an absolute decline over the period.
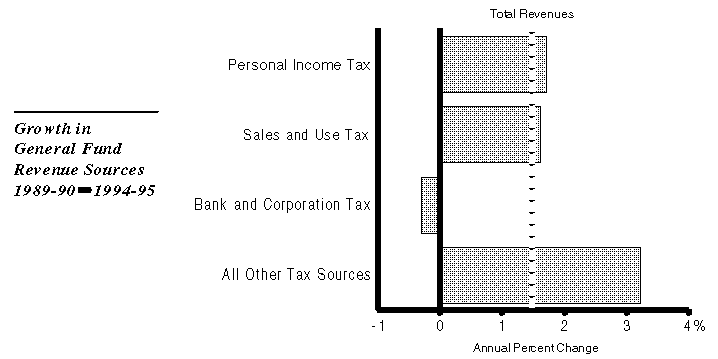
The "all other" revenue category rose at an above-average pace. This had only a limited effect, however, on total revenue growth because of the relatively small dollar amount of these revenues.
The sluggish performance of corporation tax revenues in recent years is traceable to lack of growth in the corporate tax base.
The ratio of corporate profits to personal income is one indicator of how strong the corporate tax base is relative to the overall economy. This ratio is highly cyclical, declining when the economy weakens and rising when the economy strengthens.
The ratio hit a peak of nearly 11 percent in 1978, and was close to 10 percent in 1987. Recently, however, the ratio has been at an all-time low. In addition, although the ratio usually turns upward fairly quickly once it hits bottom, for the past four years there has been little improvement.
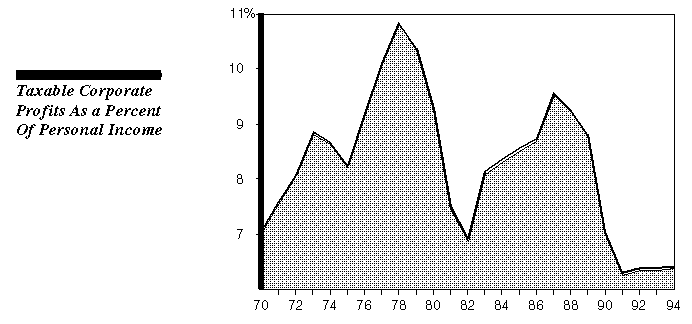
There are a number of factors which may explain the recent softness in corporate profits. These include the recent recession, changes in industry mix, taxpayer noncompliance, business relocations, certain tax law provisions, and developments involving the way in which business income of multistate and multinational corporations is apportioned in California.
The sales tax in California is generally levied on sales of tangible personal property subject to specified exemptions. Services, for example, are generally not taxed. In recent years, sales tax revenue growth has been very modest.
Taxable sales as a percent of personal income generally has followed a downward trend over the past 15-plus years.
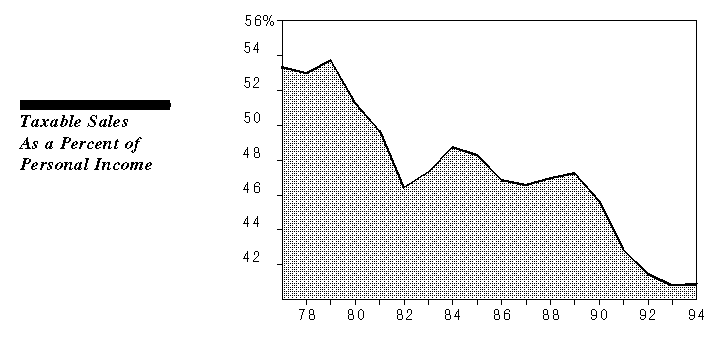
According to a recent study by the Federation of Tax Administrators, California taxes fewer services than most states. For example, California is one of 15 states with a general sales tax that applies to 30 or fewer of 164 specifically enumerated services (California taxes 19).
The personal income tax is California's largest tax and accounts for nearly 45 percent of General Fund revenues. For 1994, it is expected that over 8 million tax returns will be filed, with a combined tax liability of nearly $18 billion.
California has a highly progressive income tax structure, meaning that as one's taxable income rises, so does one's average tax rate.
In 1992, the top 10 percent of taxpayers paid nearly 60 percent of all tax liabilities, and the top 1 percent of taxpayers paid almost 30 percent of all liabilities.
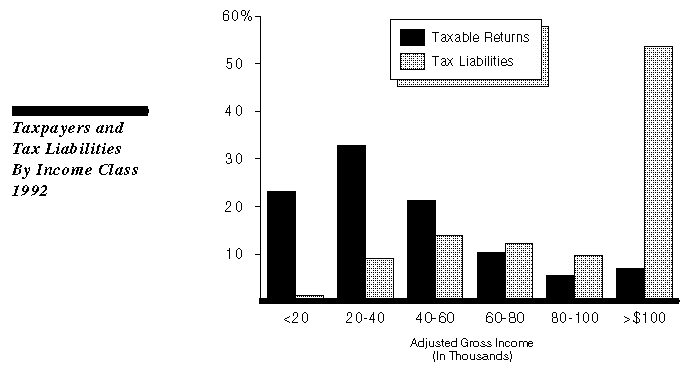
The progressivity of the tax structure, when combined with the distribution of taxable income, determines the distribution of California's personal income tax burden.
Tax expenditure programs (TEPs) are the various tax exclusions, exemptions, preferential tax rates, credits, and deferrals which reduce the amount of revenues collected from the state's "basic" tax structure.
The benefits that TEPs convey to businesses and individuals generally are similar in their effects to direct expenditure programs. However:
There currently are nearly 300 individual TEPs. This includes about 200 state- level TEPs and over 70 local property tax TEPs that can impose state costs because the state backfills the lost local revenues.
The costs of TEPs are measured in terms of foregone tax revenues. State-level TEPs cost $20 billion in 1991-92. This was equivalent to 37 percent of the direct expenditure budget.
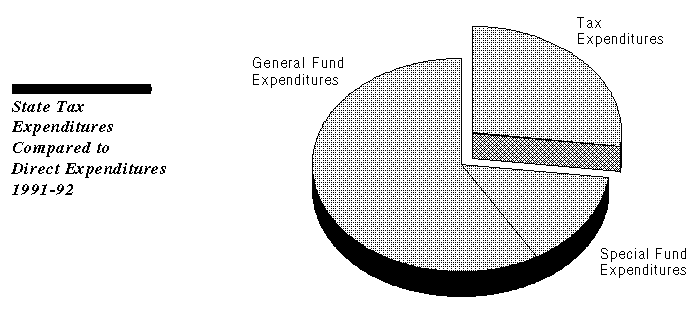
Personal income tax TEPs amounted to over $13 billion in 1991-92, or two- thirds of the cost of all state-level TEPs. Sales and use tax TEPs accounted for another 20 percent, and other taxes for the remaining 12 percent.
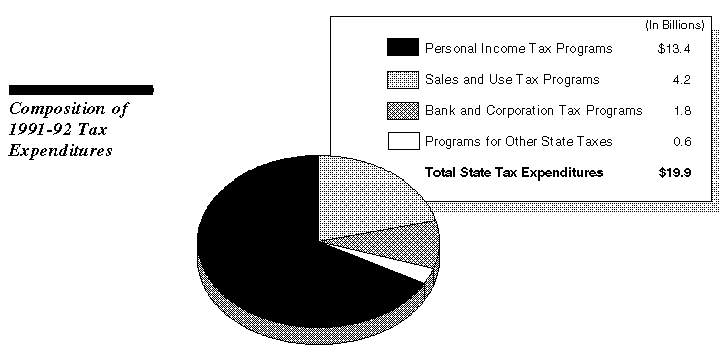
Personal income tax. The five largest TEPs amounted to $7.8 billion, or 57 percent of the total for this tax. These are deductions for mortgage interest expenses, income exclusions for employer and employee contributions to pension plans, employer contributions to health plans, income exclusion of capital gains on the sale of residences, and charitable deductions.
Sales and use taxes. The two largest TEPs amounted to $3.2 billion, or 77 percent of the total for this tax. These are exemptions for food products and for gas, electricity, water, steam, and heat.
Bank and corporation taxes. The five largest TEPs amounted to $1.5 billion, or 85 percent of the total for this tax. These are Sub-Chapter S corporations; water's-edge filing status; research and development tax credits; tax- exempt organizations; and expensing of exploration, development, research, and experimental costs. Net operating loss deductions were suspended for 1991 and 1992.
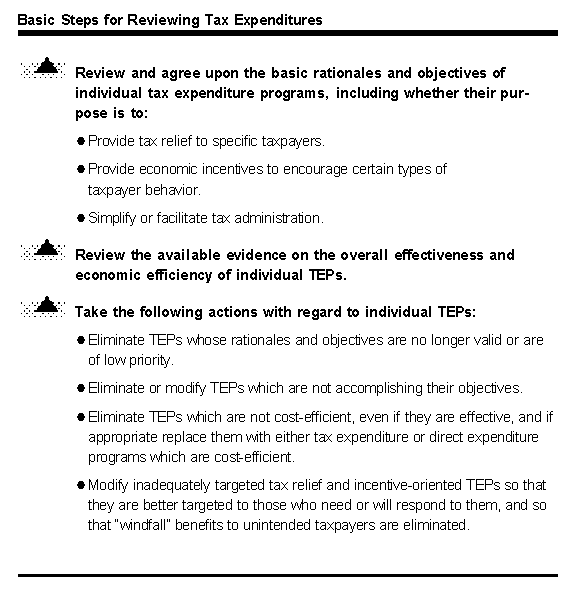
Because TEPs are not regularly reviewed as part of the annual budgetary appropriations process, several problems can occur. For example, TEPs may remain in effect which are not the most effective or efficient way of attaining their objectives, or which may be in direct conflict with other legislative goals.
Given this, there are several action steps that the Legislature can take regarding TEPs.
Since its inception in 1985, lottery wagering has totaled $18 billion and the State Lottery has generated $6.6 billion for education programs.
By law, not less than 50 percent of lottery revenue is paid out in winnings, at least 34 percent on education, and no more than 16 percent on administration.
As indicated below, in 1993-94 the Super Lotto game generated over half of State Lottery revenues. Scratchers were the next most popular game, producing about a quarter of State Lottery revenues.
