 Legislative Analyst's Office
This section provides a broad fiscal overview of state and local governments in California. This information helps to provide a perspective on the more detailed information on state and local government finances that appears throughout this document.
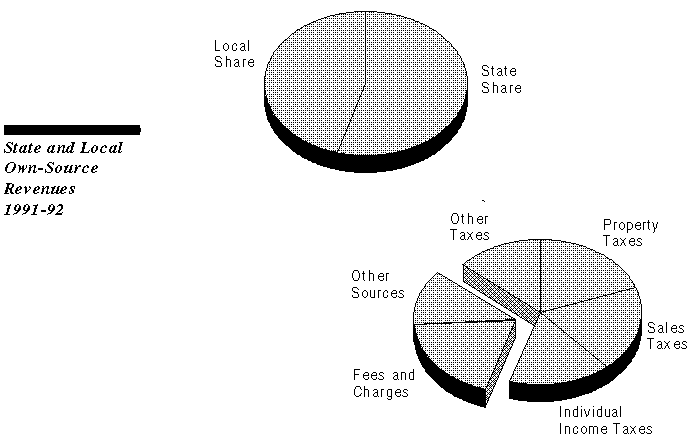
California state and local own-source revenues (excluding utility-related revenues) totaled $105 billion in 1991-92, according to the U.S. Department of Commerce. These revenues grew at an annual average rate of 9 percent over the preceding ten years.
The state's total own-source revenue is somewhat more than the local share. In terms of types of revenues, no single source predominates. Tax collections represent two-thirds of combined state and local own-source revenues, while fees raise almost as much revenue as the property tax and slightly more than the sales tax.

Expressing state and local revenue burdens per $100 of personal income is helpful because it implicitly adjusts for such factors as interstate differences in income levels.
The U.S. Department of Commerce reports that in 1991-92 California was an average state in terms of revenues raised per $100 of personal income. California's level of $16.60 was only slightly higher than the national average of $16.35.
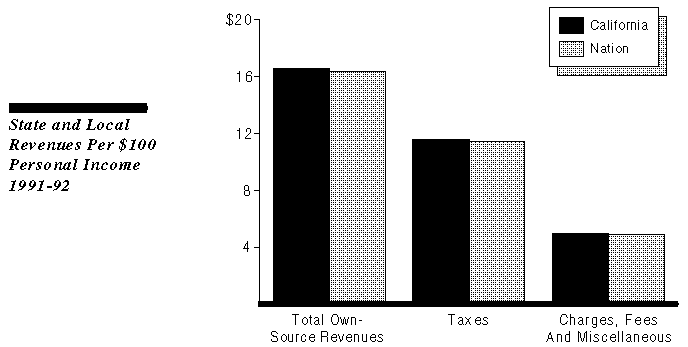
With regard to the components of total revenues ("taxes" and "charges, fees and miscellaneous" revenues), California was also about average.
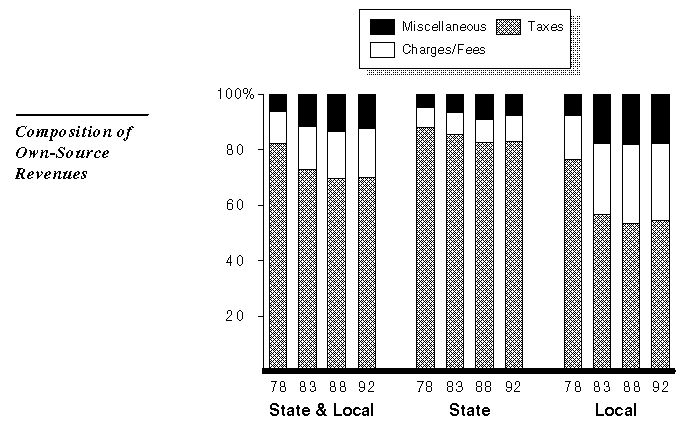
The figure shows the composition of state and local own-source revenues over the period 1977-78 through 1991-92, based on U.S. Department of Commerce data.
State and local tax revenues as a percent of own-source revenues fell sharply following Proposition 13. In 1977-78, taxes accounted for 82 percent of revenues but their share had fallen to 73 percent by 1982-83. The tax share fell further during the 1980s, and since has remained relatively unchanged. It was 70 percent in 1991-92.
In contrast, the share of fees and charges has increased since Proposition 13 and is well above 1977-78 levels, especially at the local level.
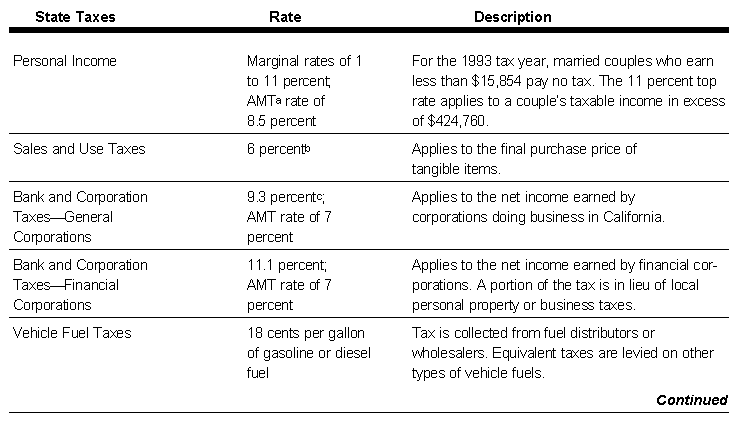
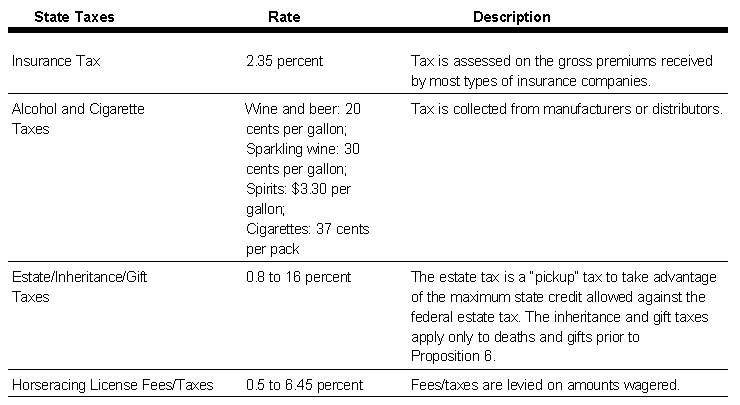
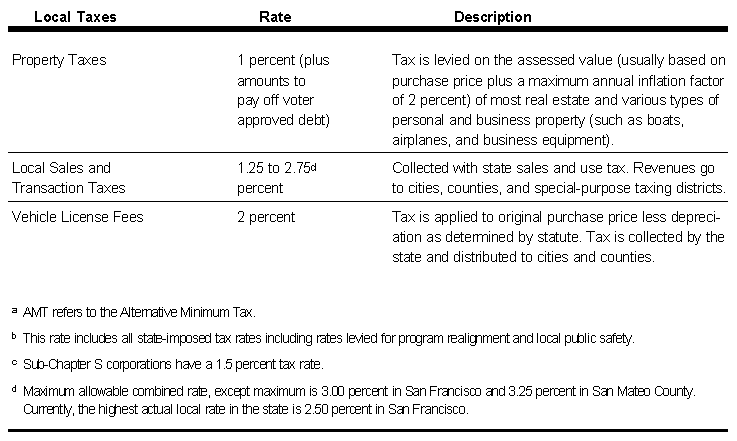
Taxes are the largest source of income for California's state and local governments. The figure summarizes the major taxes levied in California at both the state and local levels.
At the state government level:
At the local government level, property taxes are by far the largest source of tax revenues.
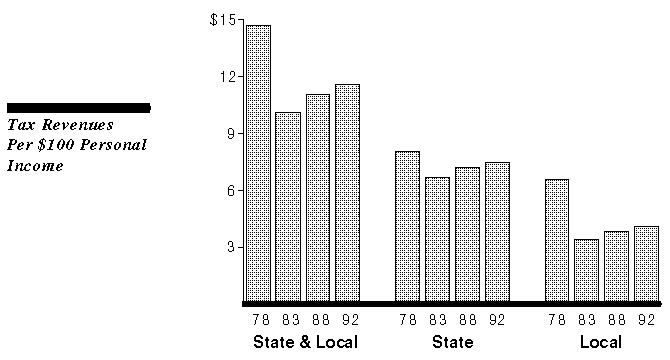
State and local taxes per $100 of personal income have risen somewhat since the early 1980s after falling sharply due to Proposition 13, based on data for the period 1977-78 through 1991-92 from the U.S. Department of Commerce.
Despite these increases, however, taxes relative to personal income remain well below pre-Proposition 13 levels. This is especially true at the local level.
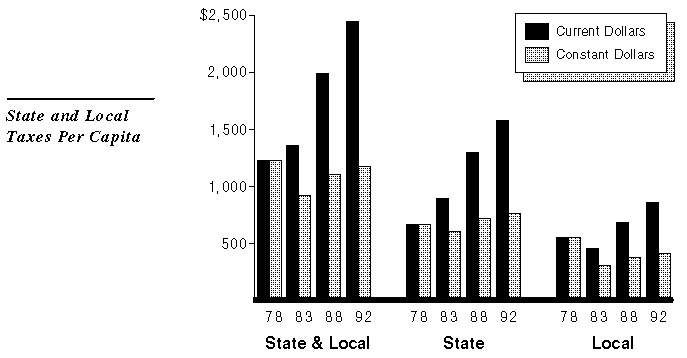
All state and local governments generally experience increases in per capita taxes over time, due to a variety of factors such as inflation. This has been true for California.
After adjustment for inflation, however, total state and local per capita taxes have risen following their Proposition 13 drop, but in 1991-92 were still below their 1977-78 level. State taxes were up slightly and local taxes were down by a somewhat greater amount.
