In this chapter, we present our General Fund expenditure projections for 1995-96 through 1997-98.
Our projections are based on the following methodology and assumptions:
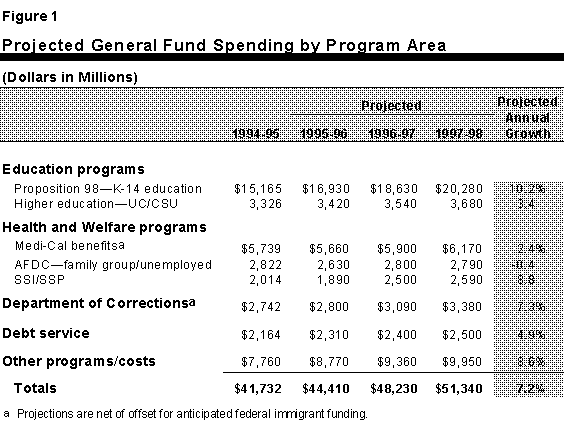
Figure 1 presents our General Fund spending projections. As shown, projected total General Fund spending grows from $41.7 billion in 1994-95 to $44.4 billion in 1995-96, $48.2 billion in 1996-97, and $51.3 billion by 1997-98. This amounts to an annual average growth rate between 1994-95 and 1997-98 of 7.2 percent as shown in the figure, with total spending in dollar terms increasing by $9.6 billion.

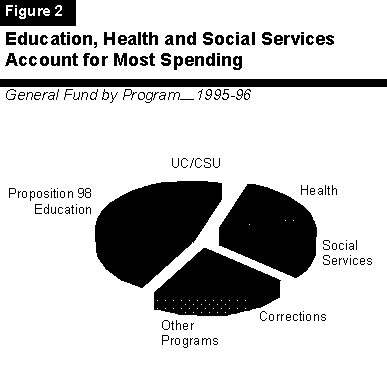
Figure 2 illustrates the current allocation of General Fund spending by program area. As shown, more than three-fourths of General Fund spending is devoted to education, health, and social services. Consequently, spending trends in these programs have a large impact on overall spending trends.
In addition to Proposition 98 spending, three other program areas will have relatively rapid spending growth:
We next discuss in greater detail our projections for major program areas.
The major health and welfare programs are the AFDC program, the SSI/SSP, and the Medi-Cal program.
The Spending Forecast. General Fund spending in 1995-96 for AFDC-FG&U is estimated to be $2.6 billion--a reduction of 6.8 percent from the prior year, due primarily to grant reductions. General Fund spending is projected to increase by 6.5 percent in 1996-97 and remain at approximately the same level in 1997-98. In comparison, expenditures increased by approximately 2.4 percent annually in 1992-93 and 1993-94.
Key Forecast Factors. Although the AFDC caseload has recently begun to decline and this modest decline is projected to continue into the near future, increases in grant levels that are required by current law result in increased AFDC spending in 1996-97 and 1997-98.
For 1995-96, we estimate that spending for AFDC will be $11 million below the Budget Act appropriation because savings from lower caseloads will more than offset costs from delays in securing federal approval to implement grant reductions.
For 1996-97, spending is projected to increase by about $170 million (net) because current law provides that (1) the 1995-96 statewide 4.9 percent grant reduction be restored for 1996-97 ($67 million), (2) the 5.8 percent grant reduction implemented in 1992-93 be restored ($152 million), (3) a cost-of-living adjustment (COLA) be granted ($44 million), and (4) the full-year effect of other grant reductions and policy changes result in savings (-$92 million). For 1997-98, AFDC spending is projected to decrease slightly ($10 million) primarily because the cost of the statutory COLA is offset by a slight caseload decline and savings from not providing grant increases for children born while a family is on aid (the Maximum Family Grant provision of current law).
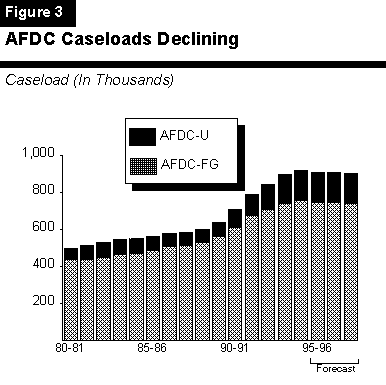
Caseload Trends and Projections. Since peaking above 11 percent in the early 1990s, annual caseload growth has moderated to 2.5 percent for 1994-95. Since April 1995, caseloads have actually been declining. This decline has occurred in both the AFDC-FG and the AFDC-U programs. A reduction in applications, rather than an increase in the number of families leaving the assistance rolls, has accounted for the drop in caseload growth. The downturn in welfare caseloads is due to several factors, including lower birth rates for young women, an improving economy with lower unemployment, and a decline in legal immigration to California.
Based on a trend analysis of caseloads, birth rates, and unemployment rates, we project that the total AFDC caseload will decline by approximately 1.6 percent in 1995-96 and will decline slightly further over the next two years, as shown in Figure 3.
The Spending Forecast. We estimate that General Fund expenditures in the AFDC-FC program will increase from $331 million in 1995-96 to $355 million in 1996-97 and $382 million in 1997-98. This represents about a 7 percent increase each year.
Key Forecast Factors. The projected increases are due to: (1) continuation of the current caseload growth (3.4 percent), (2) statutory COLA adjustments for group homes, and (3) placement in group homes of a higher proportion of children requiring a higher level of service.
The Spending Forecast. General Fund spending for the SSP is projected to be $1.9 billion in 1995-96. This is a decrease of 6.2 percent from the prior year, due primarily to grant reductions. General Fund spending for the SSP is estimated to increase by 32 percent in 1996-97 and 3.6 percent in 1997-98. In comparison, spending in recent years has experienced declines ranging from 1 to 12 percent.
Key Forecast Factors. The statutory requirements to restore the 1992-93 grant reduction and part of the 1995-96 grant reduction account for 78 percent of the projected spending increases in 1996-97 and 1997-98. Caseload growth and statutory COLAs account for the remaining 22 percent.
For 1995-96, SSP spending is estimated to exceed the Budget Act appropriation by approximately $130 million because of (1) delays in obtaining federal approval to implement grant reductions and eligibility changes and (2) lack of federal legislation to eliminate the federal ad-ministration fee. In 1996-97, SSP spending is projected to increase by approximately $600 million (32 percent), due largely to the restoration of the 5.8 percent 1992-93 grant reduction ($451 million) and the 4.9 percent 1995-96 grant reduction ($136 million). We project that spending will increase by approximately $90 million in 1997-98 due to caseload growth ($68 million) and a COLA ($21 million).
Caseload Trends and Projections. Figure 4 shows historical and projected changes in the components of the SSI/SSP caseload.
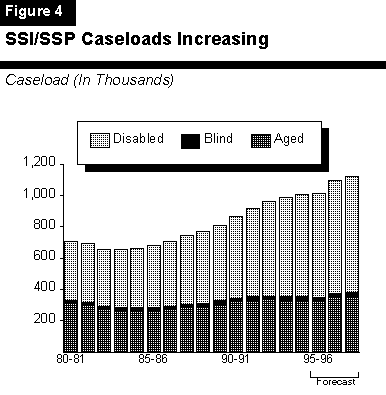
From 1980-81 through 1994-95, the state's SSI/SSP caseload grew by approximately 300,000 cases, or 42 percent. Most of the growth was in the disabled category, increasing by 280,000 cases. More recently, the growth in disabled SSI/SSP cases has been moderating, declining from a peak of 7.6 percent in 1991-92 to 3.9 percent in 1994-95. For 1995-96, we project that the SSI/SSP caseload will remain stable because the underlying growth rate is offset by two factors: (1) drug and alcohol abuse was eliminated as an eligibility criterion and (2) grant reductions will eliminate some cases from the program. These two policy changes will reduce the caseload by approximately 50,000. For 1996-97, we project that the caseload will increase by 8.3 percent because of (1) the eligibility effects of restoring both the 1992-93 and part of the 1995-96 grant reductions, and (2) the underlying basic caseload growth. For 1997-98, we forecast caseload growth of 2.7 percent, due to a continuation of the underlying basic trend.
Both the House of Representatives and the Senate have passed welfare reform proposals which, if they became law, would have significant impacts in California on the AFDC and SSI/SSP programs and would restrict welfare for noncitizens.
AFDC. Both proposals would replace the current AFDC entitlement program with a Temporary Assistance for Needy Families Block Grant. In our September 7, 1995 policy brief on this subject, we estimated that California could lose up to $3 billion in federal funds over a five-year period under either the House or Senate versions. Also of note, the Senate version has a maintenance-of-effort provision requiring states to spend at least 80 percent of what they spent on welfare during federal fiscal year 1994. The House version has no such requirement.
SSI/SSP. The major changes in this program under both versions are the elimination of benefits for children who are relatively less disabled and the elimination of the state's maintenance-of-effort requirement for SSP. This latter change would enable the state to reduce grants, as provided in the 1995 Budget Act. We estimate that the various provisions affecting SSI/SSP would have no net effect on the amount of federal funds the state would receive under the House version and a loss of about $200 million over five years under the Senate version.
Restricting Welfare for Noncitizens. With certain differences in implementation dates and treatment of the existing caseload, both federal welfare proposals prohibit noncitizens from receiving federal funds for SSI/SSP, Food Stamps, Medi-Cal, and AFDC. We estimate that, over a five-year period, the state General Fund would incur costs of up to $5.3 billion (House) or $3.6 billion (Senate) if the state elects to backfill for the estimated losses in federal funds. Alternatively, state savings of $4.9 billion (House) or $2.9 billion (Senate) would be achieved if the state conforms to federal restrictions. These state savings would be largely offset by cost shifts to the counties, primarily for General Assistance and indigent health care. We note that the fiscal effects could be significantly lessthan these amounts, depending on the extent to which the individuals affected become citizens, thereby retaining program eligibility.
Effect on State Spending. We estimate that over a five-year period the net fiscal impact of these provisions on the state could range from a cost of approximately $8 billion to a savings of about $5 billion, depending primarily on whether the state chooses to backfill for the loss of federal funds or conforms its policies to the eligibility restrictions (on noncitizens, for example) in the federal legislation. In 1996-97 and 1997-98, the federal changes would lead to General Fund costs of about $1.5 billion annually or savings of about $1 billion annually.
The Spending Forecast. General Fund spending in 1995-96 for Medi-Cal benefits (excluding administration and capital debt) is estimated to be $5.7 billion. This is $153 million below the administration's most recent estimate, due primarily to lower-than- anticipated caseloads. General Fund spending is projected to increase by 4.2 percent in 1996-97 and 4.6 percent in 1997-98. For purposes of comparison, we note that recent changes in General Fund spending have shown considerable variation. Specifically, spending increased by 3.1 percent in 1993-94 and 8.2 percent in 1994-95, and is estimated to decrease by 1.3 percent in 1995-96 (due to various program reductions).
Key Forecast Factors. For 1996-97, projected spending will increase by about $240 million, due to a 1.3 percent increase in caseload ($98 million) and a 3 percent increase for adjustments in average costs ($171 million). These increases are partially offset by savings from the full-year effect of program reductions implemented during 1995-96 (-$37 million). For 1997-98, Medi-Cal spending will increase by about $270 million because of projected caseload growth (1 percent) and adjustments in average costs (3 percent).
Caseload Trends and Projections. As Figure 5 shows, Medi-Cal caseloads grew rapidly in the early 1990s but the growth rate began to slow down in 1994-95. As noted above, we project that the caseload will increase by 1.3 percent in 1996-97 and 1 percent in 1997-98.
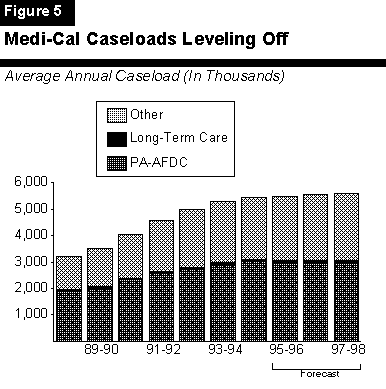
In developing our forecast, we divided the caseload into four components: (1) Public Assistance-AFDC (PA-AFDC) cases (persons receiving an AFDC grant), (2) long-term care aged (elderly) persons, (3) long-term care disabled persons, and (4) all other eligible individuals. The PA-AFDC caseload represents about 55 percent of the total caseload and about 25 percent of expenditures. While the two long-term care categories represent only about 1 percent of total cases, they account for over 15 percent of expenditures.
For purposes of our forecast, the most significant factor is the flattening of caseloads in the PA-AFDC component. We project that these cases will decline slightly in 1995-96 and continue at about the same level in the following two years. This is generally a function of our forecasted change in the caseload of AFDC grant recipients, as discussed above.
As is the case with welfare reform, the House and Senate are considering legislation which would make major changes in the federal Medicaid Program (Medi-Cal in California).
Increased Flexibility in Some Areas. Both proposals would increase the states' discretion over several key areas, including eligibility criteria and benefit coverage. Specifically, states would no longer be required to: (1) cover specific services; (2) reimburse specific types of health care providers; (3) reimburse at specific rates; (4) provide services on a statewide basis; (5) provide services of the same duration, amount, and scope to all eligible individuals; (6) allow patients "freedom of choice" to select providers; or (7) reimburse noncontract hospitals and nursing facilities on the basis of reported actual costs.
Some Strings Are Still Attached. Under both the House and Senate versions, a state maintenance-of-effort would be required for three population groups: pregnant women and children in families with incomes below 185 percent of poverty, low-income elderly, and low-income disabled persons. In addition, states would be required to provide coverage for immunizations for eligible children. The Senate version would also require coverage of pre-pregnancy family planning services and supplies, as specified by the state.
Payments to States. Under both versions, a maximum federal allotment would be established for each fiscal year beginning with federal fiscal year 1996 (October 1995 to September 1996). States would be required to match federal funds up to the federal cap. The House version eliminates the Disproportionate Share Hospital payment program and incorporates the payments into the overall funds allotted to states according to the funding formula. The House and Senate versions differ in their funding formulas.
The fiscal impact on the state General Fund would depend on several variables. Additional General Fund costs would occur if the state chooses to backfill for the reduction in federal funds in order to maintain current eligibility criteria and service levels. Alternatively, savings could result if the state does not backfill reductions in federal funds and restructures the Medi-Cal program to change policies regarding eligibility criteria and benefits. Much of these savings, however, would be offset by costs at the local level for indigent health care services.