Foster Care Caseload Growth Slowing Significantly
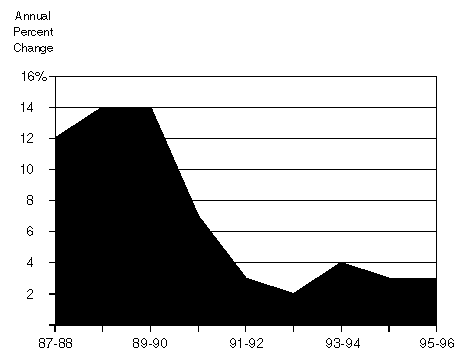
- During the late 1980's, the annual growth rate in the
AFDC-Foster Care caseload reached as high as 14 percent. Since 1991-92,
however, the growth rate has decreased to about 3 percent.
- The reduced growth rate may be due in part to the following:
(1) in 1991-92, the counties' share of costs for the AFDC Foster
Care Program was increased substantially (from 5 percent to 60
percent), giving counties a substantial incentive to contain expenditures,
and (2) family preservation programs have expanded throughout the
state. These preservation programs are designed to provide more
intensive services to help families remain together and avoid foster care
placements.
Foster Care Placements Vary Among Largest States
1993
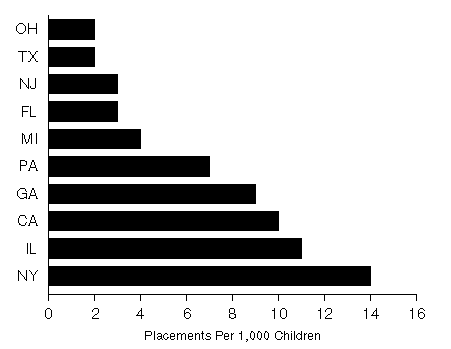
- In 1993, California's foster care placement rate was 10 per 1,000
children. This is lower than in New York and Illinois, but higher than
in other large states.
- Some of the variation in placement rates among states is due to
differences in demographic and socio-economic factors (for example,
incidence of poverty), state policies and practices, and state data
collection procedures.
Foster Care Placements Vary Among Largest Counties
1994
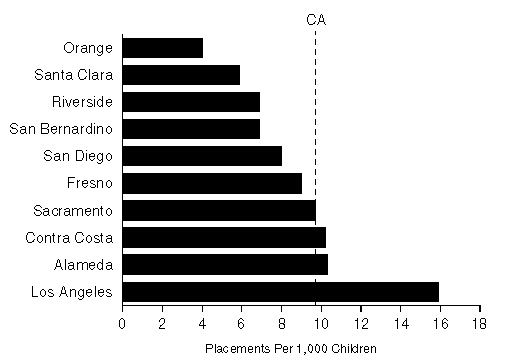
- In June, 1994 the foster care placement rate varied from 4 per
1,000 children in Orange County to 16 per 1,000 children in Los
Angeles County.
- The variation may be partly due to differences in demographic
factors, such as poverty, or in efforts to prevent out-of-home placements.
Foster Care Placement Rates Are Increasing
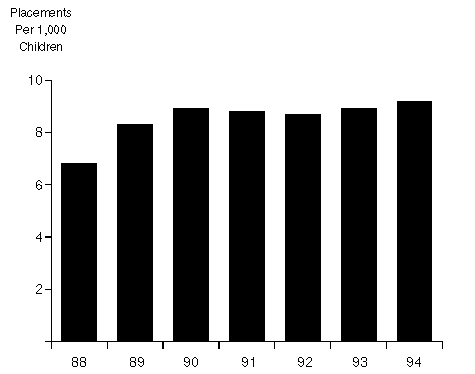
- The number of children placed in foster care per 1,000 children
increased from 6.8 in 1988 to 8.9 in 1990. The rate increased to 9.2
in 1994.
- The increase in placement rates is probably partly explained by
the increase in the rate of reports of child abuse and neglect during
the same period.
More Foster Care Children Being Placed with Relatives
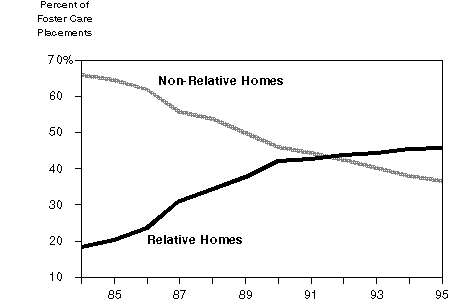
- An increasing proportion of foster care children are being placed
with relatives. In June 1984, children placed with relatives accounted
for 19 percent of the foster care caseload, compared to 46 percent in
June 1995.
- This increasing trend probably results from ongoing efforts to
give preference to relative placements over other types of placements.
Percent of Ethnic Group
Population in Foster Care
June 1995
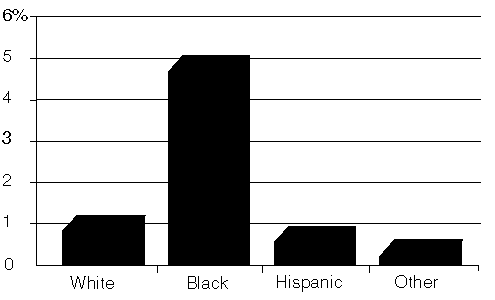
- In June 1995, 37 percent of the foster care population was black,
36 percent was white, and 25 percent was Hispanic. (Not shown
in chart.)
- The number of black children in foster care represented about
4.8 percent of the total population of black children in California.
Hispanic children in foster care represented 0.6 percent of the
total Hispanic children population.
- The reasons for the variation in ethnic group representation are
unknown. The relatively high percentage of black children in
foster care, however, may be due partly to the relationship between
relatively low family incomes and problems leading to child
abuse/neglect.
About Half of the Foster Care Children
Are There Due to Neglect
1994-95
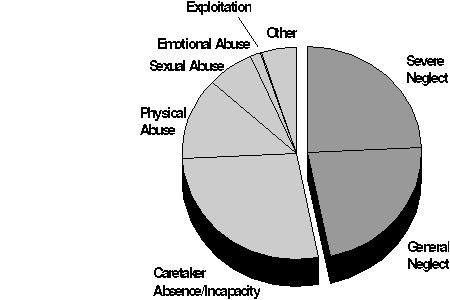
- In 1994-95, about one-half of the children in foster care had
been removed from their homes due to general or severe neglect.
- While physical and sexual abuse comprise nearly half of the types
of child abuse/neglect reports received, less than a quarter of the
children placed in foster care are there due to these reasons.
Independent Living Program Expanding,
But Not Serving All Eligibles
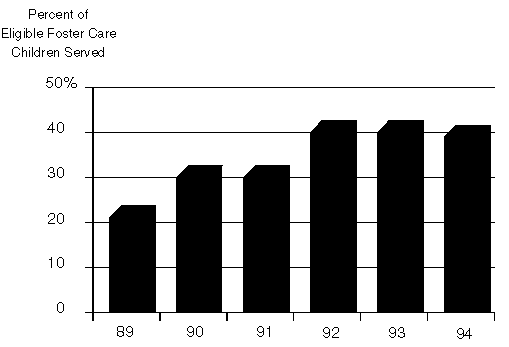
- The Independent Living Program (ILP) provides services (such
as job seeking skills) that will help a child transition from foster care
to independent living.
- Although the percent of eligible foster care children served by
the ILP has increased from 21 percent in 1989 to 39 percent in 1994,
less than half of the eligible population is being served.
Return to the Table of Contents
Continue to Part IV, Cost of Child Abuse/Neglect
Return to Part II, The Child Welfare Services System, Part A
Return to LAO Home Page


