 |
State Spending Plan for 1996-97
Chapter 2 |
State Expenditures --
Dollar Amounts and Trends Over Time
In this chapter, we provide aggregate expenditure
information relating to the 1996-97 spending plan. Specifically, the
chapter discusses (1) current state expenditures by fund, (2) General
Fund and special funds expenditures over the past decade, and (3)
the distribution of General Fund spending by program area.
Total State Spending
Figure 1 shows total state expenditures from all
funds from 1994-95 through 1996-97. As noted in Figure 1, our
figures include certain adjustments to the administration's spending
amounts in order to make the figures more comparable from year to year,
and to better reflect actual state spending levels.
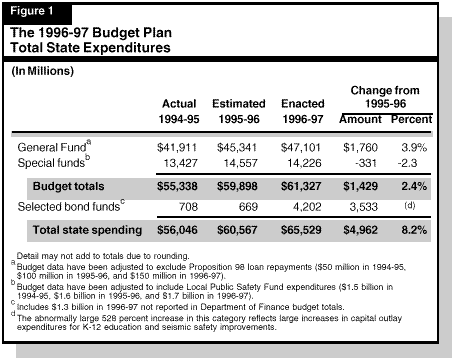
The figure shows that, under the current budget plan, total
state spending from all sources grows from $60.6 billion in 1995-96
to $65.5 billion in 1996-97, an increase of nearly $5 billion, or
8.2 percent (roughly similar to the 8 percent growth between 1994-95
and 1995-96). Excluding spending from selected bond funds,
budget-related expenditures from General and special funds are up
2.4 percent. The figure also shows that the majority of total
state spending is from the General Fund, which in 1996-97 accounts
for about 72 percent of the total. Figure 1 also shows that:
- Spending from the General Fund will increase
by 3.9 percent in 1996-97, or 12 percent over the
past two years. The significant two-year growth
rate reflects a major increase in Proposition 98
funding between 1994-95 and 1995-96.
- Expenditures from special funds in 1996-97 are
2.3 percent below 1995-96 spending. The decline
reflects fluctuations in capital outlay expenditures by
the California Department of Transportation for
various highway projects. Over the two-year
period, however, 1996-97 special fund spending is
about 6 percent above the 1994-95 level.
- Expenditures from bond funds will be up sharply
in 1996-97, reflecting large increases in capital
outlay expenditures for K-12 education and seismic
safety improvements.
State Spending Over the Past Decade
To put the amount of spending in this year's budget into
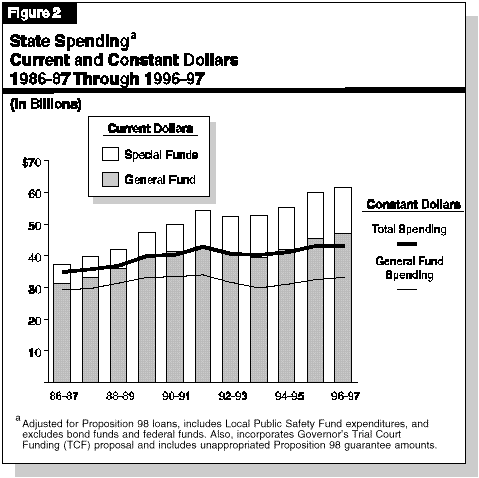
perspective, Figure 2 shows state spending trends over the past ten years
since 1986-87. Total state spending grew relatively rapidly until
1991-92, but experienced little overall gain between 1991-92 and 1994-95
due to the impact of the recession. Spending growth rebounded
sharply in 1995-96, partly reflecting the impact of revenue growth on
Proposition 98 funding. The 1996-97 budget includes further
modest growth. Figure 2 also shows that after removing the effects
of inflation (constant dollars), total state spending in 1996-97 is
slightly above the 1991-92 peak.
Over the past decade, spending from special funds has grown
faster than spending from the General Fund due to two factors:
- First, legislation and voter initiatives have
established new programs financed by fees or
dedicated tax revenues (such as Proposition 99
tobacco-related taxes). These measures have also increased
gasoline taxes and other special fund revenues.
- Second, in recent years the Legislature has
shifted some traditional General Fund costs and revenues
to special funds. For example, in 1991-92, a
half-cent increase in the state sales tax was enacted, and
the revenues were placed in a special fund to
cover certain health and welfare costs that the state
shifted to the counties.
Spending by Major Program Area
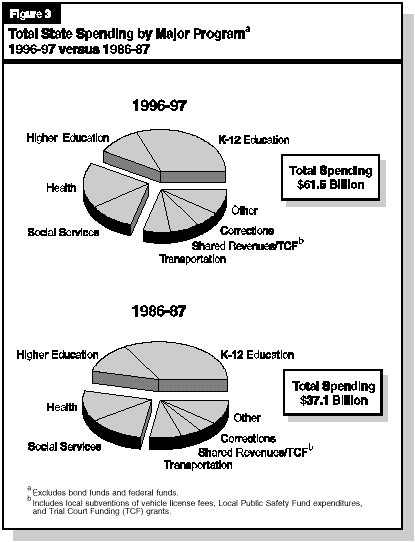
Figure 3 shows how total state spending is
divided among the major program areas and how this allocation has
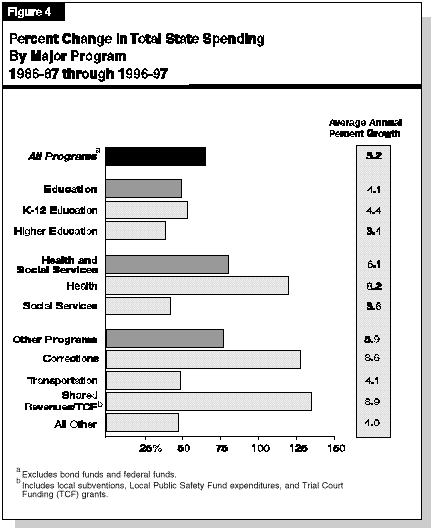
changed over the past decade. Figure 4 shows the percent
change that occurred in spending by major program area over this
period. The two figures indicate:
- In 1996-97, spending on K-12 and higher
education will account for about 42 percent of total
General Fund and special funds expenditures, making
education the largest single category of state spending.
- The allocation of spending has changed
modestly over the past decade. In general, health,
corrections, and "shared revenues" have increased more
rapidly than the statewide average, resulting in an
increase in their shares of the overall spending totals.
Conversely, spending on education, social services,
and transportation has grown more slowly than the
statewide average for all programs combined,
resulting in a decline in their shares of the budget totals.
Why Has Growth Differed by Program Area?
Faster-growth areas. The above-average increase in
health-related spending largely reflects the combined impacts of caseload
and inflation, which resulted in particularly large increases in the
Medi-Cal program during the late 1980s and early 1990s. The growth
in corrections-related spending reflects a major rise in inmate
populations partly due to expanded prison sentencing and the
increasing costs of financing and operating prisons. The increase in
"shared revenues" partly reflects legislation passed in 1991 which
allocated a new one-half cent increase in state sales tax revenues to counties
to cover health costs shifted to local governments. It also reflects
state allocation of a new one-half cent increase in sales tax to counties
for public safety beginning in 1993.
Slower-growth areas. The slower-than-average increase in
education spending is primarily due to the replacement of state support
for K-14 education with property tax revenues shifted from local
governments to schools and community colleges. Thus, the
reported General Fund spending growth understates the increase in
total funding to education. This property tax shift, which took place
in two stages in 1992-93 and 1993-94, was done to partly offset
the major budget shortfalls facing state government in the early
1990s (the property tax shift was partly mitigated by a one-half
cent increase in the sales tax, noted above, which is distributed to
localities to support public safety).
The comparatively low growth rate in social services
spending reflects significant grant reductions and eligibility restrictions
enacted in the AFDC and SSI/SSP programs during recent years.
The below-average growth in transportation spending reflects the
modest increases in transportation-related tax revenues, which
occurred despite the gas-tax increases approved by voters in 1990.
Continue to Chapter 3 - Major Features of the
1996-97 Budget Plan, Part I
Return to LAO Home Page


