
 |
California's Fiscal Outlook |
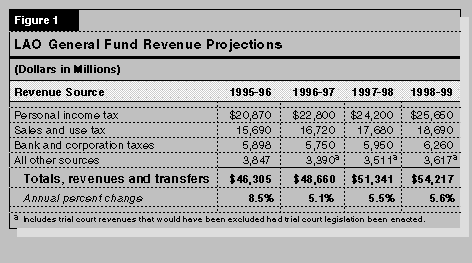
Continuing strength in California's economy has been translating into healthy increases in state General Fund revenues. Figure 1 shows that we now estimate that revenues will be $48.7 billion in 1996-97, a 5.1 percent increase from the prior year. Our new estimate for the current year is up $723 million from the budget act estimate (after controlling for different treatments of trial court funding). In addition, we have revised prior-year revenues up $168 million, making the total upward adjustment for the two years about $891 million.
Figure 1 also shows that we project that revenues will further increase to $51.3 billion in 1997-98 (a 5.5 percent increase) and to $54.2 billion in 1998-99 (an increase of 5.6 percent).
In this chapter, we discuss the key assumptions that underlie our revenue projections.
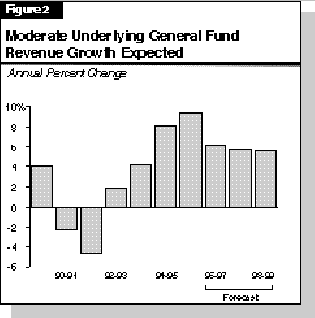
Figure 2 shows the year-to-year percent changes in underlying revenues during the 1990s (defined as revenues adjusted to eliminate the effects of revenue-related law changes adopted during this period). It shows that revenues expanded modestly in 1989-90, before falling sharply during the early 1990s' recession. After growing very modestly for a couple of years, revenues rebounded strongly in 1994-95 and 1995-96, in line with California's economic recovery. As Figure 2 indicates, we project that underlying revenue growth will continue to mirror the state's general economic trends, growing moderately through 1998-99.
PIT Liability Growth Mirrors Economy. A key reason for the swings in overall General Fund revenues during the past several years has involved the personal income tax. Figure 3 compares the growth in statewide personal income and personal income tax liabilities. It shows that these tax liabilities fell during the recession, but then rebounded sharply beginning in 1994.The recent gains are partly due to the general strengthening of the economy. They also reflect major gains in such specific areas as business earnings, investment income, and bonuses--all of which tend to accrue to higher-income taxpayers and thus are taxed at higher average tax rates than income generally.
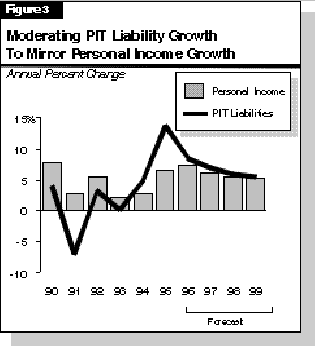
We forecast that tax liabilities will grow by 8.5 percent in 1996, before moderating during the next three years.
Revenue Projections. Based on our forecast of increases in PIT liabilities, we project that fiscal year PIT collections will rise from $20.9 billion in 1995-96 to $22.8 billion in the current year, an increase of 9 percent. Our revised projection for 1996-97 is up $582 million from the 1996-97 Budget Act forecast. We project that PIT revenues will expand to $24.2 billion in 1997-98 and to $25.7 billion in 1998-99.
The state sales and use tax rate is 6 percent, which includes a 5 percent General Fund rate and a 1 percent rate allocated to special funds. Additional local rates ranging from 1.25 percent to 2.5 percent are imposed by cities, counties and transportation districts, bringing the combined state-local tax rate to between 7.25 percent and 8.5 percent (depending on the county involved).
The key factor determining the level of sales and use tax receipts is the strength of taxable spending by consumers and businesses in California. After falling during the recession, taxable sales began to recover in 1994 and have accelerated over the past two years, reflecting cyclical rebounds in both retail spending by consumers and capital spending by businesses. We expect that taxable sales will increase by 7.7 percent in 1996, the largest percentage growth since 1989. Our forecast assumes that high confidence levels, coupled with growing employment and incomes, will lead to a strong holiday shopping season in the fourth quarter of this year.
We project that taxable sales will grow in line with the economy in the 1997 through 1999 period, increasing by an average of about 5.6 percent per year.
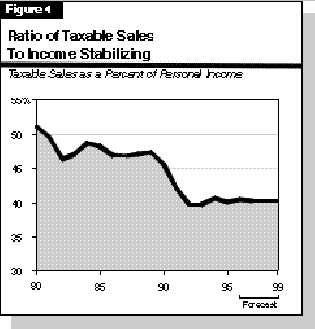
Figure 4 provides a longer-term perspective on taxable sales by showing the ratio of taxable sales to personal income. The figure shows that this ratio has experienced a generally downward trend over the past two decades. We project that, despite the recent cyclical rebound in sales, the taxable sales ratio will remain relatively stable at historically low levels. The long-term decline in the ratio is largely due to an ongoing increase in the share of spending that goes to services, which generally are not subject to California's sales and use tax.
Revenue Projections. We project that sales and use tax revenues will be $16.7 billion in 1996-97, 6.6 percent above the 1995-96 level. Our updated projection is up $235 million from the 1996-97 Budget Act forecast. We project that sales and use tax receipts will grow to $17.7 billion in 1997-98 and to $18.7 billion in 1998-99.
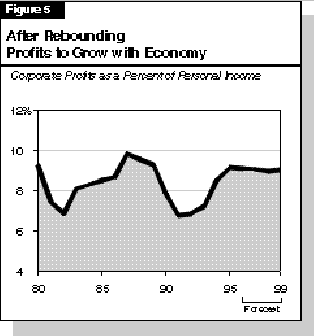
The key determinant of bank and corporation revenues is California taxable corporate profits. As shown in Figure 5, the ratio of taxable corporate profits to state personal income (a good measure of the overall strength of profits) rebounded in the early stages of the current economic expansion. Based on quarterly corporate tax prepayments through September, however, it appears that earnings growth has been moderating in 1996. We project that corporate earnings will experience growth but only in line with the economy.
Revenue Projections. We project that bank and corporation tax revenues will total $5.8 billion in 1996-97, down 2.5 percent from 1995-96. Part of the reduction is due to the tax rate cut, which is estimated to lower revenues by $85 million this year. The remainder of the reduction is due to a lower level of one-time audit receipts projected for the current year. Our new forecast is down $111 million from the 1996-97 Budget Act forecast. We project that revenues will reach $6.0 billion in 1997-98 and $6.3 billion in 1998-99. During the next two years, the effects of the 5 percent tax reduction are projected to increase to $230 million in 1997-98 and $290 million in 1998-99.