
 |
Higher Education Enrollments:
|
Introduction |
Much has been written of the growing enrollments in California's community colleges, California State University (CSU), and University of California (UC). Various reports characterize these future increases as the "baby boom echo" or "Tidal Wave II." |
LAO
|
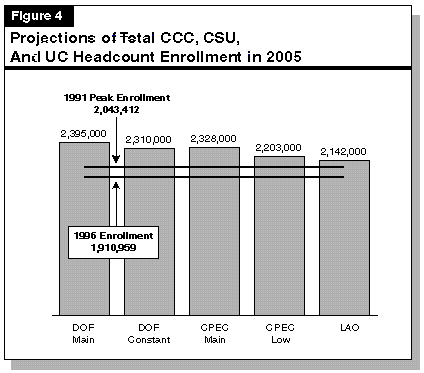
Projected Enrollment Growth Not of Tidal-Wave Proportions. If 1996 college-participation rates among Californians continue, we project that total enrollments in 2005
will be 2,142,000, or 98,000 (4.8 percent) above the peak
enrollments of 1991.
Enrollment Growth Is Not an Unmanageable Force. Whereas tidal waves are natural phenomena beyond our control, enrollment growth in higher education can be managed.
|
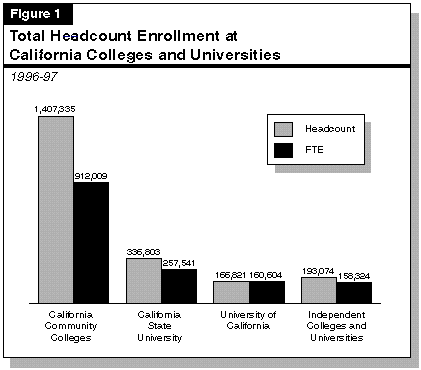
As Figure 1 shows, of the 2.1 million students attending a college or university in California in 1996-97, 1.9 million, or 91 percent, attended a state-owned college or university. (The numbers in Figure 1--and throughout the rest of this report-refer to headcount
rather than full-time-equivalent enrollment. We describe these two terms in the accompanying text box.) Approximately 193,000 students, or 9 percent, attended independent
colleges and universities in the state, and many of them received state financial aid.
Given its significant role in higher education, the state needs information about enrollment demand with which it can construct higher education policies and budgets.
In this paper, we:
In this paper, we generally refer to headcount enrollments, rather than
full-time-equivalent (FTE) students. Headcounts treat each student attending college
as one student, whether the student attends on a part-time or full-time basis. The FTE
measure counts, for example, two half-time student as one FTE student. In 1996, one
headcount enrollment equaled .96 FTE in UC, .76 FTE in CSU, and .65 in the community colleges. For UC and CSU, FTE per headcount enrollment has gone up or down
by at most 3 percentage points. Over the past 20 years, the number of FTE per
headcount enrollment in the community colleges has varied from a high of .65 (1996)
to a low of .57 (1992). The ratio varies more for community colleges because they
serve a higher percentage of part-time students, whose enrollment varies more with
economic and social changes.
|
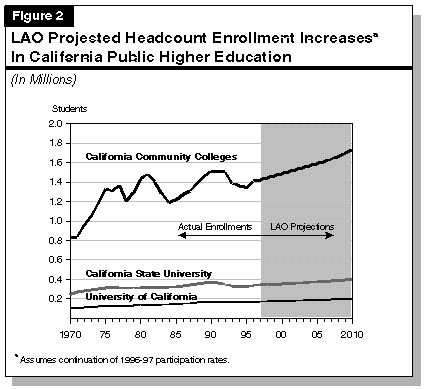
Effect on Operations Costs Should Not Be Extraordinary. The costs of operating state colleges and universities generally are proportional to the number of students that they serve. To anticipate future operating costs, we can compare 1996-97 enrollments to the projections described above for 2005-06. If participation rates remain what they were in 1996-97, enrollments in each of the three segments would grow by a total of 12 percent by 2005-06, or 1.3 percent per year over this nine-year period. (The growth rates would be virtually the same through 2010-11.) By contrast, total enrollment in the three segments increased by an average of percent per year from 1970 to 1996. From this perspective, accommodating enrollment growth should not be any more of a challenge in the next nine years than it has been since 1970.
Capital Needs for Growth Should Be Lower Than in Past. To understand how enrollment growth will affect demand for additional campus space, buildings, and equipment, we can compare projected enrollments with prior peak enrollments. In 1991, total enrollment was at its highest level in history. At that time, the segments were able to accommodate a total of 2,043,000 students.
If current college-participation rates continue through 2005-06, we project that total enrollments in the three segments will be 98,000, or 4.8 percent, above total enrollments in 1991. This represents total growth of 0.3 percent per year from 1991 through 2005-06. By comparison, total enrollments grew by an average of 2.7 percent per year from 1970 through 1991. Viewed from this perspective, the capital demands of enrollment growth should pale in comparison to the two decades before recent peak enrollments in 1991.
The story is the same for each of the segments. If current participation rates continue
through 2005-06, enrollments would be 69,000 (0.3 percent per year) higher in the community colleges, 3,000 higher in CSU (virtually the same), and 19,000 higher in UC
(0.7 percent per year) than they were during the prior peaks in 1990 and 1991. (The UC
and CSU peaks occurred in 1990. The community colleges peak occurred in 1991, as did
the peak for total enrollment in the three segments.) For each segment, the projected
rate of enrollment growth from their prior peak through 2005-06 is well below annual
growth for the 20 years preceding the peak. Community colleges serve a more local
market, however, than do UC and CSU. In some districts, the rate of enrollment growth
will be above our statewide projections, while in others, it will be lower.
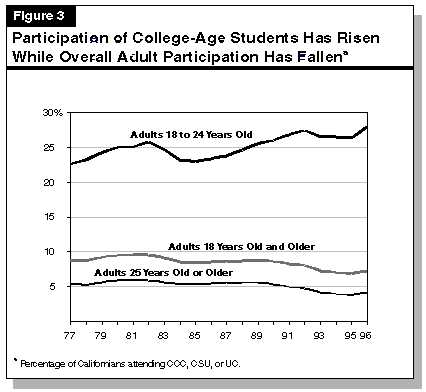
The increase over time in participation rates among 18 to 24 year olds could at least
in part explain why participation rates among older adults has fallen. In effect, the
state's success in educating increasingly more adults when they are young means that
the state faces reduced demand for education services from older adults. This phenomenon will tend to depress enrollment growth in the community colleges more than in
CSU, and much more so than at UC. This is because the community colleges, and to a
lesser extent CSU, have traditionally attracted those older adults who seek to begin
college or augment previous college after starting their careers. Undergraduate students
in UC are, on average, younger than in the other segments and more often come directly from high school.
Community College Projections Subject to Greatest Uncertainty. Of the three segments, it is most difficult projecting community college enrollments. This is because community colleges offer a broad range of curricula--academic, vocational, avocational, and recreational--to a much broader student population than does CSU or UC. The community colleges, for example, provide an assortment of personal development and recreational courses to attract older adults, many who participate in only one or a few classes in any year.
Also, it is much easier for students to enter and exit community colleges than it is at CSU and UC. As a consequence, enrollments in the community colleges are more sensitive to economic and social conditions than in the four-year colleges.
The ultimate accuracy of projections of total enrollment in the three segments will depend in large part on what happens to community college enrollments. This is because community colleges account for three quarters of total enrollment in the three segments, and their enrollments are the most volatile and unpredictable.
Using Current Participation Rates Probably Will Produce Least Error in Projections. As noted above, we have used current participation rates to project enrollments. University of California officials compared several methods of projecting UC enrollments. By applying various projection techniques to historic data, they tested how well each method would have predicted eventual UC enrollment changes. They found that using the current participation rates at any time in history produced the smallest enrollment-projection errors.
Given the inherent uncertainty in projecting enrollments, it should not be surprising
that projections of future enrollments vary. In the next section, we compare our projections with those of the DOF and the
CPEC.
In its 1995 report A Capacity for Growth, the CPEC published two projections of enrollment growth. The press and others have frequently cited the higher of CPEC's projections, which we call the "CPEC main" projection. We also include the lower CPEC projection, which we call the "CPEC low" projection, in our charts for comparison purposes.
The main projections of total enrollments of both DOF and the CPEC are higher than
the LAO projections. Nevertheless, the DOF and CPEC projections are comparable to
historic trends. As Figure 4 shows, DOF's main projection for total enrollment in 2005 is
2,395,000. This is 253,000, or 12 percent, higher than the LAO projection. CPEC's main
projection for 2005 is 2,328,000. This is 186,000, or 8.7 percent, higher than the LAO projection.
The DOF main projection represents annual growth of 2.5 percent from 1996 to 2005,
and 1.1 percent from 1991 to 2005. The CPEC main projection represents annual growth
rates of 2.2 percent and 0.9 percent, respectively. Again, for comparison purposes, actual growth averaged 1.9 percent per year from 1970 through 1996, and averaged
2.7 percent between 1970 and 1991. Even if the higher growth projections of DOF or
CPEC occur, the rate of growth will not be significantly higher than has occurred in
recent history.
The CPEC Figure Overstates Growth for Capital Planning. In its 1995 report, CPEC
said that its main projection of 2,328,000 represented growth of 455,000 students by
2005. Although frequently cited in the press, this number is very misleading for purposes of assessing the state's higher-education capital needs. To derive this 455,000
growth number, CPEC compared its main 2005 projection with enrollments in 1993.
Enrollments in that year, however, were 171,000 below 1991 levels. The projection of
2,328,000 is only 285,000 higher than the 1991 peak. This number is more relevant when
evaluating the capacity for growth within the segments because it represents growth
above the number of students that the existing capacity had successfully accommodated.
The DOF and CPEC Assumed Increasing Rates of College Participation. The DOF
and CPEC main enrollment projections are higher than ours primarily because they
assumed that college participation rates would increase significantly from 1996 through
2005, reaching their highest levels in recent history for some groups. Our projections
assume that 1996 participation rates will continue into the future. We are not aware of
any analytical basis for using rates that are different than the most recent.
The CPEC Alternative Projection Comparable to LAO's. In its report, CPEC also
published projections for which it assumed that participation rates would grow at
roughly half the rate it assumed for the CPEC main projection. As Figure 4 shows, the
CPEC low projection of total enrollment in 2005 is 2,203,000. This projection is
2.9 percent above our projection. (Our projection differs from CPEC and other forecasters due to different assumptions about participation rates and for other methodological
reasons.)
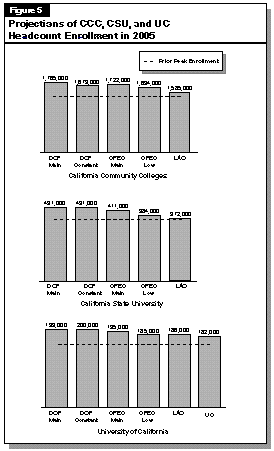
The DOF Projections Highest for Each Segment. As Figure 5 shows, the DOF's projections are consistently higher than CPEC's and LAO's across all three segments. It
projects that community college enrollment will grow to 1,765,000 by 2005. This is
11 percent higher than the LAO projection. It projects that CSU will grow to 431,000,
and that UC will grow to 199,000. These are 16 percent and 7.4 percent greater than the
LAO projections for CSU and UC. As Figure 5 shows, UC's projection of enrollments in
2005 is slightly lower than ours.
Despite the differences among the DOF, CPEC, and LAO, none of the projections are
sufficiently large to suggest enrollment growth will be of tidal wave proportions.
Given the uncertainty in future enrollment demand, we recommend that the segments provide the Legislature with alternative enrollment projections, and describe the policy implications associated with each. For each alternative enrollment projection, the segments should:
By having this type of information, the Legislature will be better able to address issues related to the likely enrollment growth. In the next section, we examine ways in which the Legislature can manage growth.
Master Plan Called for Flexible Eligibility Targets. The 1960 Master Plan stated ". . . admission requirements are valid for any one college if, first, they serve to qualify for admission those applicants whose educational purposes are properly met by the college and whose abilities and training indicate probable scholastic success in the college and, secondly, they serve to eliminate applicants not meeting these requirements." The Master Plan recommended that segments each year statistically analyze and report on the validity of their entrance requirements. The plan said that the segments should evaluate entrance standards based on the scholastic success, persistence, rate of dismissal, and standardized test scores of their students. The 1973 Report of the Joint Committee on the Master Plan for Higher Education stated ". . . we propose that the Legislature initially define the undergraduate eligibility pools for all public segments and that changes in the pools be subject to approval by the Postsecondary Education Commission." The Master Plan, then, views eligibility targets as fluid, subject to ongoing determinations of which students are best served by each segment.
When the Master Plan was first released in 1960, its authors recommended that UC draw from the top 12.5 percent of high school graduates and that CSU draw from the top third, as determined by the segments. (All high school graduates are eligible to attend community college.) At the time, the authors of the plan noted that UC had been drawing from 15 percent of high school graduates and CSU had been drawing from approximately 50 percent. In recommending that the eligibility pools be reduced, the Master Plan stated, "The position of the Master Plan Survey Team is that so long as any high school graduate can be admitted to a junior college . . ., it will not reduce that opportunity for students able and willing to meet the requirements for transfer to the upper division in the state colleges and the University of California." The 1973 and 1987 updates to the Master Plan have reaffirmed that UC and CSU should draw from the top 12.5 percent and 33.3 percent of high school graduates, respectively.
Determining the Appropriate Targets Today. If these eligibility targets were appropriate when the Master Plan was released in 1960, we do not know if they are today. This is because little is known about the success of students as a function of their academic preparedness and method of articulation through college. (Interestingly, the authors of the Master Plan pointed to a similar lack of information before settling on the eligibility targets that are referenced to this day.)
In order for the Legislature to comprehensively address the issue of enrollment growth, it needs information on the validity of current entrance requirements for UC and CSU based on the performance of students while in college. With this information, the Legislature can better allocate enrollment among the segments. We recommend, therefore, that the Legislature:
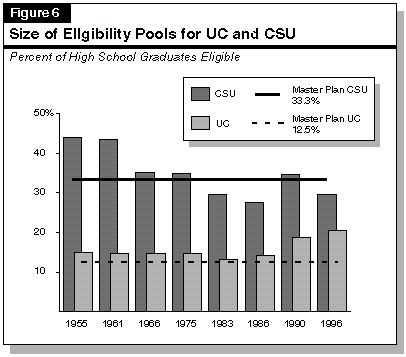
According to the UC, to reduce the eligibility pool from 20.5 percent to 12.5 percent,
it would have to increase the required minimum high school grade-point-average
(GPA) from 3.3 to 3.65. Approximately 36 percent of entering UC freshmen in 1997 had
high school GPAs below 3.65. If UC had not admitted these students, the students
would nevertheless have been eligible to attend CSU, a community college, or many of
the independent colleges and universities. For various reasons, this does not mean that
freshmen enrollments at UC would fall by the full 36 percent if the university raised its
high school GPA requirement to 3.65. Nevertheless, reducing the eligibility pool to the
Master Plan target of 12.5 percent of students would reduce freshman enrollments and
increase transfer enrollments at UC. It is important to note that the maximum possible
GPA for many classes has increased from 4.0 to 5.0. The increase in UC's eligibility pool
might have resulted in part because the university has not adjusted for this change.
A Note on Measuring the Eligibility Pool For UCTop high school graduates that choose to attend CSU rather than UC do not need to take either the SAT I or SAT II, and many probably do not. Similarly, top high school graduates that choose to attend other top universities in the country do not need to take SAT II tests, and many probably do not. By excluding such students when it identifies top high school graduates, UC significantly understates the size of the pool from which it draws freshmen. It is much more accurate to say that UC is drawing from the top 20.5 percent of high school graduates. |
California State University Below Existing Eligibility Target. As Figure 6 shows,
CSU is drawing from the top 29.6 percent of high school graduates--slightly below the
level envisioned by the master plan. While UC has consistently exceeded its level, CSU
has fluctuated above and below its target. If CSU drew instead from the top 33.3 percent
of students, enrollments at CSU would increase by an unknown amount. Presumably,
this would also reduce the number of students that would go to community colleges
and independent colleges and universities.
The UC and CSU Should Report to Legislature on Current Eligibility Criteria. As
noted above, we do not know whether the existing eligibility targets are appropriate,
and we recommend that the segments report each year to the Legislature on their validity. Nevertheless, if the targets are to be meaningful, then the Legislature should require
UC to meet its Master Plan target. The UC should also evaluate for the Legislature what
the implications are for meeting it. Similarly, CSU should meet its Master Plan target,
and describe what the implications are for meeting it. Without holding the segments
accountable for meeting eligibility targets, the Legislature will be less able to manage
higher education enrollments.
New Federal Tax Credit for Tuition Costs Will Dramatically Reduce Education
Costs for Many. The recently enacted federal Taxpayer Relief Act of 1997 creates significant incentives for higher education enrollment across the nation, including California.
The "Hope Scholarship" and "Lifetime Learning" tax credits reduce the after-tax price of
tuition and fees for most middle-income California students (or their parents). The
Hope Scholarship credit, for example, will for many reduce the after-tax price of tuition
in each of the first two years of college by $1,500 at UC, by $1,292 at CSU, and by $390 at
community colleges. Chapter 853, Statutes of 1997 (AB 1318, Ducheny), which lowered
student fees, will have the additional effect of reducing the after-tax price of tuition in
each of the first two years by $190 at UC and by $39 at CSU. (The federal law already
drops the after-tax cost of community colleges to zero for students that qualify for the
Hope Scholarship credit, so Chapter 853 would have no additional effect on what these
students pay.)
The Lifetime Learning credit will, for many upper-division students, reduce the
after-tax costs of tuition each year by $760 at UC and $317 at CSU. The state-fee reductions reduce the after-tax costs by an additional $152 at UC and $62 at CSU for upper-division students.
Changes in Tuition Costs Could Significantly Shift Enrollments. The federal tax
credits will change enrollments in two important ways:
State Should Review Fee Policies in Light of Federal Tax Credit. The federal tuition tax credits create both opportunities and concerns for California. It provides an opportunity for California to increase resources for higher education without significantly affecting the after-tax price of higher education for students and their families. At the same time, however, it could cause significantly fewer students to articulate through the community colleges to four-year colleges and universities, contrary to existing state policy.
We recommend that the Legislature evaluate student-fee policies in light of the opportunities and concerns that the new federal tax credits create for state higher education policy. (We evaluate the implications of the recent federal tax credits in greater detail in another LAO analysis to be released in February 1998.)
In recent years, the Legislature has increased the amount of financial aid provided directly to students through the Cal Grant program. From 1990 to 1998-99 (proposed), for example, it has increased state appropriations for Cal Grants from $162 million to $310 million. As a result, the number of Cal Grant awards increased from 78,000 to 97,000 in that period. The maximum Cal Grant award for students attending private colleges and universities also increased from $5,250 to $8,184, an increase of 56 percent.
The UC, CSU, and community colleges also give their students financial aid beyond the amount given by the state directly to students through Cal Grants. For 1998-99, UC estimates that it will provide $240 million in financial aid to its students from general purposes funds. The CSU estimates that it will provide $120 million, and the community colleges estimate that they will provide $130 million for financial aid from general purpose funds. Most of the aid the community colleges give is in the form of student-fee waivers, particularly for low-income students.
Given that financial aid, like fees, affects whether and where students will attend college, the Legislature should carefully consider the effects financial aid has on enrollments among the segments. As discussed above, the Legislature has two important policy levers to affect enrollments:
Of the 33,895 new students enrolling in UC in 1996, 69 percent were first-time freshmen and 26 percent were transfer students from community colleges. (The remaining 5 percent transferred from other colleges and universities.) Of the 68,725 new students CSU admitted in 1996, 42 percent were first-time freshmen and 47 percent were from community colleges.
If the state encouraged more students to pursue their lower-division course work in community colleges, it could shift some enrollment growth from UC and CSU to the community colleges. Shifting enrollments from UC to CSU or community colleges, and shifting enrollments from CSU to community colleges might allow the state to serve student needs more cost-effectively. The 1997-98 Budget Act, for example, appropriated $7,000 to UC from the General Fund for each increase in full-time-equivalent (FTE) enrollments for the year. It appropriated $4,936 per FTE to the CSU and $3,300 per FTE student taking college-credit courses at a community college.
The Legislature has recognized the importance of intersegmental transfers in promoting access to the four-year colleges and reducing the overall cost of higher education. Current state law, for example, requires the segments to ". . . jointly develop, maintain, and disseminate a common core curriculum in general education courses for the
purpose of transfer."
For the Legislature to manage enrollment growth in the community colleges, it needs to know how enrollments most likely would be allocated among college-level, remedial, personal development, vocational, avocational, and recreational courses. With such information, the Legislature could evaluate how well state funds were being allocated among the various missions of the colleges, and could change the allocations through the budget, fee policies, or other mechanisms.
The ability of the Legislature to manage community college enrollments is limited to some extent by the existing community college governance structure. Although the state General Fund provides twice as much support for community colleges than do local property tax revenues, most of the decisions affecting community colleges occur at the local level, within the community college district boards. Nevertheless, the Legislature can adopt and has adopted policies that affect enrollments.
To manage how community colleges grow, for example, the Legislature can vary
state funding and/or student fees for enrollments, based on the categories of courses in
which enrollments occur. For example, the Legislature could require colleges to charge
fees to cover the full costs of recreational courses that are not required for a degree. The
Legislature could also vary student fees by the type of student enrolling in the colleges.
The recently discontinued $50-per-unit surcharge for students who already had at least
a bachelors degree is an example of such a policy.
| Acknowledgements This report was prepared by Buzz Breedlove, under the supervision of Paul Warren. The Legislative Analyst's Office (LAO) is a nonpartisan office which provides fiscal and policy information and advice to the Legislature. |
Publications
To request publications call (916) 445-2375.
|