Legislative Analyst's Office, January 1998
 |
Gambling in California:
An Overview
|
Introduction
|
Gambling in the United
States is a multibillion dollar industry and is rapidly
expanding. Consumer spending on gambling activities
nationwide has outpaced the growth in personal income
over the past 14 years. Additionally, consumers have made
a dramatic shift in the types of gambling activities they
are participating in, with wagering on charitable games
and horse races declining significantly. In this report,
we outline the nationwide gambling industry, and discuss
in more detail what is occurring in the California
gambling industry. The California gambling industry
includes the state lottery, card rooms, horse race
wagering, charitable gambling, and gambling on Indian
lands. With regard to gambling on Indian lands, we
recommend the Legislature clarify the state's role in
this area. |
Table of Contents
|
GAMBLING
IN THE UNITED STATES
- What Kind of Gambling Is Allowed?
- Size of the Gambling Industry
- Indian Gambling
GAMBLING IN CALIFORNIA
- Lottery
- Card Rooms
- Horse Racing
- Charitable Gambling
- Indian Gambling
|
Gambling in the U.S. takes many forms, casino- style gambling, lotteries, parimutuel wagering on
horse and dog races, card games, bingo, and charitable
fund-raising.
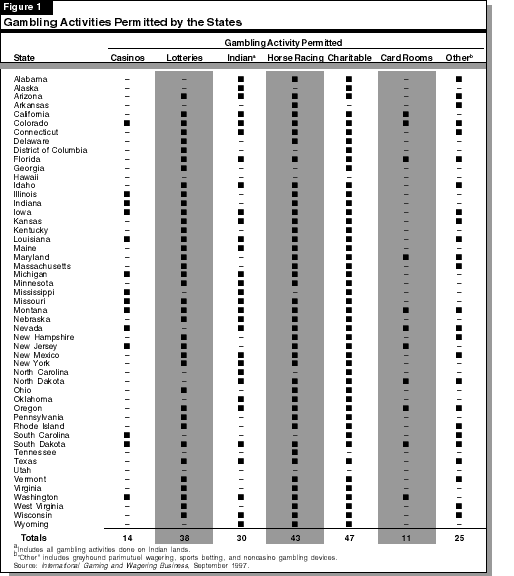
As Figure 1shows, the types of
gambling authorized by each state vary significantly. Forty-eight
states allow some form of gambling, with only Hawaii and Utah
prohibiting all forms. Most states have lotteries, horse racing,
and charitable gambling (usually bingo). Gambling on Indian land
(commonly referred to as "Indian gambling") is also
present in a majority of states and is rapidly increasing.
When many people think of gambling, they
think of casino-style gambling. In 1931, Nevada became the first
state to authorize such gambling. It took almost a half-century
before another state followed suit, when in 1977 New Jersey
authorized casino-style gambling in Atlantic City. Since then,
however, 12 other states have authorized it. (If one counts
casinos operated on Indian lands, there are a total of 27 states
with this type of gambling.)
Gambling in the U.S. is a multibillion
dollar industry. The common monetary measures used
in the gambling industry are handle and gross
revenue.
Unless otherwise noted, gross revenue is
the monetary measure used throughout this report.
As shown in Figure 2 (see page 4),
the estimated revenue for the gambling industry nationwide in
1996 was $47.7 billion. Casino gambling (not including
Indian casinos) received the largest share of revenue, with a
total of $17.5 billion, or nearly 37 percent, of the
nationwide total. Lotteries grossed the next largest share of
gambling revenue totaling $16.2 billion, or 34 percent,
of the total.
For comparison purposes, Figure 2
shows estimated gambling revenues for 1982. Total revenue in that
year was $10.5 billion, meaning that in 14 years, revenues
have grown over 350 percent. During that same time period,
U. S. personal income increased 142 percent. In other words,
consumers have increased considerably the portion of their income
spent on gambling.
Figure 2 also shows that consumers
have shifted their spending among the different gambling industry
segments. Indian gambling, which basically did not exist in 1982,
has grown to 11 percent of all gambling revenues. Lotteries'
share of industry revenues grew by a similar amount. Offsetting
these increases were significant declines in the shares of horse
racing and charitable gambling.
Indian gambling has experienced dramatic
growth in recent years. Revenues have grown from an estimated
$120 million in 1991 to $5.4 billion in 1996--a
114 percent annual growth rate.
Prior to 1988, there was much uncertainty
as to what gambling could occur on Indian lands and under what
conditions. In 1988, Congress attempted to resolve many of these
issues by passing the Indian Gaming Regulatory Act (IGRA). The
IGRA separates gambling activities into three distinct classes or
categories, and provides different restrictions on Indian tribes
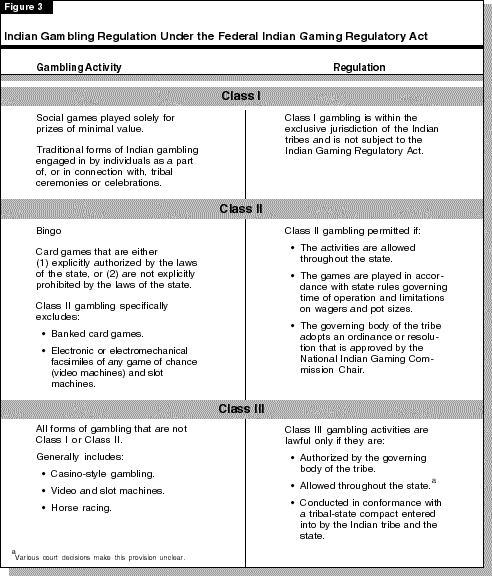
desiring to conduct such activities. Figure 3 summarizes the
act's regulatory categories.
The figure shows that, generally
speaking, Indian tribes may offer:
If the state allows Class III gambling
and an Indian tribe asks to negotiate a compact for operation of
those gambling activities on tribal land, then the state is
required to negotiate in good faith for a compact. There has been
much debate and differing court opinions regarding whether there
can be a tribal-state compact in a state that does not
allow Class III gambling. One interpretation of the IGRA is that
if a state does not allow Class III gambling, then it cannot
offer Class III gambling to Indian tribes. However, another
interpretation is that a state may offer Class III gambling to
Indian tribes even if it is not allowed elsewhere in the state.
Through mid-June 1997, a total of 145 Indian tribes in 24 states
had entered into 161 compacts for Class III gambling.
In California, the State Constitution has
provisions covering most types of gambling. Specifically, it:
The Constitution does not specifically
mention card rooms. The Legislature, however, has authorized card
rooms, allowing games (such as poker) where the card room
operator has no stake in the outcome of the game.
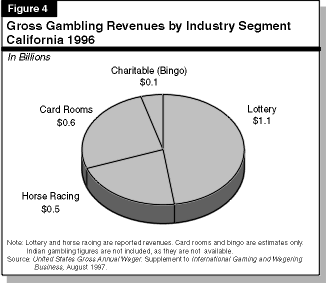
In 1996, estimated gross gambling
revenues for the California gambling industry totaled
$2.3 billion. (This does not include Indian gambling, for
which we do not have revenue estimates. The "best
guess" is that Indian gambling in the state generates
revenues easily in the hundreds of millions of dollars and
potentially exceeding a billion dollars a year.) This
revenue represents 5.7 percent of the comparable nationwide
total. As shown in Figure 4, the state lottery accounts for
nearly 50 percent of the statewide gambling revenues.
The California State Lottery (CSL) was
created by voter approval of Proposition 37 (the California
State Lottery Act of 1984). The lottery is operated and
administered by a five-member commission appointed by the
Governor. The Legislature has the authority to amend the Lottery
Act if, by doing so, it furthers the purposes of the measure.
The act specifies that the proceeds of
lottery ticket sales shall be distributed as follows:
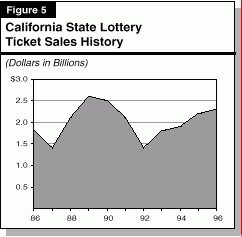
As shown in Figure 5, lottery ticket
sales declined in the second year of operation, grew to a peak of
$2.6 billion in 1989, declined again until 1992, and have
steadily increased since that time. Lottery sales in fiscal year
1995-96 totaled $2.3 billion.
The majority of these sales was from two
types of games the Super Lotto game (almost one-half of sales) and
Scratcher tickets (one-fourth of sales). Figure 6 summarizes
the games currently offered by the CSL.
| Figure
6 |
| California
State Lottery Games |
| As of December
1997 |
| |
| Super Lotto
Players choose a set of six
numbers (from 1 to 51) per play. A winning ticket is one
that matches any three, four, five, or all six numbers of
the six numbers drawn. Winning numbers are drawn every
Wednesday and Saturday.
|
| Scratchers
Scratchers are tickets with a
"scratch off" portion on each ticket. Players
can learn instantly how they fared, and cash in smaller
winnings on the spot. The lottery offers a variety of
different Scratchers and is constantly changing them. The
play styles, prize amounts, and ticket cost vary.
(Currently, Scratchers cost $1, $2, or $3 each.)
|
| Fantasy 5
Players pick a set of five
numbers from 1 to 39. Winning tickets are those that
match any two, three, four, or all five of the five
numbers drawn. Draws occur every day.
|
| Daily 3
Players pick a set of three
numbers from 0 to 9. Players can try to match the
three numbers drawn in the exact order or in various
combinations. The draw occurs every day.
|
| Hot Spot
Players pick the spot (set of
numbers) they want to play from 1 to 80. They can play
two, three, four, five, or eight spots. If players choose
to play a "three spot," then they pick a set of
three numbers. Draw takes place daily from 6:05 a.m. to
1 a.m., every five minutes. Players can learn
quickly how they fared.
|
| Big Spin Television Show Potential players can "win" a
ticket to be a player by playing a "Big Spin"
Scratcher ticket. If three SPIN symbols on the ticket
match, then the player gets a ticket to the show and wins
either $1,500 or a chance to spin the wheel at the show.
Prizes from spinning the wheel vary from $20,000 to
$2 million. Fantasy 5 players can also play to win
on the Big Spin show.
|
The state allows card rooms to conduct
certain "nonbanked," "nonpercentage" card
games. These are games where the card room operator has no stake
in the outcome of the game. The players play against each other
and pay the card room a fee for use of the facilities. Typical
card games include draw poker, 7-card stud, and Asian games, such
as pai gow. State law specifically prohibits certain games such as
twenty-one (blackjack), monte, and faro.
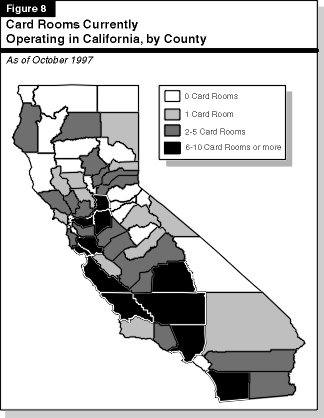
There are currently 176 active card rooms
operating a total of 1,883 tables in California (excluding rooms
operated on Indian land). As shown in Figures 7 and 8, these
card rooms are located throughout California.
Most card rooms are very small--less than
five tables. There are, however, six very large card rooms, which
operate one-half of the tables in the state. These clubs are:
California Commerce Club (300 tables), Bicycle Club (200 tables),
Hollywood Park Casino (140 tables), Normandie Club (120 tables),
and Crystal Park Casino (110 tables) all in Los Angeles County
and Ladbroke's Casino-San Pablo (100 tables) in Contra Costa
County.
Estimated 1996 revenue for the 176
California card rooms totaled $630 million. This is nearly
12 percent less than prior-year estimated revenues of
$712 million.
State Regulation.
State regulation of card rooms is currently in a period of
transition. The Legislature recently enacted The Gambling Control Act Chapter 867, Statutes of 1997 (SB 8,
Lockyer) that
established an overall umbrella of state regulation of card rooms
beginning January 1 of this year. (Prior to January 1, the
Attorney General's Office registered card rooms, but had only
minor regulatory authority.)
Under Chapter 867, the state will
regulate card rooms through a three-member Gambling Control Board
(for up to one year) and a new Division of Gambling Control in
the Attorney General's Office. A five-member Gambling Control
Commission will succeed the board on either January 1, 1999 or
upon enactment of a statute appropriating funds for the division
and the commission, whichever occurs first. The 1998-99
Governor's Budget includes about $5 million to carry
out the provisions of Chapter 867.
The responsibilities and authorities of
the division and the board/commission (hereafter referred to as
the commission) include licensing of owners and most employees,
investigating suspected violations of the Gambling Control Act,
granting approval of games, and assessing fines for violations of
the act. Thus, the state regulatory authority over card rooms has
significantly increased with the implementation of
Chapter 867.
Chapter 867 does not change local
governments' basic responsibilities concerning card rooms. They
will continue to approve card rooms in their jurisdiction, as
well as establish the hours of operation, table size and number,
and wagering limits.
The California Constitution authorizes
the Legislature to provide for the regulation of, and wagering
on, horse racing. Regulation of horse racing is the
responsibility of the California Horse Racing Board, which was
established by the Legislature in 1933. The board consists of
seven members appointed by the Governor.
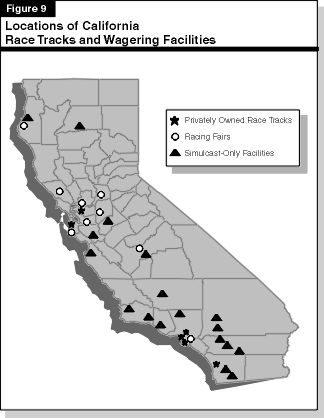
As shown in Figure 9, there are
currently 6 privately owned race tracks, 9 racing fairs, and 18
simulcast-only facilities operating in California. These latter
facilities do not have live racing; instead they allow betting on
televised races occurring elsewhere in the world. (All the race
tracks and fairs also have simulcast facilities.)
Four of the 18 simulcast-only facilities
are located on Indian land. Chapter 867 repeals the prior
statutory provision authorizing the board to negotiate with
tribes for parimutuel horse race wagering compacts. Any new
compacts for parimutuel horse race wagering would be subject to
the same process that is required for all other Class III
gambling activities on Indian lands.
In 1996, the California horse racing
industry grossed $461.3 million from wagers placed on races.
This is a 6 percent decline from prior-year revenues. The
horse racing industry in California and nationwide is
experiencing a steady decline in percent share of total gambling
revenues as well as a shift in player betting from on-track to
off-track sites.
Current California law provides for the
licensing of the various racing associations by type of racing
offered. As shown in Figure 10, the privately owned race
tracks offering thoroughbred racing represent the largest share
of the industry in California. It should be noted that the
different race meets for a single track represent different
licenses issued by the Horse Racing Board to racing associations
that then lease the track for the duration of the meet. For
example, the harness race meets held at Cal Expo in Sacramento
are operated by a private entity, while the California State
Fair, also held at Cal Expo, is a state agency.
The state receives revenue from horse
racing activities through facility license fees (based on a
percent of parimutuel handle), breakage (from rounding down to
the nearest 10 cents on winning tickets), unclaimed
parimutuel tickets, and occupational (jockeys, trainers, et
cetera) license fees and fines. State revenue from these sources
totaled $108 million ($69.6 million to the General
Fund) in fiscal year 1995-96, a 6.6 percent decline from the
previous year.
Existing law allows owners of a licensed
horse racing facility to operate one card room located on the
racetrack premises. Only one horse racing facility Hollywood
Park, located in Inglewood operates a card room. As noted above,
this card room operates 140 tables and is the third largest card
room (excluding card rooms on Indian land) in the state.
Charitable gambling serves as a
fund-raiser for nonprofit organizations. In California, bingo is
the only legal gambling activity for charity fund-raising.
Organizations operating bingo games must
do so in accordance with local ordinances. In general, these
ordinances specify limitations on days, locations, and hours of
operations of bingo games. Also, local governments may charge a
license fee for operating bingo games.
Charitable bingo operations in California
had estimated gross revenues totaling $55.5 million in 1996.
Similar to card rooms, charitable bingo revenues are not publicly
reported or audited. Consequently, the estimated revenues are not
verifiable.
According to the federal Bureau of Indian
Affairs, there are over 100 Indian rancherias/reservations in
California encompassing over 400,000 acres. These Indian lands
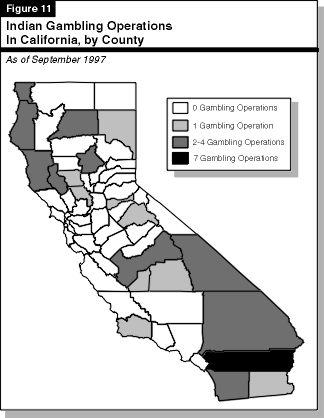
are located throughout the state in 38 different counties.
Currently, there are 41 Indian gambling operations in California,
located on rancherias/reservations throughout the state (see
Figure 11). The specific facilities and the operating tribes
are shown in Figure 12.
In past years, Indian gambling in
California consisted almost exclusively of bingo and card games
like those played in other statewide card rooms. This is because
these are the Class II gambling activities allowed in California
that the Indians could operate without a compact. As mentioned
above, all Class III gambling on Indian land requires a compact
between the state and the Indians. To date, California has
entered into compacts with five Indian tribes, allowing only
parimutuel wagering on horse racing.
In recent years, however, Indians have
offered other types of gambling. For instance, currently one of
the most debated issues concerning Indian gambling in California
is the operation of video machines in Indian casinos. According
to the IGRA, electronic games are Class III games and therefore
require a tribal-state compact. There are no recent statewide
estimates for the number of machines currently in operation on
Indian land. The Attorney General's Office, however, estimated in
1996 that there were over 12,000 video machines operating on
Indian lands in California.
In addition, twenty-one (blackjack) is
played in some Indian casinos (although the betting is slightly
different than in traditional casinos). As noted earlier,
twenty-one is specifically prohibited by state law, making it a
Class III activity in California (that is, there must be a
tribal-state compact).
Under federal law, all state laws
regarding the licensing, regulation, or prohibition of gambling
are applicable to gambling on Indian lands. However, the federal
law provides federal authorities with the exclusive jurisdiction
to prosecute any violations of state gambling laws on Indian
lands. Thus, the State of California does not have the legal
authority to enforce its gambling laws on Indian land. The
regulation of Indian gambling at the federal level is the
responsibility of the National Indian Gaming Commission, which
has the power to assess civil penalties for violations of the
IGRA. In addition, the commission can order the closure of any
Indian gambling operations for violations of the IGRA.
There are currently several cases
regarding various issues of Indian gambling in California pending
in the federal court system. These involve the issues of:
(1) off-track betting taxes collected at the wagering site
and (2) the legality of slot machines.
Implications for the
Legislature. At present, there is no clear process
for the state to reach agreement and enter into compacts with
Indian tribes for Class III gambling operations in California.
Under the IGRA, the state clearly has the authority to negotiate
Class III gambling. What is unclear, however, are what roles the
Legislature and Governor have in these negotiations. Furthermore,
given the gambling restrictions in the State Constitution and
state statutes, it is not clear what types of Class III
activities could be allowed under a tribal-state compact. In
light of these issues coupled with the growth in gambling
activities on Indian landswe recommend the Legislature clarify
(1) the process and procedures for negotiating Class III gambling
compacts with the Indian tribes, (2) the respective roles of both
the executive and the legislative branches in that process, and
(3) the specific Class III gambling activities that can be
negotiated in California.
| Acknowledgments
This report was prepared by Megan M.
Atkinson, under the supervision of Gerald Beavers.
The Legislative Analyst's Office (LAO) is a
nonpartisan office which provides fiscal and policy
information and advice to the Legislature.
|
Publications
To request publications call (916) 445-2375.
This report and others are available on the LAO's World
Wide Web site at http:// www.lao.ca.gov.
The LAO is located at 925 L Street, Suite 1000,
Sacramento, CA 95814. |
Return to LAO Home Page

