Legislative Analyst's Office, December 1998
 |
1998 Cal Facts
Program
Trends
Part III
|
|
Environment Is Biggest Water User
(In million acre-feet)a
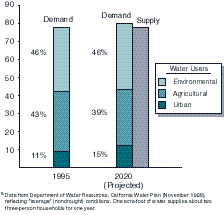
- The Department of Water Resources (DWR) projects that the greatest demand for water in 2020 will, as today, be for environmental uses (such as wetland
habitats, fisheries, and dedicated wild and scenic rivers). However, most of the growth in demand between 1995 and 2020 will come from the urban sector.
- Assuming nondrought water conditions, DWR projects that there will be a water shortfall in 2020 of 2.4 million acre-feet absent further actions to increase
water supplies and/or reduce demand.
Almost Half of All State-Owned
Wildlands Is Concentrated in Five Counties
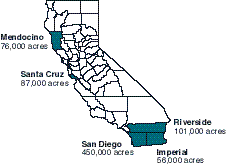
- Of the 102 million acres encompassed by the state of California, about 75 million acres are classified as wildlands. These lands include all undeveloped and
noncultivated property in the state, and are important sources of wildlife habitat. Ownership of these lands is divided among federal, state, local, and private
entities.
- About 2.2 percent of California's wildlands are owned by the state government. The federal government owns 60 percent, and 37 percent is privately owned.
- Of the 1.7 million acres of state-owned wildlands, 48 percent is concentrated in five counties. The Department of Forestry and Fire Protection is the primary
state landowner in Mendocino County, while the Department of Parks and Recreation is the primary state landowner in the other four.
Transportation Demand Outpaces Revenuesa
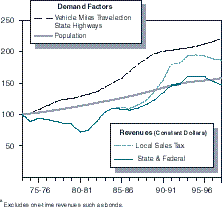
- For much of the last 25 years, growth in transportation demand--measured by growth in population and vehicle miles traveled (VMT)--has far exceeded the
growth in transportation revenues.
- By 1997-98, state and federal revenues for transportation improvements were about 70 percent higher than in 1973-74, after adjusting for inflation. While
this revenue growth rate was slightly higher than that of population, it substantially lagged behind VMT growth.
Federal Highway Funds to California Increasing Significantly
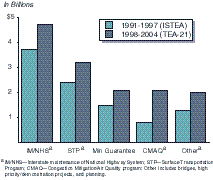
- Under the Transportation Equity Act for the 21st Century (TEA21), California will receive an estimated $15 billion in federal funds over the next six years
(from 1998 through 2004) for highway purposes. This is an average annual funding increase of more than $800 million (about 50 percent) over the funding
level provided by the previous federal act (ISTEA).
- The largest increase in highway funds will be in the Congestion Mitigation/Air Quality (CMAQ) program. This program funds projects that reduce
congestion and air pollution in urban areas that do not meet federal clean air standards.
Smog Check Program Requirements Vary by Area
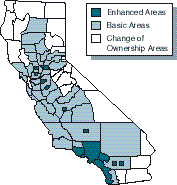
Most vehicles must undergo a smog check biennially, (major exceptions are vehicles not over four years old and pre-1974 vehicles).
California is divided into three types of areas:
- Enhanced Areas. Tests for oxides of nitrogen, hydrocarbon, and carbon monoxide emissions. Test is performed on a treadmill-like machine called a
dynamometer.
- Basic Areas. Tests for hydrocarbons and carbon monoxide only, using a two-speed idle test and tail pipe sensor.
- Change of Ownership Areas. Same test as in the basic areas but required only when a vehicle is sold.
Projected Capital Outlay Needs For the State and K-12 Education
1999-00 Through 2003-04
(In Billions)
|
Five-Year Total a |
|
|
| Transportation |
$19.6 |
| K-12 Education |
11.0 |
| Higher Education |
6.6 |
| Adult/Youth Prisons |
3.3 |
| Office Buildings/24-Hour
Health Care |
1.4 |
| Resources |
0.8 |
| Total |
$42.7 |
| a Based on five-year capital outlay plans prepared
by state agencies, except K-12 education and new
prison construction, which are the Legislative
Analyst's estimates. |
|
|
- As shown in the figure, an estimated $43 billion will be needed for capital outlay over the next five years. This total does not include many program areas
that the state has funded in the past--such as water quality improvements, county jails, and low-income housing.
- The state owns 15,000 miles of highways and 180 million square feet of building space, and leases an additional 20 million square feet of space.
- The state needs to renovate existing space to address safety concerns and to accommodate changes in programs. New facilities are also needed to
accommodate growth and to reduce leased space for long-term savings.
Voter Action on General Obligation Bonds Since 1986
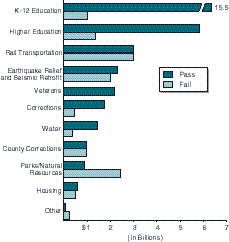
- Voters have approved almost $35 billion in bonds since 1986 and rejected $12 billion.
- About 45 percent of all approved bonds ($15.5 billion) have been for K-12 school facilities.
- In addition to voter-approved general obligation bonds, the Legislature has authorized almost $8 billion in lease-payment bonds since 1986 for higher
education facilities, prisons, and state office buildings.
Costs of Paying for a $100 Million Project
(In Millions)
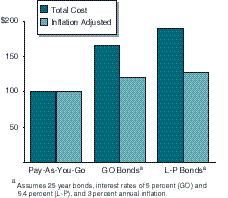
- The figure compares the cost of a $100 million project financed on a pay-as-you-go basis with the total principal and interest payments for the same project
using bonds.
- The general obligation (GO) bonds total cost is 65 percent more costly than pay-as-you-go (when adjusted for inflation, it is 20 percent more costly).
- The lease-payment (L-P) bonds total cost is 90 percent more costly than pay-as-you-go (when adjusted for inflation, it is 27 percent more costly).
Share of General Fund Revenue Needed for Bond Payments
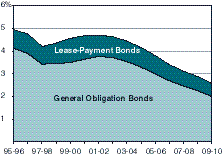
- The state's debt service ratio reflects the estimated costs to pay principal and interest on currently authorized state bonds as a percentage of projected state
General Fund revenues.
- After reaching 5.1percent in the mid-1990s, the debt ratio declined to 4.2percent in 1997-98, will increase to 4.7percent in 2001-02, and decline thereafter.
Authorization and sales of new bonds would increase these debt ratios.
- Debt payments will increase from $2.5billion in 1998-99 to $3.3billion in 2003-04 and decline thereafter if no additional bonds are approved.
Return to 1998 Cal Facts Table of Contents
Return to LAO Home Page


