

In this Cal Update, we examine how participation rates in California's public colleges and universities have changed over the past 20 years. The historical data show that a higher percentage of college-age Californians are attending public colleges than ever before. As a consequence, the percentage of adults that have obtained a college degree has increased significantly over the years.
The Master Plan for Higher Education, published in 1960, established student eligibility criteria that remain general state policy today. The plan calls for community colleges to accept all applicants 18 years and older who can benefit from attending. The 106 community colleges currently accommodate all persons seeking to attend. The plan calls for the California State University (CSU) to draw from the top one-third of high school graduates. It also calls for the segment to accept all qualified community college transfer students. Surveys by the California Postsecondary Education Commission (CPEC) have found that CSU has hovered near its eligibility-rate target of 33�percent over the years. In its most recent survey of high school graduates, CPEC found that CSU was drawing from the top 29.6�percent of high school graduates.
The Master Plan calls for the University of California (UC) to draw from the top 12.5�percent of high school graduates and to accept all qualified community college transfers. The university has always drawn from a larger pool than the top 12.5�percent, and has expanded the size of its eligibility pool significantly in this decade. Based on CPEC's 1996 survey, 20.5�percent of public high school graduates obtained a 3.3 grade point average (GPA) in college preparatory courses as required for UC admissions. For various reasons, almost half of these students did not take the SAT II test, which is also required for admission to UC. (According to the university, no other college or university in the country requires this test.) Consequently, although 11.1�percent of high school graduates in 1996 met admissions requirements for UC, they were spread among the top 20.5�percent of high school graduates.
The UC Board of Regents recently voted to extend eligibility to the top 4�percent of high school graduates from each high school, provided they too take the SAT I and SAT II tests. Two-thirds of this pool already meet UC admissions criteria. Almost all of the others in this 4�percent group meet the 3.3 GPA requirement, but have not taken the SAT I and SAT II tests. Therefore, they generally fall within the 20.5�percent of top high school graduates from which UC currently draws its students.
In 1997, approximately 30�percent of California adults between the ages of 18 and 24 were enrolled on a community college, CSU, or UC campus. This is the highest participation rate for this prime college-going age group in history. By comparison, 23�percent of 18-to-24 year olds were enrolled on a public college or university campus in 1977. There are many reasons for this increase. For example, rates of graduation from high school have risen over time, greater emphasis is placed on college attendance today than ever before, and the percentage of parents with a college education has risen sharply over the last few decades. In addition, state funding of colleges and universities per college-age Californian is at an all-time high, even after controlling for the effects of inflation.
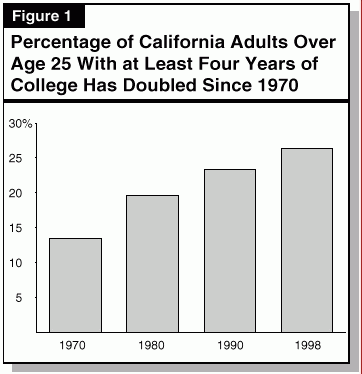
While the participation rate of the prime college-going age group of 18-to-24 year olds has climbed steadily over the past 20 years, participation rates among older adults has steadily fallen. In 1997, 4.4�percent of adults 25 years old and older were enrolled in a California public college or university. This compares to 5.4�percent in 1977. This decline is due in large part to the increasing college-going and college-completion rates of younger adults. As Figure�1 shows, 26.4�percent of adults 25 years and older in 1997 had at least four years of college. By comparison, about half (13.4�percent) as many in this age group had done so in 1970. While college participation remains an option for most older adults, many more of them today have already participated as younger adults.
Community Colleges. Figure�2 shows the percentage of California adults attending community colleges from 1977 through 1997 by age cohort. As the figure shows, more than one in four Californians age 18-to-19 were enrolled in a community college in 1997. In 1977, one in five were enrolled. Enrollment among 20-to-24 year olds has increased similarly. In 1997, 16.1�percent of this group were enrolled in a community college, whereas 11.5�percent were enrolled in 1977.
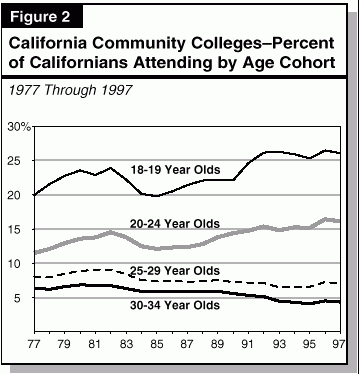
In its document California Community Colleges 2005 and in testimony before the Legislature, the community colleges cite falling participation rates in community colleges among adults as a serious problem. The historical data do not support this claim. The decline in adult participation can be explained by two factors:
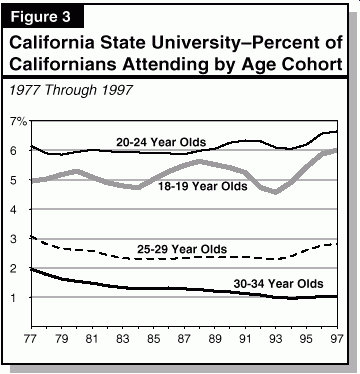
California State University. As Figure�3 shows, participation rates among college-age adults have risen at CSU over the past 20 years. For 18-to-19 year olds, they have risen from 4.9�percent to 6.1�percent. For 20-to-24 year olds, they have risen from 6.1�percent to 6.6�percent. Comparing participation rate histories of the community colleges and CSU, it appears that enrollment frequently shift between the two segments. Particularly, since 1990, when participation rates of 18-to-19 year olds at CSU have fallen significantly, participation rates of this cohort at community colleges have tended to rise. Conversely, when CSU participation rates for this group have risen significantly, community college rates have tended to be flat. These shifts might have occurred for many reasons, including changes in the fee differential between the two segments.
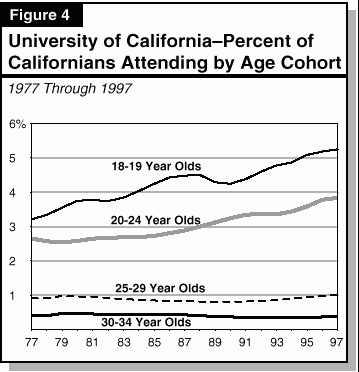
University of California. As Figure�4 (see next page) shows, participation among college-age adults at UC has risen significantly during the past 20 years. For 18-to-19 year olds, participation rates have increased from 3.2�percent in 1977 to 5.3�percent in 1997, an increase of 64�percent over this 20 year period. This rate of increase is over twice that of community colleges and over three times that of CSU. The participation rate among 20-to-24 year olds has also grown faster at UC than at either CSU or the community colleges.
Participation in Public Higher Education Not the Entire Story. The data shown and discussed above are for the three public segments of higher education only. They do not include enrollments in independent colleges and universities. For example, over 30�percent of students in four-year colleges in California are enrolled in independent colleges and universities. Many others attend public and private colleges and universities outside California. Unfortunately, data on enrollments by age of student are not available for all institutions.
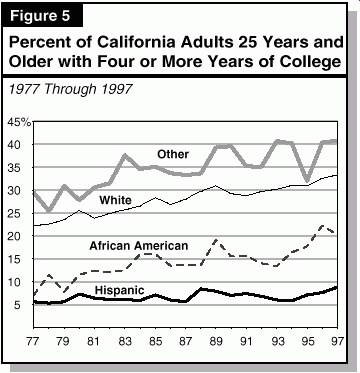
Growth in Participation Across All Racial and Ethnic Groups. College participation has trended upward for all racial and ethnic groups over time. As a result, increasingly more adults in all groups have obtained four or more years of college. Figure�5 shows the number of Californians 25 years old and older that have attended college for four or more years. (These U.S. Census Bureau data, up to 1993, show Californians 25 years old and older with four or more years of college, and after 1993, show those with at least a bachelors degree.) Although college experience has increased for each racial and ethnic group shown in Figure�5, there nevertheless remain significant differences in the level of participation among the groups.
As the data clearly show, college-going rates among 18-to-24 year olds has trended upward over time. While participation rates among older adults have trended downward, this reflects the state's success in prior years in providing college to its younger adults.
Contact--Buzz Breedlove--(916) 445-8641 Or visit our web site at: www.lao.ca.gov