Legislative Analyst's Office, December 2000

California's Economy and
Budget in Perspective |
2000 Cal Facts
Program Trends
Part 3
|
SSI/SSP Caseload Growing Again
(Cases in Thousands)
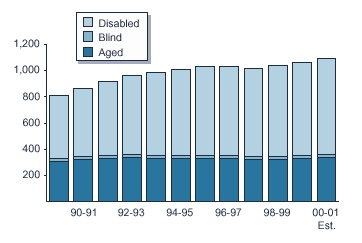
- The SSI/SSP program provides cash assistance to low income persons who are elderly, disabled, or blind.
- The caseload leveled off in the mid-1990s, in part because of federal law changes that restricted eligibility for disabled children and certain noncitizens.
Subsequent to these changes, caseload growth has resumed, with most of the growth being in the disabled component.
- About 7,000 recipients of the state-only program for certain legal noncitizens (created in 1998) are not included in this figure.
CalWORKs Caseload Declining, But More Slowly Than National Average. . .
(Cases in Thousands)
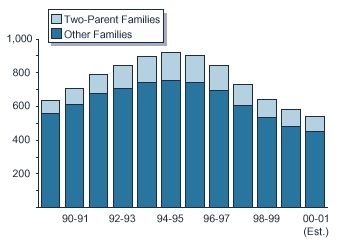
- After peaking in 1994-95, the caseload declined 37 percent by 1999-00 and is projected to decline an additional 7 percent in 2000-01.
- The caseload decline resulted from a combination of demographic trends (such as birth rates for young women), the economic expansion, and welfare reform.
- Since the 1996 enactment of welfare reform, the U.S. caseload declined by 47 percent (August 1996 to December 1999), as compared to 35 percent in
California. (California's position, relative to other states, reflects policies discussed on the next page.)
However, More CalWORKs Families Working Than in Other States
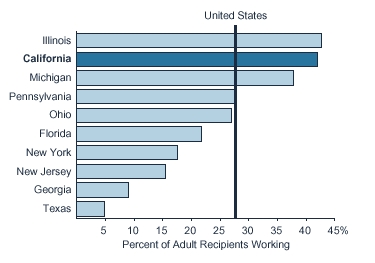
- In California, 42 percent of adult CalWORKs recipients are working in unsubsidized jobs.
- Among the ten largest states, California's percentage of adult welfare recipients in unsubsidized employment is second only to that of Illinois.
- California's relatively low caseload decline (as pointed out on the prior page) and relatively high rate of unsubsidized employment reflect CalWORKs policy.
Specifically, California's higher benefit levels, combined with a generous earnings disregard, allow recipients to work without immediately removing them
from the caseload.
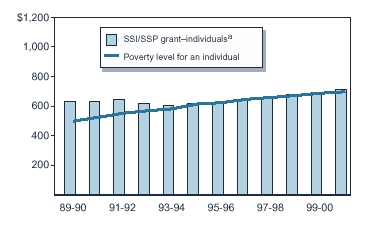
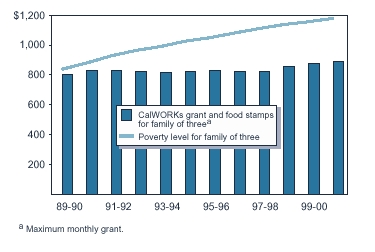
SSI/SSP Grant Is Just Above Poverty Level. . .
While CalWORKs Grant Is Significantly Below Poverty Level
Child Support Collections Rising but Cost-Effectiveness Flat
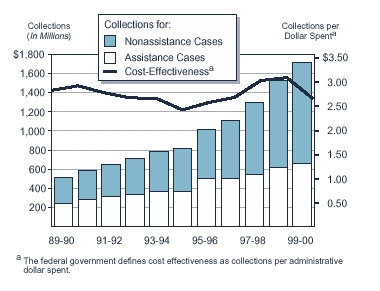
- Child support collections for assistance (CalWORKs) and nonassistance families have increased steadily each year, from $511 million in 1989-90 to $1.7
billion in 1999-00.
- State savings (recoupment) in CalWORKs grants due to the collection of child support increased from $102 million General Fund in 1989-90 to $298 million
General Fund in 1999-00.
- For every dollar California spends on administration, it has collected between $2.50 and $3 in child support payments. By comparison, the 1999 national
average was approximately $4 collected for this measure of cost-effectiveness.
Most Foster Care Placements Are
In Foster Family Homes
| Placement Type/Description |
Caseload a 2000 |
Monthly Grant Per Child 2000-01 |
|
|
|
| Foster Family Homes |
68,800b |
$405-$569 |
- Provides 24-hour care and supervision to no more than six foster children in the foster parent's home.
|
- Foster care grant may be supplemented for care of children with special needs.
|
|
Foster Family Agency Homes
| 19,000 |
$1,467-$1,730 |
Foster Care Caseload Levels Off
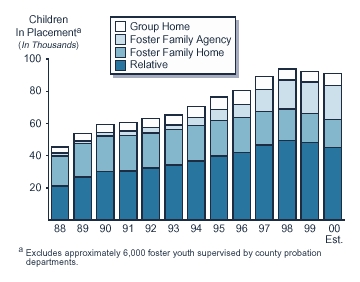
- The total foster care population grew steadily throughout the 1990s, from almost 44,000 in 1988 to a peak of over 94,000 in 1998. Since then, the caseload
has started to decline, partially due to the advent of Kin-GAP, which allows children to exit the foster care system to family caregivers.
- Since 1988, foster family agency placements increased more than twenty-fold while less costly non-relative foster family home placements declined slightly.
Health Insurance Coverage
Increases With Income
1999
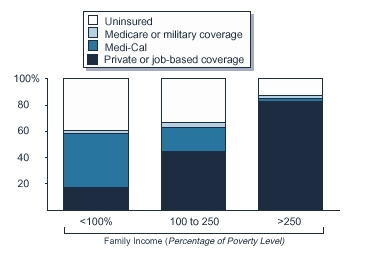
- The uninsured generally are low-income working individuals or families--under 250 percent of the federal poverty level.
- Job-based health insurance coverage increases with income for low-income workers, while the number covered by Medi-Cal declines.
- Almost 90 percent of nonelderly Californians with incomes above 250 percent of poverty have health insurance coverage.
Medi-Cal Caseload Growth Resumes And Cost Increases Continue
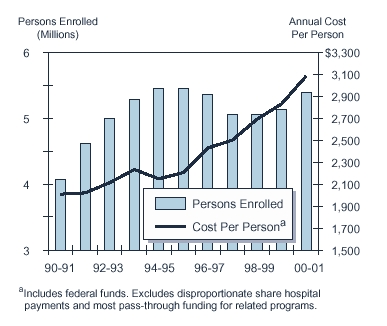
- Medi-Cal caseload grew rapidly during the early 1990s as a result of (1) eligibility expansions and (2) increased welfare caseload during the recession, and
then declined in the mid-1990s as the economy recovered.
- Current caseload growth results from (1) actions to expand and simplify eligibility for children and working families and (2) increased outreach efforts.
- The annual cost increase per person for Medi-Cal benefits has averaged 6.9�percent since 1995-96 due to provider rate increases, increased spending on
drugs, and other factors.
Most Medi-Cal Families/Children
No Longer on Welfare
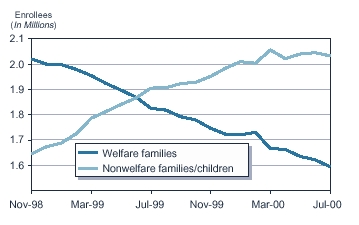
- By July 1999, for the first time in the history of the Medi-Cal Program, welfare (CalWORKs) recipients accounted for less than half of the families
(including pregnant women) and children enrolled in the program. This trend has continued and Medi-Cal enrollment of nonwelfare families and children now
exceeds those on welfare by more than 400,000.
- The reduction in the welfare component of the Medi-Cal caseload is generally attributable to welfare reform and a strong job market. The growth in the
nonwelfare component is due to recent legislative changes that have expanded and simplified Medi-Cal eligibility for low-income working families.
- Most elderly or disabled Medi-Cal enrollees continue to be welfare recipients who receive benefits under the Supplemental Security Income/State
Supplementary Program.
Most Medi-Cal Spending Is for
Elderly/Disabled
2000-01
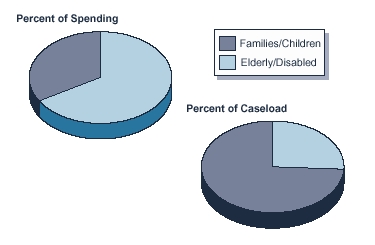
- The average cost of health care for elderly and disabled Medi-Cal beneficiaries is much higher than that for families and children, most of whom generally are
healthy.
- Although elderly and disabled persons comprise only one-fourth of the Medi-Cal caseload, they account for two-thirds of the costs of Medi-Cal health
benefits. These figures do not include costs paid for by the federal Medicare Program, which also covers most elderly and some disabled Medi-Cal
beneficiaries.
California Relatively Healthy
According to Some Key Measures
|
California |
U.S. |
|
|
|
| Infant mortality rate, 1998 (deaths per 1,000 live births) |
5.8 |
7.2 |
| Child mortality rate, 1997 (deaths per 100,000 children ages 1 to 14) |
21.0 |
25.0 |
| Low birth-weight births (%), 1998 |
6.2 |
7.6 |
| New AIDS cases (rate), 1999 (per 100,000) |
16.4 |
16.7 |
| Persons with asthma (%), 1998 |
6.8 |
7.8 |
| Adult smokers (%), 1998 (age 18 and over) |
18.4 |
24.0 |
|
|
|
- The state fairs well in comparison with the nation on a number of statistical measures of health, as shown above.
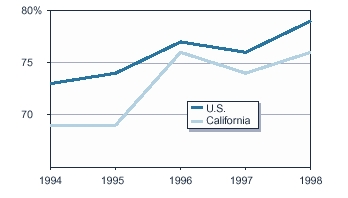
- In 1998 (the most recent data available), the U.S. and California experienced historically high rates of preschool immunizations. However, these rates remain
below the federal goal of having 90 percent of all two-year-olds fully immunized by 2000.
Immunized Children 19 to 35 Months
Return to 2000 Cal Facts Table of Contents
Continue to 2000 Cal Facts Program Trends Part 4
Return to LAO Home Page